. 2024 Oct;121(40):e2403003121.
doi: 10.1073/pnas.2403003121. Epub 2024 Sep 26.

NOTUM-mediated WNT silencing drives extravillous trophoblast cell lineage development

Affiliations

NOTUM-mediated WNT silencing drives extravillous trophoblast cell lineage development

Vinay Shukla et al. Proc Natl Acad Sci U S A. 2024 Oct.

Abstract

Trophoblast stem (TS) cells have the unique capacity to differentiate into specialized cell types, including extravillous trophoblast (EVT) cells. EVT cells invade into and transform the uterus where they act to remodel the vasculature facilitating the redirection of maternal nutrients to the developing fetus. Disruptions in EVT cell development and function are at the core of pregnancy-related disease. WNT-activated signal transduction is a conserved regulator of morphogenesis of many organ systems, including the placenta. In human TS cells, activation of canonical WNT signaling is critical for maintenance of the TS cell stem state and its downregulation accompanies EVT cell differentiation. We show that aberrant WNT signaling undermines EVT cell differentiation. Notum, palmitoleoyl-protein carboxylesterase (NOTUM), a negative regulator of canonical WNT signaling, was prominently expressed in first-trimester EVT cells developing in situ and up-regulated in EVT cells derived from human TS cells. Furthermore, NOTUM was required for optimal human TS cell differentiation to EVT cells. Activation of NOTUM in EVT cells is driven, at least in part, by endothelial Per-Arnt-Sim (PAS) domain 1 (also called hypoxia-inducible factor 2 alpha). Collectively, our findings indicate that canonical Wingless-related integration site (WNT) signaling is essential for maintenance of human trophoblast cell stemness and regulation of human TS cell differentiation. Downregulation of canonical WNT signaling via the actions of NOTUM is required for optimal EVT cell differentiation.

Keywords: NOTUM; WNT; extravillous trophoblast cells; placenta.


Conflict of interest statement

Competing interests statement:The authors declare no competing interest.

Figures
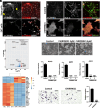
Fig. 1.
Fig. 1.
WNT activation disrupts EVT cell differentiation. Experiments were performed with X,X CT-27 cells. (A) Immunocytochemistry of active CTNNB1 (a-CTNNB1) protein expression in stem and EVT cells. (Scale bar: 50 μm.) DAPI stains nuclei gray (Right). Yellow arrows indicate active CTTNB1 in nuclei of TS cells. (B) a-CTNNB1 and HLA-G protein expression assessed in the presence of the WNT activator, CHIR99021 (2 μM). DAPI nuclei are shown in gray (Right). Merged fluorescence images of a-CTNNB1, HLA-G, and DAPI images. (Scale bar: 50 μm.) (C) Phase contrast images depicting cell morphology of EVT cells in control conditions or in the presence of CHIR99021 on day 8 of EVT cell differentiation. (Scale bar: 100 μm.) (D) Transcript levels for EVT cell–associated transcripts: HLA-G, MMP2, and ASCL2 on day 8 of EVT cell differentiation in control conditions or in the presence of CHIR99021, n = 3, Graphs represent mean values ± SEM, one-way ANOVA, Tukey’s post hoc test, ****P < 0.0001. (E and F) A volcano plot and a heat map depicting RNA-seq analysis of control and CHIR99021 treated EVT cells (n = 3 per group). (E) Blue dots represent significantly down-regulated transcripts (P ≤ 0.05) and a logarithm of base twofold change of less than or equal to −2. Red dots represent significantly up-regulated transcripts with P ≤ 0.05 and a logarithm of base twofold change of ≥2. (F) Heat map colors represent z-scores of reads per kilobase per million (RPKM) values. (G) Matrigel invasion assay of control or CHIR9902 (2 μM) treated cells under conditions promoting EVT cell differentiation. (H) The relative number of invading cells for control and CHIR9902 (2 μM) treated cells. Mean values ± SEM are presented, n = 3, unpaired t test, ****P < 0.0001.
Fig. 2.
Fig. 2.
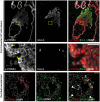
Immunofluorescence of first-trimester human placenta at 12 wk of gestation tested for the presence of active CTNNB1 (a-CTNNB1) and HLA-G. (A) a-CTNNB1 is expressed in cytotrophoblast, whereas (B) HLA-G is expressed in cells of the EVT cell column but not in cytotrophoblast or ST compartments. (C) Merged fluorescence images of a-CTNNB1 (red) and HLA-G (green). (DF) High magnification images of yellow Insets shown in panels (AC), respectfully. Yellow arrows indicate a-CTTNB1 in nuclei of cytotrophoblasts. (Scale bar: 50 μm.) Decidual bed tissue immunostained for a-CTNNB1 [red, panel (G)], HLA-G [green, panel (H)], and merged fluorescence images of a-CTNNB1 (red) and HLA-G [green, panel (I)]. White arrowheads indicate EVT cells positive for HLA-G but negative for a-CTNNB1. Unfilled white arrowheads indicate EVT cells coexpressing HLA-G and a-CTNNB1. DAPI-positive nuclei are shown in gray. (Scale bar: 50 μm.)
Fig. 3.
Fig. 3.
NOTUM is expressed in EVT cells. (A) Transcript levels of NOTUM in X,X CT-27 TS cells maintained in the stem state (STEM) or induced to differentiate into ST or day 8 EVT differentiation cells. Graphs represent mean values ± SEM, one-way ANOVA, Tukey’s post hoc test, n = 4, ****P < 0.0001. (B) Western blot detection of NOTUM and GAPDH expression in X,X CT-27 TS cells maintained in the stem state or induced to differentiate into ST or EVT cells. (C) Immunofluorescence localization of NOTUM protein in TS cells maintained in the stem state or induced to differentiate into EVT cells. DAPI-positive nuclei are shown in gray. (D and E) In situ hybridization of first-trimester human placenta at 12 wk of gestation probed for NOTUM (red), CDH1 (green), or PLAC8 (green). NOTUM (red) is expressed in EVT cell columns but not in basal cytotrophoblast. DAPI-positive nuclei are shown in gray. (F) Decidual bed tissue immunostained for NOTUM (red) and HLA-G (green). White arrowheads indicate EVT cells positive for HLA-G and NOTUM. Unfilled white arrowheads indicate EVT cells positive for HLA-G and negative for NOTUM. (G) Decidual bed tissue immunostained for NOTUM (red) and a-CTNNB1 (green). DAPI-positive nuclei are shown in gray. (Scale bar: 50 μm.)
Fig. 4.
Fig. 4.
NOTUM regulates EVT cell differentiation. Experiments were performed with X,X CT-27 cells following 8 d of EVT cell differentiation. Effectiveness of NOTUM shRNA treatment was determined by (A) RT-qPCR and (B) western blotting. GAPDH was used as a loading control for the western blot. (C) Phase contrast images depicting cell morphology of TS cells cultured in conditions to promote EVT cell differentiation transduced with control shRNA or NOTUM shRNA. (Scale bar: 200 μm.) (D) Transcript levels of EVT cell markers (HLA-G, MMP2, ASCL2, FSTL3, and TFPI) in control shRNA and NOTUM shRNA treated cells following exposure to conditions that promote EVT cell differentiation. NOTUM knockdown decreased levels of transcripts characteristic of EVT cells (n = 3 transductions), Graphs represent mean values ± SEM, n = 3, unpaired t test ****P < 0.0001. (E) Immunofluorescence of HLA-G (green) in control shRNA and NOTUM shRNA treated cells following exposure to conditions that promote EVT cell differentiation. DAPI-positive nuclei are shown in blue. Merged fluorescence images of HLA-G and DAPI. (Scale bar: 500 μm.) (F and G) A volcano plot and a heat map depicting RNA-seq analysis of control shRNA and NOTUM shRNA treated EVT cells (n = 3 per group). (F) Blue dots represent significantly down-regulated transcripts (P ≤ 0.05) and a logarithm of base twofold change of less than or equal to −2. Red dots represent significantly up-regulated transcripts with P ≤ 0.05 and a logarithm of base twofold change of ≥2. (G) Heat map of control shRNA and NOTUM shRNA treated TS cells induced to differentiate into EVT cells. Colors represent z-scores of RPKM values. (H) Matrigel invasion assay of control shRNA or NOTUM shRNA treated cells under conditions promoting EVT cell differentiation. (I) The relative number of invading cells of control shRNA and NOTUM shRNA treated cells. Graphs represent mean values ± SEM, n = 3, unpaired t test, ****P < 0.0001.
Fig. 5.
Fig. 5.
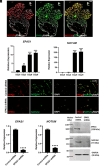
Upstream regulation of NOTUM in EVT cells. (A) In situ hybridization of first-trimester human placenta at 12 wk of gestation probed for NOTUM (red) and EPAS1 (green). NOTUM (red) and EPAS1 (green) are colocalized and expressed in the distal region of the EVT cell column but not in basal cytotrophoblast. DAPI-positive nuclei are shown in gray. (Scale bar: 50 μm.) The next series of experiments were performed with X,X CT-27 cells. (B) Time course of EPAS1 and NOTUM from stem state (Day 0) and days 3, 6, and 8 of EVT cell differentiation. Graphs represent mean values ± SEM, one-way ANOVA, Tukey’s post hoc test, n = 4, **P < 0.01, ****P < 0.0001. (C) Immunofluorescence of EPAS1/HIF2A (red) and NOTUM (green) in TS cells induced to differentiate into EVT cells following transduction with lentivirus containing control shRNA or EPAS1 shRNA. DAPI-positive nuclei are shown in gray. Merged fluorescence images EPAS1, NOTUM, and DAPI. (Scale bar: 500 μm.) Effects of EPAS1 shRNA knockdown on EPAS1 and NOTUM expression following 8 d of EVT cell differentiation assessed by RT-qPCR (D), graphs represent mean values ± SEM, n = 3, unpaired t test ****P < 0.0001, and western blotting (E). GAPDH was used as a loading control for the western blot.

Update of

References

    1. Burton G. J., Fowden A. L., Thornburg K. L., Placental origins of chronic disease. Physiol. Rev. 96, 1509–1565 (2016). - PMC - PubMed
    1. Hemberger M., Hanna C. W., Dean W., Mechanisms of early placental development in mouse and humans. Nat. Rev. Genet. 21, 27–43 (2020). - PubMed
    1. Maltepe E., Fisher S. J., Placenta: The forgotten organ. Annu. Rev. Cell Dev. Biol. 31, 523–552 (2015). - PubMed
    1. Knöfler M., et al. , Human placenta and trophoblast development: Key molecular mechanisms and model systems. Cell Mol. Life Sci. 76, 3479–3496 (2019). - PMC - PubMed
    1. Soares M. J., Varberg K. M., Iqbal K., Hemochorial placentation: Development, function, and adaptations. Biol. Reprod. 99, 196–211 (2018). - PMC - PubMed

LinkOut - more resources