. 2024 Sep 26;134(22):e174415.
doi: 10.1172/JCI174415.

TSC/mTORC1 mediates mTORC2/AKT1 signaling in c-MYC-induced murine hepatocarcinogenesis via centromere protein M

Affiliations

TSC/mTORC1 mediates mTORC2/AKT1 signaling in c-MYC-induced murine hepatocarcinogenesis via centromere protein M

Yi Zhou et al. J Clin Invest. .

Abstract

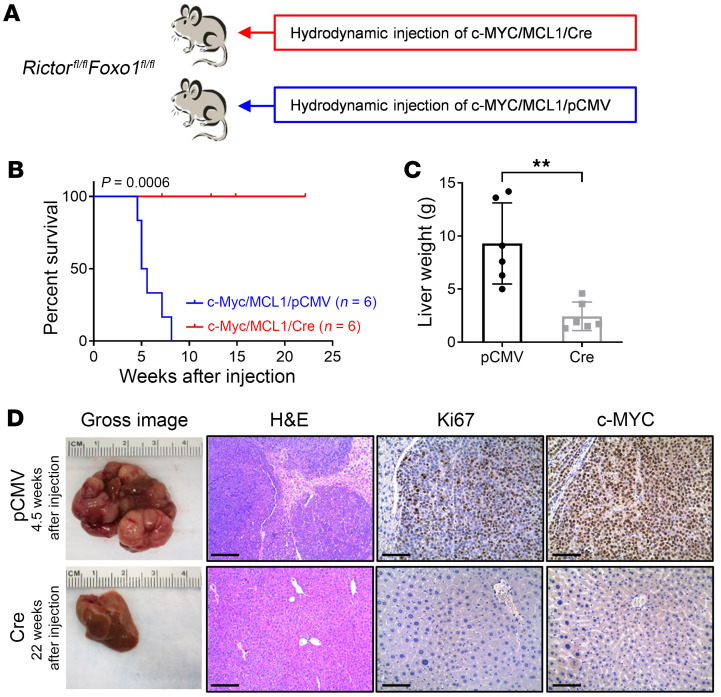
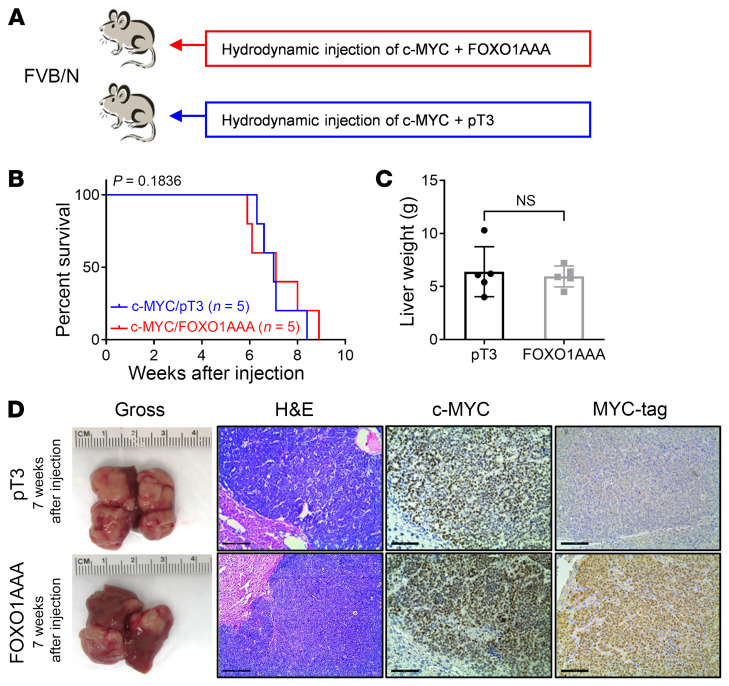
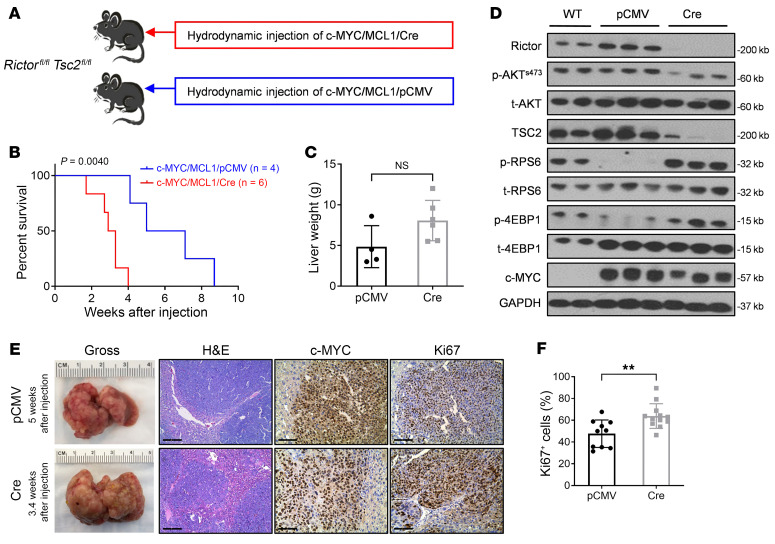
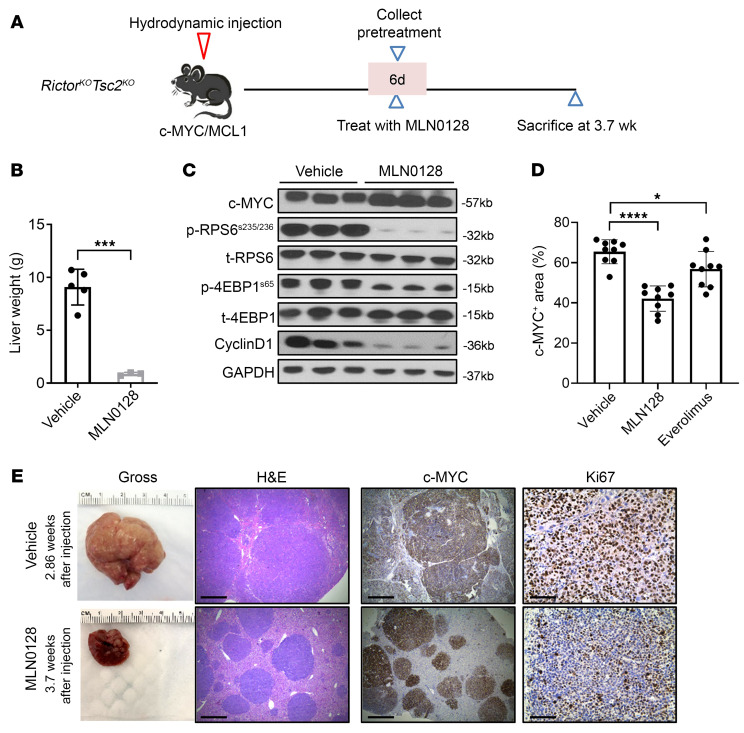
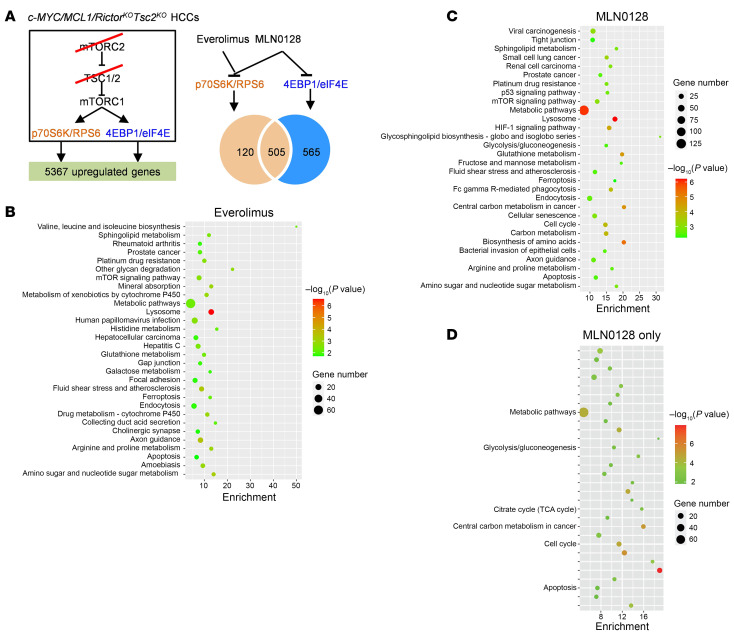
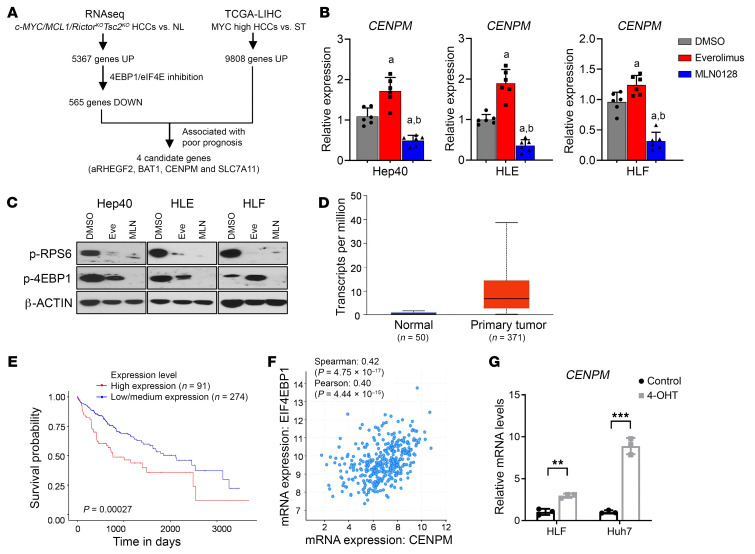
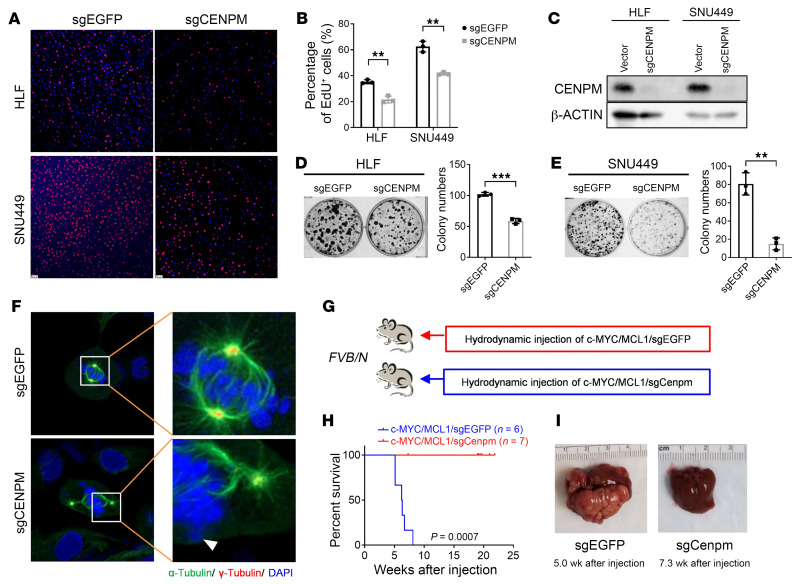
Activated mTORC2/AKT signaling plays a role in hepatocellular carcinoma (HCC). Research has shown that TSC/mTORC1 and FOXO1 are distinct downstream effectors of AKT signaling in liver regeneration and metabolism. However, the mechanisms by which these pathways mediate mTORC2/AKT activation in HCC are not yet fully understood. Amplification and activation of c-MYC are key molecular events in HCC. In this study, we explored the roles of tuberous sclerosis complex/mTORC1 (TSC/mTORC1) and FOXO1 as downstream effectors of mTORC2/AKT1 in c-MYC-induced hepatocarcinogenesis. Using various genetic approaches in mice, we found that manipulating the FOXO pathway had a minimal effect on c-MYC-induced HCC. In contrast, loss of mTORC2 inhibited c-MYC-induced HCC, an effect that was completely reversed by ablation of TSC2, which activated mTORC1. Additionally, we discovered that p70/RPS6 and 4EBP1/eIF4E acted downstream of mTORC1, regulating distinct molecular pathways. Notably, the 4EBP1/eIF4E cascade is crucial for cell proliferation and glycolysis in c-MYC-induced HCC. We also identified centromere protein M (CENPM) as a downstream target of the TSC2/mTORC1 pathway in c-MYC-driven hepatocarcinogenesis, and its ablation entirely inhibited c-MYC-dependent HCC formation. Our findings demonstrate that the TSC/mTORC1/CENPM pathway, rather than the FOXO cascade, is the primary signaling pathway regulating c-MYC-driven hepatocarcinogenesis. Targeting CENPM holds therapeutic potential for treating c-MYC-driven HCC.

Keywords: Hepatology; Liver cancer; Mouse models; Oncology; Signal transduction.


Figures

Figure 1
Figure 1. FoxO1 deletion fails to rescue the loss of the tumor-inhibitory effects mTORC2.
(A) Study design. Rictorfl/fl Foxo1fl/fl conditional-KO mice were hydrodynamically injected with plasmid mixtures of c-MYC/ MCL1 and Cre recombinase in a pCMV backbone (c-MYC/MCL1/Cre, n = 6). Control mice were hydrodynamically injected with c-MYC/MCL1 and pCMV empty vector (c-MYC/MCL1/pCMV, n = 6) constructs. Mice were monitored for tumor development and euthanized when moribund tumors developed or until the end of the observation period. (B) Survival curve for mice in both groups. A Kaplan-Meier comparison was performed; P = 0.0006. (C) Comparison of liver weights between the 2 groups. Data are presented as the mean ± SD. **P < 0.01, by 2-tailed Student’s t test. (D) Representative macroscopic images of livers, H&E stainings, and immunohistochemical staining for Ki67 and c-MYC. Scale bars: 200 μm (H&E); 100 μm (Ki67 and c-MYC).
Figure 2
Figure 2. Lack of effect of FOXO1 activation on c-MYC–induced hepatocarcinogenesis.
(A) Study design. FVB/N mice were hydrodynamically injected with plasmid mixtures of c-MYC and a constitutively active mutant of FoxO1 (FoxO1AAA) in a pT3-EF1α backbone with MYC-tag (c-MYC/FoxO1AAA, n = 5). Control mice were hydrodynamically injected with c-MYC/MCL1 and pT3-EF1α empty vector (c-MYC/pT3, n = 5). Mice were monitored for tumor development and euthanized when moribund tumors developed or until the end of the observation period. (B) Survival curve for mice in both groups. A Kaplan-Meier comparison was performed; P = 0.1836. (C) Comparison of liver weights between the 2 groups. Data are presented as the mean ± SD. A 2-tailed Student’s t test was used to determine significance. (D) Representative macroscopic images of livers, H&E stainings, and immunohistochemical staining for c-MYC and MYC-tag. Scale bars: 200 μm (H&E); 100 μm (c-MYC and MYC-tag).
Figure 3
Figure 3. Compensation of the tumor-inhibitory effects of mTORC2 by Tsc2 deletion.
(A) Study design. Rictorfl/fl Tsc2fl/fl conditional-KO mice were hydrodynamically injected with plasmid mixtures of c-MYC/MCL1 and Cre recombinase in a pCMV backbone (c-MYC/MCL1/Cre, n = 4). Control mice were hydrodynamically injected with c-MYC/MCL1 and pCMV empty vector (c-MYC/ MCL1/pCMV, n = 6). Mice were monitored for tumor development and euthanized when moribund tumors developed or until the end of the observation period. (B) Survival curve for mice in both groups. A Kaplan-Meier comparison was performed; P = 0.0040. (C) Comparison of liver weights between the 2 groups. Data are presented as the mean ± SD. A 2-tailed Student’s t test was used to determine significance. (D) Western blot results show expression levels of Rictor, TSC2, and other proteins in the mTORC2/AKT cascades. (E) Representative macroscopic images of the liver, H&E stainings, and immunohistochemical staining for Ki67 and c-MYC. Scale bars: 200 μm (H&E); 100 μm (Ki67 and c-MYC). (F) Quantification results of the percentage of Ki67+ cells in the 2 groups. Data are presented as the mean ± SD. **P < 0.01, by 2-tailed Student’s t test.
Figure 4
Figure 4. Inhibition of c-MYC/MCL1/RictorKO Tsc2KO tumor growth by MLN0128 treatment.
(A) Study design. The c-MYC/MCL1/RictorKOTsc2KO murine tumor model was established by hydrodynamic injection. Six days after injection, 1 group of mice (n = 3) was sacrificed, and mouse livers were harvested for analysis as the pretreatment group. The remaining mice were treated with MLN0128 (n = 3) or vehicle (n = 5) for 3 weeks. Subsequently, all mice were sacrificed for analysis. (B) Comparison of liver weights between the MLN0128 and vehicle-treated groups. (C) Western blot analysis showing the levels of c-MYC, cyclin D1, and key molecules downstream of mTORC2 (n = 3, 3). GAPDH was used as the loading control. (D) Comparison of c-MYC+ areas in the MLN0128-, everolimus-, and vehicle-treated groups. (E) Representative images of gross views of the liver, H&E stainings, and immunohistochemical staining for Ki67 and c-MYC. Scale bars: 500 μm (H&E and c-MYC); 100 μm (Ki67). Data are presented as the mean ± SD. *P < 0.05, ***P < 0.001, and ****P < 0.0001, by 2-tailed Student’s t test.
Figure 5
Figure 5. Analysis of p70S6K/RPS6 and 4EBP1/eIF4E downstream target genes.
(A) Study design. Schematic diagram showing the signaling pathways involved in the c-MYC/MCL1/RictorKO Tsc2KO tumors (left panel). RNA-Seq was performed on the normal liver tissue, and c-MYC/MCL1/RictorKO Tsc2KO tumors were treated with vehicle, everolimus, or MLN0128 (n = 3, 3, 3). Venn diagram shows the number of DEGs. (B) KEGG analysis of the DEGs downregulated by MLN0128. (C) KEGG analysis of the DEGs downregulated by everolimus. (D) KEGG analysis of the DEGs downregulated by MLN0128, but not everolimus.
Figure 6
Figure 6. CENPM is a central effector downstream of 4EBP1/eIF4E signaling in c-MYC HCCs.
(A) Schematic diagram illustrating the identification of target genes regulated by 4EBP1/eIF4E signaling in c-MYC HCCs. UP, upregulated; DOWN, downregulated. (B) qPCR results showing CENPM mRNA levels in the 3 HCC cell lines (Hep40, HLE, and HLF) treated with DMSO, everolimus, or MLN0128 (n = 6, 6, 6). Data are presented as the mean ± SD. At least P < 0.05, by Tukey-Kramer test. a, versus DMSO; b, versus everolimus. (C) Western blot analysis showing the levels of p-RPS6 and p-4EBP1 in HCC cells treated with DMSO, MLN0128, or everolimus. β-Actin was used as the loading control. (D) Expression of CENPM in the human HCC samples and normal liver based on the TCGA-LIHC dataset. Data are presented as the mean ± SD. P < 1 × 10–12, by 2-tailed Student’s t test. (E) Survival curve for the patients with HCC with high CENPM expression compared with those with low/medium CENPM expression (from https://ualcan.path.uab.edu/). Samples were categorized into 2 groups: high expression (with TPM values above the upper quartile) and low/medium expression (with TPM values below the upper quartile). A Kaplan-Meier comparison was performed; P = 0.00027. (F) Correlation between CENPM and EIF4EBP1 mRNA levels in human HCCs. (G) qPCR results showing CENPM mRNA levels in the MYC-ER–transfected HCC cell lines (Hep40 and HLE) after treatment with DMSO or 4OHT (n = 3, 3). Data are presented as the mean ± SD. **P < 0.01 and ***P < 0.001, by 2-tailed Student’s t test.
Figure 7
Figure 7. Targeting CENPM suppresses HCC cell proliferation and c-MYC–induced hepatocarcinogenesis.
(A and B) Representative images (A) and quantification (B) of EdU staining in HLF and SNU449 cells transfected with sgEGFP or sgCENPM (n = 3, 3). Scale bars: 50 μm. (C) Western blot analysis confirming the knockout of CENPM in the HCC cells. β-Actin was used as the loading control. (D and E) Representative images and quantification of the colony formation assay in sgEGFP- or sgCENPM-transfected HLF (D) and SNU449 (E) cells. (F) Representative images of immunofluorescence staining for α-tubulin (indicating microtubule, kinetochore, or spindle fibers), γ-tubulin (centrosome), and DAPI (indicating chromosomes) in CENPM-KO cells and control cells during mitosis. Lagging chromosomes (indicated by the white arrowhead) or mis-segregations were observed in almost all the CENPM-KO cells. Original magnification, ×1,000 and ×4,300 (enlarged insets). (G) Study design. FVB/N mice were hydrodynamically injected with plasmid mixtures of c-MYC/MCL1 and CRISPR plasmid with gRNA targeting the mouse Cenpm genome (c-MYC/MCL1/sgCenpm, n = 7). Control mice were hydrodynamically injected with c-MYC/MCL1 and sgEGFP (c-MYC/MCL1/sgEGFP, n = 6). Mice were monitored for tumor development and euthanized when moribund tumors developed or until the end of the observation period. (H) Survival curve for mice in both groups. A Kaplan-Meier comparison was performed; P = 0.0007. (I) Representative macroscopic images of livers from both groups. Data are presented as the mean ± SD. **P < 0.01 and ***P < 0.001, by 2-tailed Student’s t test (B, D, and E).

Similar articles

References

    1. Bray F, et al. Global cancer statistics 2018: GLOBOCAN estimates of incidence and mortality worldwide for 36 cancers in 185 countries. CA Cancer J Clin. 2018;68(6):394–424. doi: 10.3322/caac.21492. - DOI - PubMed
    1. European Association for the Study of the Liver. EASL Clinical Practice Guidelines: management of hepatocellular carcinoma. J Hepatol. 2018;69(1):182–236. doi: 10.1016/j.jhep.2018.03.019. - DOI - PubMed
    1. Llovet JM, et al. Sorafenib in advanced hepatocellular carcinoma. N Engl J Med. 2008;359(4):378–390. doi: 10.1056/NEJMoa0708857. - DOI - PubMed
    1. Cheng AL, et al. Efficacy and safety of sorafenib in patients in the Asia-Pacific region with advanced hepatocellular carcinoma: a phase III randomised, double-blind, placebo-controlled trial. Lancet Oncol. 2009;10(1):25–34. doi: 10.1016/S1470-2045(08)70285-7. - DOI - PubMed
    1. Llovet JM, et al. Immunotherapies for hepatocellular carcinoma. Nat Rev Clin Oncol. 2022;19(3):151–172. doi: 10.1038/s41571-021-00573-2. - DOI - PubMed

MeSH terms

Substances