. 2024 Nov 8;9(21):e182983.
doi: 10.1172/jci.insight.182983.

ERK hyperactivation in epidermal keratinocytes impairs intercellular adhesion and drives Grover disease pathology

Affiliations

ERK hyperactivation in epidermal keratinocytes impairs intercellular adhesion and drives Grover disease pathology

Cory L Simpson et al. JCI Insight. .

Abstract

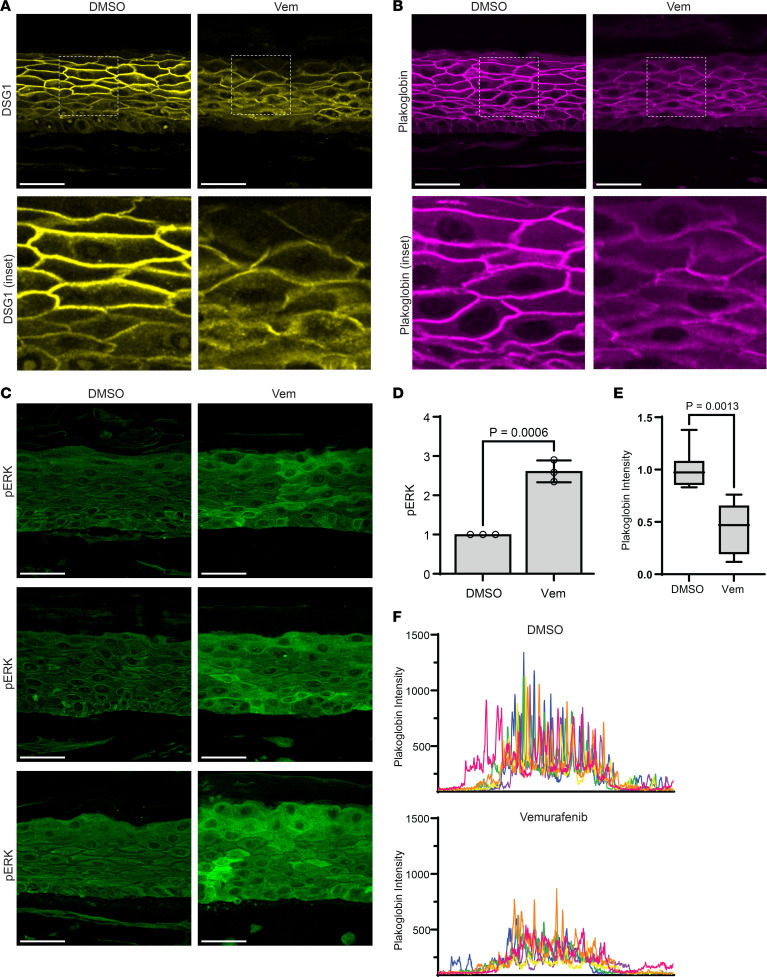
Grover disease is an acquired epidermal blistering disorder in which keratinocytes lose intercellular connections. While its pathologic features are well defined, its etiology remains unclear, and there is no FDA-approved therapy. Interestingly, Grover disease was a common adverse event in clinical trials for cancer using B-RAF inhibitors, but it remained unknown how B-RAF blockade compromised skin integrity. Here, we identified ERK hyperactivation as a key driver of Grover disease pathology. We leveraged a fluorescent biosensor to confirm that the B-RAF inhibitors dabrafenib and vemurafenib paradoxically activated ERK in human keratinocytes and organotypic epidermis, disrupting cell-cell junctions and weakening epithelial integrity. Consistent with clinical data showing that concomitant MEK blockade prevents Grover disease in patients receiving B-RAF inhibitors, we found that MEK inhibition suppressed ERK and rescued cohesion of B-RAF-inhibited keratinocytes. Validating these results, we demonstrated ERK hyperactivation in patient biopsies from vemurafenib-induced Grover disease and from spontaneous Grover disease, revealing a common etiology for both. Finally, in line with our recent identification of ERK hyperactivation in Darier disease, a genetic disorder with identical pathology to Grover disease, our studies uncovered that the pathogenic mechanisms of these diseases converge on ERK signaling and support MEK inhibition as a therapeutic strategy.

Keywords: Cell biology; Cell migration/adhesion; Dermatology; Signal transduction; Skin.


Figures

Figure 1
Figure 1. Sustained B-RAF blockade paradoxically activates ERK in human epidermal keratinocytes.
(A) Immunoblot of total and phosphorylated ERK (pERK) in lysates from NHEKs treated with dabrafenib (Dab, 1 μM) or vemurafenib (Vem, 10 μM) ± trametinib (Tram, 1 μM) for 24 hours; GAPDH is a loading control. (B) Bar graph displays the mean ± SD of the intensity of pERK (normalized to total ERK) with individual data points plotted for n = 4 (Dab) or n = 6 (Vem) independent experiments. (C) Representative confocal fluorescence microscopy images of NHEKs transduced with the ERK biosensor (ERK-KTR) linked to the green mClover fluorophore; cells were treated with the indicated compounds for 24 hours in medium containing 1.2 mM calcium; Scale bar: 10 μm. (D) Diagram of the ERK biosensor, which is primarily localized in the nucleus when ERK is inactive versus in the cytoplasm when ERK is active; an ERK activity index is calculated as the cytoplasmic-to-nuclear fluorescence intensity ratio. (E) Bar graph displays the mean ± SD of ERK activity data for each treatment group with individual data points plotted for n = 4 biological replicates; mean ERK activity of DMSO was normalized to 1; P values are from 1-way ANOVA using the Bonferroni adjustment for multiple comparisons.
Figure 2
Figure 2. B-RAF inhibition disrupts desmosomal protein localization in epidermal keratinocytes.
(A) Immunoblot of classical cadherins (Pan-Cad), desmosomal cadherins (DSG1, DSG2, DSG3), and plakoglobin (PG) in lysates from NHEKs treated with dabrafenib (Dab) or Vemurafenib (Vem) ± Trametinib (Tram) for 24 hours; β-actin is a loading control. (B) Confocal immunofluorescence images of DSG3 (magenta) and PG (green) in NHEKs treated with the indicated compounds for 24 hours; Scale bar: 50 μm. (C) Line scans were performed in a blinded manner across the entire field of 6 confocal microscopy images (individually colored pink, orange, yellow, green, blue, or purple) for each drug condition; graphs depict PG fluorescence intensity of each pixel across the entire field of view with the largest peaks occurring as the line scan crosses properly formed cell-cell junctions. (D) Bar graph displays the mean ± SD of the net intensity of PG with individual data points representing the average intensity across n = 6 independent line scans from 3 biological replicates; mean intensity for DMSO was normalized to 1; P values are from 1-way ANOVA using the Bonferroni adjustment for multiple comparisons.
Figure 3
Figure 3. MEK suppression reverses B-RAF inhibitor–induced weakening of intercellular adhesion.
(A) Mechanical dissociation assay of confluent monolayers from NHEKs cultured with the indicated compounds for 24 hours; representative images of fragmented monolayers transferred into 6-well cell culture plates are shown. (B) Bar graphs display the mean ± SD of the number of fragments from drug-treated monolayers with individual data points plotted for n = 6 (Dab) or n = 4 (Vem) biological replicates; P values from 1-way ANOVA with Dunnett adjustment for multiple comparisons to control cells. (C) Bar graph displays the mean ± SD of the number of fragments from drug-treated monolayers with individual data points plotted for n = 6 biological replicates; P values are from 1-way ANOVA with Dunnett adjustment for multiple comparisons to control cells. (D) Diagram depicts desmosome destabilization by MAP kinase pathway dysregulation; B-RAF inhibitors (e.g., dabrafenib, vemurafenib) paradoxically activate C-RAF along with MEK and ERK downstream, which inhibits desmosome stability to cause GD pathology, an effect overcome by MEK inhibitors (e.g., trametinib).
Figure 4
Figure 4. B-RAF inhibition is sufficient to disrupt cell-cell junctions and hyperactivate ERK in organotypic human epidermis.
(A) Immunostaining of DSG1 (yellow) and (B) PG (magenta) in tissue cross sections from organotypic epidermal cultures after 48 hours of treatment with DMSO or vemurafenib (Vem), which disrupted desmosomal protein localization to cell-cell borders; Scale bar (A and B): 50 μm; insets magnified below (original magnification, × 3). (C) Immunostaining of pERK (green) in tissue cross sections from epidermal cultures treated with DMSO versus vemurafenib; Scale bar: 50 μm. (D) Quantification of epidermal immunostaining of pERK in cross sections of DMSO- versus vemurafenib-treated cultures; bar graph displays the mean (individual values plotted) ± SD of pERK intensity from ≥ 60 images from n = 3 biological replicates for each drug. (E) Mean plakoglobin (PG) fluorescence intensity from n = 6 independent line scans across 3 biological replicates of DMSO-treated versus vemurafenib-treated cultures is plotted as a box plot of the 25th–75th percentile with a line at the median; mean intensity for DMSO was normalized to 1; P value from unpaired 2-tailed Student’s t test. (F) Line scans (individually colored pink, orange, yellow, green, blue, or purple) were performed through the epidermis in 6 confocal microscopy images for each drug condition; graphs depict PG fluorescence intensity of each pixel across the epidermis with the largest peaks occurring at properly formed cell-cell junctions.
Figure 5
Figure 5. Biopsies of B-RAF inhibitor–induced GD show epidermal hyperactivation of ERK and disruption of desmosomal proteins.
(A) H&E-stained cross sections of punch biopsies from the skin of an individual who was a control donor versus a patient diagnosed with vemurafenib-induced GD, which demonstrates aberrant cornification (dyskeratosis) and epidermal splitting between keratinocytes (magnified in inset [original magnification, × 2]); Scale bar: 100 μm. (B) Immunostaining of DSG1 (green) and plakoglobin (magenta) in tissue cross sections from patient biopsies; images shown are from 2 control donors and 2 patients with drug-induced GD and are representative of n = 5 patients in each group; Scale bar: 50 μm. (C) Line scans (individually colored pink, orange, yellow, green, or blue) were performed through the epidermis in n = 5 patient biopsies each for control or vemurafenib-induced GD; graphs depict plakoglobin fluorescence intensity of each pixel across the epidermis with the largest peaks occurring at properly formed cell-cell junctions. (D) Immunostaining of pERK (green) and Hoechst (blue) to stain nuclei (Nuc) in tissue cross-sections from patient biopsies; images shown are from 2 control donors and 2 patients with vemurafenib-induced GD and are representative of n = 5 patients in each group; dashed line marks bottom of the epidermis; Scale bar: 50 μm. (E) Quantification of epidermal immunostaining of pERK or mean plakoglobin line-scan intensities from cross sections of control biopsies versus in lesions of vemurafenib-induced GD; pERK and plakoglobin intensity data for each group are depicted as a box plot of the 25th–75th percentile with a line at the median from n = 5 control versus n = 5 disease biopsies; control mean normalized to 1; P value from unpaired 2-tailed Student’s t test.
Figure 6
Figure 6. Idiopathic GD biopsies exhibit ERK hyperactivation along with desmosomal disruption.
(A) H&E-stained cross sections of punch biopsies from the skin of an individual who was a control donor versus a patient with idiopathic GD, which demonstrates aberrant cornification (dyskeratosis) with retention of nuclei in the cornified layers and loss of keratinocyte cohesion (magnified in inset [original magnification, × 2]); Scale bar: 100 μm. (B) Immunostaining of DSG1 (green) and plakoglobin (magenta) in tissue cross-sections from patient biopsies; images shown are from 2 control donors and 2 patients with GD and are representative of n = 17 patients in each group; Scale bar: 50 μm. (C) Line scans (individually colored pink, orange, yellow, green, or blue) were performed through the epidermis in n = 5 patient biopsies each for control or GD; graphs depict plakoglobin fluorescence intensity of each pixel across the epidermis with the largest peaks occurring at properly formed cell-cell junctions. (D) Immunostaining of pERK (green) and Hoechst (blue) to stain nuclei (Nuc) in tissue cross sections from patient biopsies; images shown are from 2 control donors and 2 patients with GD and are representative of n = 17 patients in each group; dashed line marks bottom of the epidermis; Scale bar: 50 μm. (E) Quantification of epidermal immunostaining of pERK or mean plakoglobin line-scan intensities from cross sections of control biopsies versus in GD lesions; pERK and plakoglobin intensity data for each group are depicted as a box plot of the 25th–75th percentile with a line at the median; for pERK, n = 17 control versus n = 17 GD biopsies; for plakoglobin line-scan intensity, n = 5 control versus n = 5 GD biopsies; control mean normalized to 1; P value from unpaired 2-tailed Student’s t test.

Update of

References

    1. Wang Q, et al. Bullous Grover’s disease in a Chinese Tibetan adolescent: a case report. Clin Cosmet Investig Dermatol. 2022;15:1371–1376. doi: 10.2147/CCID.S373228. - DOI - PMC - PubMed
    1. Karray M, et al. Kaposi Varicelliform Eruption. In: Ackley WB, et al, eds. StatPearls. Treasure Island; 2022.
    1. Gantz M, et al. Atypical features and systemic associations in extensive cases of Grover disease: a systematic review. J Am Acad Dermatol. 2017;77(5):952–957. doi: 10.1016/j.jaad.2017.06.041. - DOI - PubMed
    1. Grover RW. Transient acantholytic dermatosis. Arch Dermatol. 1970;101(4):426–434. doi: 10.1001/archderm.1970.04000040048010. - DOI - PubMed
    1. Weaver J, Bergfeld WF. Grover disease (transient acantholytic dermatosis) Arch Pathol Lab Med. 2009;133(9):1490–1494. doi: 10.5858/133.9.1490. - DOI - PubMed

MeSH terms

Supplementary concepts