. 2024 Nov 8;9(21):e181329.
doi: 10.1172/jci.insight.181329.

The human milk oligosaccharide 3'sialyllactose reduces low-grade inflammation and atherosclerosis development in mice

Affiliations

The human milk oligosaccharide 3'sialyllactose reduces low-grade inflammation and atherosclerosis development in mice

Ariane R Pessentheiner et al. JCI Insight. .

Abstract

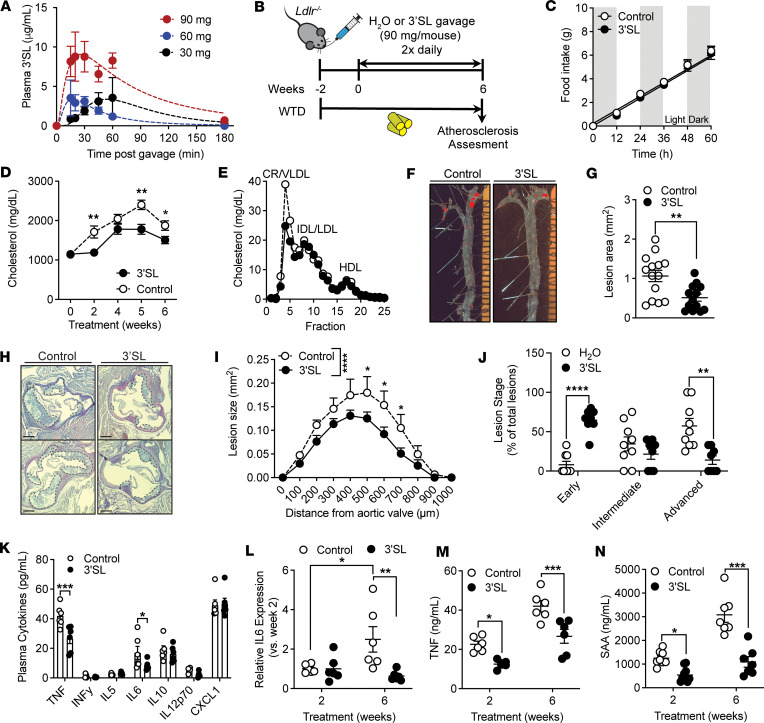
Macrophages contribute to the induction and resolution of inflammation and play a central role in chronic low-grade inflammation in cardiovascular diseases caused by atherosclerosis. Human milk oligosaccharides (HMOs) are complex unconjugated glycans unique to human milk that benefit infant health and act as innate immune modulators. Here, we identify the HMO 3'sialyllactose (3'SL) as a natural inhibitor of TLR4-induced low-grade inflammation in macrophages and endothelium. Transcriptome analysis in macrophages revealed that 3'SL attenuates mRNA levels of a selected set of inflammatory genes and promotes the activity of liver X receptor (LXR) and sterol regulatory element binding protein-1 (SREBP1). These acute antiinflammatory effects of 3'SL were associated with reduced histone H3K27 acetylation at a subset of LPS-inducible enhancers distinguished by preferential enrichment for CCCTC-binding factor (CTCF), IFN regulatory factor 2 (IRF2), B cell lymphoma 6 (BCL6), and other transcription factor recognition motifs. In a murine atherosclerosis model, both s.c. and oral administration of 3'SL significantly reduced atherosclerosis development and the associated inflammation. This study provides evidence that 3'SL attenuates inflammation by a transcriptional mechanism to reduce atherosclerosis development in the context of cardiovascular disease.

Keywords: Atherosclerosis; Cell biology; Epigenetics; Inflammation; Macrophages.


Figures

Figure 1
Figure 1. HMOs, particularly 3′SL, reduce inflammatory cytokine expression in LPS-activated murine macrophages and human monocytes.
(A and B) Relative mRNA levels of Il6 and Il1b (A), and Il10 and Tnf (B) in Raw264.7 cells with LPS ± pooled HMO (pHMO) incubation (n = 2). (C) IL-6 protein release 6 and 24 hours after LPS ± pHMO incubation (n = 3). (D) Depiction of individually used HMOs. (E and F) Relative mRNA levels of Il6 and Il1b in Raw 264.7 (E) and murine bone marrow–derived macrophages (BMDMs) (F) when treated with individual HMOs (n = 2). (G) Dose-response curve of 3′SL in BMDMs (n = 3). (H) Relative mRNA levels of Il6, Il1b, and Tnf expression in PBS, 3′SL, or LPS ± 3′SL (100 μg/mL) treatment (n = 3–4). (I) IL-1β protein release for 24 hours in BMDMs after LPS+ATP coincubation ± 3′SL (n ≥ 5). (J) Cytokine concentrations in the conditioned medium of BMDMs with 24 hours of LPS ± 3′SL incubation (n = 4). (K) Relative mRNA levels of IL6 and IL1b in LPS-activated human THP-1 cells treated ± 3′SL (n = 3). (L) IL-1β protein release 24 hours after LPS+ATP coincubation ± 3′SL (100 μg/mL) in human peripheral blood monocytes (hPBMCs) from 3 healthy donors. If not otherwise stated, incubations lasted for 6 hours with 10 ng/mL LPS and 100 μg/mL 3′SL or above indicated concentrations of HMOs. Two-way ANOVA with Fisher’s LSD test. *P < 0.05; **P < 0.01; ***P < 0.001; ****P < 0.0001. Data represented as mean ± SEM.
Figure 2
Figure 2. 3′SL does not engage with carbohydrate part of LPS, neither reduce NF-κB signaling, nor IFN-γ signaling and Siglec interactions.
(A) Scheme of potential 3′SL effector pathways. (B) Relative Il6 and Il1b mRNA levels in lipid A–activated BMDMs treated ± 3′SL. (C) Western blot of p-p65 and p-p38 after different times of LPS ± 3′SL stimulation. One representative blot of n = 3. (D) IL-6 concentrations in the conditioned medium of BMDMs with 6 hours Pam3CSK4 (at indicated doses) ± 3′SL incubation (n = 4). (E) Relative Il6 and Il1b mRNA levels in BMDMs stimulated with 10 ng/mL IFN-β INF-β ± 3′SL. (F and G) Relative Il6 and Il1b mRNA levels in Siglec1–/– (F) and SiglecE–/– (G) BMDMs stimulated with LPS ± 3′SL. All stimulations 10 ng/mL LPS, 100 μg/mL 3′SL. Two-way ANOVA with Fisher’s LSD test. *P < 0.05; ****P < 0.0001). Data represent mean ± SEM (n = 2–3 of individually isolated BMDMs).
Figure 3
Figure 3. 3′SL downregulates inflammatory pathways and upregulates cholesterol biosynthesis in LPS-stimulated BMDMs.
(A and B) Venn diagrams of differentially expressed mRNAs of genes detected by RNA-Seq (cut-off P < 0.05 and fold change [FC] > 1.5) of 3′SL downregulated (A) and upregulated (B) mRNA levels of genes in LPS-activated BMDMs compared with quiescent, PBS-treated BMDMs. Corresponding pathway analyses of LPS versus LPS + 3′SL–treated BMDMs are below the diagrams (n = 3). (C) Heatmaps representing Z-normalized row mRNA levels of each gene for RNA-Seq from independent biological duplicates showing the 50 most upregulated (right) or downregulated (left) genes in BMDMs at 6 hours after LPS ± 3′SL stimulation. (D and E) UCSC genome browser images illustrating normalized tag counts for Ptgs2 and Cxcl3 with normalized tag count averages (n = 3). (F and G) UCSC genome browser images illustrating relative mRNA levels for cholesterol biosynthesis genes Fdps and Sle with normalized tag count averages (n = 3). (H) Scheme of KEGG-pathway cholesterol biosynthesis. Red marked genes are upregulated by 3′SL coincubation with LPS. Red numbers above gene names indicate fold-change. (I) Enriched pathways identified by Ingenuity Pathway Analysis (IPA) software. All significantly, differentially expressed mRNAs of genes in the LPS versus LPS + 3′SL RNA-Seq datasets were used for the analysis with IPA (cut-off > 1.5-fold) with Z score ≥ ±2. (J) Scatter plot depicting the relationship between fold change of 3′SL and LPS–repressed and 3′SL-induced mRNAs of genes, overlaid with LXR- and SREBP-associated accessible loci from a previously generated ATAC-Seq dataset (33). Unpaired 2-tailed Student’s t test. *P < 0.05; **P < 0.01; ***P < 0.001. Data represent mean ± SEM.
Figure 4
Figure 4. The 3′SL inflammation response is associated with LXR and SREBP signal–dependent transcription factors.
(A) Scatter plot depicting the enhancers as defined by H3K27ac in their relationship to LPS stimulation with and without 3′SL coincubation. (B) Venn-diagram of global enhancers affected by 3′SL and LPS compared with LPS induced enhancers. (C) Venn-diagram of 3′SL-LPS–induced genes compared with LPS-induced enhancers associated with LXR/SREBP-bound loci. (D) De novo motif analysis of 3′SL-LPS–induced enhancers (versus LPS) using a GC-matched genomic background. (E) Heatmap of the fold change in 3′SL upregulated H3K27ac levels at ATAC-Seq–defined gene loci that demonstrated binding for LXR or SREBP. (F) Distribution of H3K27Ac tag densities, in the vicinity of genomic regions cobound by LXR, SREBP, or PU.1, in BMDMs treated with indicated stimuli for 6 hours. (G) Distribution of p300 tag densities, in the vicinity of genomic regions cobound by LXR, SREBP, or PU.1, in BMDMs treated with indicated stimuli for 6 hours. (H) UCSC genome browser images illustrating normalized tag counts for H3K27ac at Stard4 and Scd2 target loci together with mapped LXR and SREBP binding sites. (IL) Relative mRNA levels of target genes in BMDMs transfected with nontargeting control siRNA (siScr) or siScap or BMDMs isolated from Lxrα/β-KO mice (Lxr–/–) stimulated with PBS and LPS ± 3′SL. (n = 4 silencing experiments, Lxr–/– BMDMs from 3 individual mice). Two-way ANOVA with Fisher’s LSD test. *P < 0.05; **P < 0.01; ***P < 0.001. Data represent mean ± SEM.
Figure 5
Figure 5. 3′SL mediates reprogramming of the NF-κB enhancer landscape activity to attenuate inflammation.
(A) De novo motif analysis of 3′SL + LPS repressed enhancers (versus LPS) using a GC-matched genomic background. (B) Venn diagram of 3′SL-LPS repressed genes compared with LPS induced enhancers associated with NF-κB/p65 bound loci. (C) IPA analysis of upstream regulators of differentially expressed genes (|Z score| > ± 2). (D) Distribution of H3K27ac tag densities in the vicinity of genomic regions cobound by NF-κB/p65 in BMDMs treated with indicated stimuli for 6 hours. (E) Distribution of p300 tag densities in the vicinity of genomic regions cobound by NF-κB/p65 in BMDMs treated with indicated stimuli for 6 hours. (F and G) UCSC genome browser images illustrating normalized tag counts for H3K27ac at Il1a, Il6,and Cxcl10 target loci together with mapped ATAC-Seq tags. (H) De novo motif analysis of 3′SL + LPS repressed enhancers (versus LPS) using all LPS-induced ATAC-Seq peaks as a background. Unpaired 2-tailed Student’s t test. *P < 0.05; **P < 0.01. Data represent mean ± SEM.
Figure 6
Figure 6. Six-week s.c. treatment with 3′SL leads to reduced atherosclerotic development without negative side effects associated with body weight, plasma lipid parameters, and blood glucose.
(A) Pharmacokinetics of 3′SL after s.c. injections (n = 3 per group/time point). (B) Treatment regimen. Male Ldlr–/– were put on a Western-type diet (WTD) for 8 weeks. After 2 weeks, mice were treated twice daily with s.c. injections of 400 μg 3′SL in PBS per mouse for 6 weeks. PBS injections served as a control. (C) Biweekly plasma cholesterol levels in 3′SL-treated and control Ldlr–/– mice (n = 14–15). (D and E) Representative H&E staining (D) and quantification of atherosclerotic lesion size (E) in the aortic sinus. Scale bar: 100 μm (n = 7–8). (F) Atherosclerotic lesion staging analysis (n = 7–8). (G and H) Atherosclerotic lesions stained with CD68 for macrophages (G) and quantification (H) of the positive stained area (n = 4–6). (I and J) Smooth muscle actin (SMA) staining (I) and quantification (J) of the positive stained area (n = 5–6). (K and L) Picrosirius red staining for collagen (K) and quantification (L) of the positive stained area (n = 5). (M) Cytokine concentrations in the plasma after 6 weeks of treatment (n = 6). (N) Relative expression of inflammatory marker mRNA levels in human umbilical vein endothelial cells (HUVECs) treated with PBS or LPS (10 ng/mL) ± 3′SL (100 μg/mL) (n = 3). (O) Cytokine secretion of CCL2 and IL-8 after 24-hour stimulation with LPS in the presence or absence of 3′SL at the indicated concentrations (n = 3). Two-way ANOVA with Fisher’s LSD test and, in H, J, and L, we used an unpaired 2-tailed Student’s t test. *P < 0.05; **P < 0.01; ***P < 0.001. Data represent mean ± SEM.
Figure 7
Figure 7. Six-week oral 3′SL treatment reduced atherosclerotic development and associated inflammation.
(A) Pharmacokinetics of 3′SL after oral injections (n = 3 per group/time point). (B) Treatment regimen. Male Ldlr–/– were put on a Western-type diet (WTD) for 8 weeks. After 2 weeks, mice were treated twice daily with oral gavage of 90 mg 3′SL in water per mouse for 6 weeks. Water gavage served as a control. (C) Food intake of Ldlr–/– mice on a WTD measured 3 weeks into the treatment. (D) Biweekly plasma cholesterol levels in 3′SL-treated and control Ldlr–/– mice (n = 14–15). (E) FPLC cholesterol lipoprotein profiles after 6 weeks of treatment (2 pooled samples per group of 7–8). (F and G) Representative Oil Red O staining (F) and en face quantification of atherosclerotic lesion size (G) in the aorta (n = 14–15). (H and I) Representative H&E staining (H) and quantification of atherosclerotic lesion size (I) in the aortic sinus. Scale bar: 100 μm (n = 14–15). (J) Atherosclerotic lesion staging analysis (n = 8–9). (K) Cytokine concentrations in the plasma after 6 weeks treatment (n = 6). (L) Relative plasma IL-6 levels after 2 and 6 weeks of treatment (n = 6). (M) Plasma TNF levels after 2 and 6 weeks of treatment (n = 7–8). (N) Plasma SAA levels after 2 and 6 weeks of treatment (n = 6). Two-way ANOVA with Fisher’s LSD test and, in G, unpaired 2-tailed Student’s t test. *P < 0.05; **P < 0.01; ***P < 0.001; ****P < 0.0001. Data represent mean ± SEM.
Figure 8
Figure 8. 3′SL downregulates inflammatory pathways and upregulates cholesterol biosynthesis in atherosclerotic lesion macrophages.
(A and B) Heatmaps representing Z-normalized row mRNA levels of each gene for RNA-Seq from independent biological duplicates showing the 50 most upregulated (right) or downregulated (left) genes in BMDMs at 6 hours after Pam3CSK4 ± 3′SL stimulation. (C and D) Enriched pathways identified by metascape analysis software. All significantly, differentially expressed mRNA levels of genes in the Pam3CSK4 versus Pam3CSK4 + 3′SL RNA-Seq datasets were used for the analysis with IPA (cut-off > 1.5-fold) with Z score ≥ ±2. (E) Annotated UMAP visualizations of the identified clusters of snRNA-Seq data from cells of the atherosclerotic aortic arch of water treated or 3′SL-treated male mice. Ldlr–/– male mice were fed a Western-type diet (WTD) for 10 weeks. After 2 weeks, mice were treated twice daily with oral gavage of 90 mg 3′SL in water per mouse for 6 weeks. Water gavage served as a control. (F) Relative distribution of atherosclerotic lesion macrophage subsets in water versus 3′SL-treated mice. (G) The number of significantly differentially expressed mRNA gene transcripts in macrophage subsets and their directionality upon 3′SL administration (upregulation is > 2-fold; downregulation is <-2-fold; compared with control treatment). (H) Enriched pathways identified by metascape analysis software of differentially expressed mRNA in macrophage subsets upon 3′SL administration (> 1.75-fold or < –1.75 change; compared with control treatment). (I and J) The expression of numerous genes from snRNA-Seq was significantly increased (I) or decreased (J) by 3′SL treatment in plaque macrophage subsets compared with WT. Unpaired 2-tailed Student’s t test. *P < 0.05 versus control. Data represent mean ± SEM.

References

    1. Hansson GK, et al. Inflammation and plaque vulnerability. J Intern Med. 2015;278(5):483–493. doi: 10.1111/joim.12406. - DOI - PMC - PubMed
    1. Moore KJ. Targeting inflammation in CVD: advances and challenges. Nat Rev Cardiol. 2019;16(2):74–75. doi: 10.1038/s41569-018-0144-3. - DOI - PMC - PubMed
    1. Kleemann R, et al. Cytokines and atherosclerosis: a comprehensive review of studies in mice. Cardiovasc Res. 2008;79(3):360–376. doi: 10.1093/cvr/cvn120. - DOI - PMC - PubMed
    1. Bode L. Human milk oligosaccharides: every baby needs a sugar mama. Glycobiology. 2012;22(9):1147–1162. doi: 10.1093/glycob/cws074. - DOI - PMC - PubMed
    1. Brugman S, et al. Mucosal immune development in early life: setting the stage. Arch Immunol Ther Exp (Warsz) 2015;63(4):251–268. doi: 10.1007/s00005-015-0329-y. - DOI - PMC - PubMed

MeSH terms