. 2024 Sep 26;19(9):e0310947.
doi: 10.1371/journal.pone.0310947. eCollection 2024.

PPARγ agonist alleviates calcium oxalate nephrolithiasis by regulating mitochondrial dynamics in renal tubular epithelial cell

Affiliations

PPARγ agonist alleviates calcium oxalate nephrolithiasis by regulating mitochondrial dynamics in renal tubular epithelial cell

Junfa Liu et al. PLoS One. .

Abstract

Background: Kidney stone formation is a common disease that causes a significant threat to human health. The crystallization mechanism of calcium oxalate, the most common type of kidney stone, has been extensively researched, yet the damaging effects and mechanisms of calcium oxalate crystals on renal tubular epithelial cells remain incompletely elucidated. Regulated mitochondrial dynamics is essential for eukaryotic cells, but its role in the occurrence and progression of calcium oxalate (CaOx) nephrolithiasis is not yet understood.

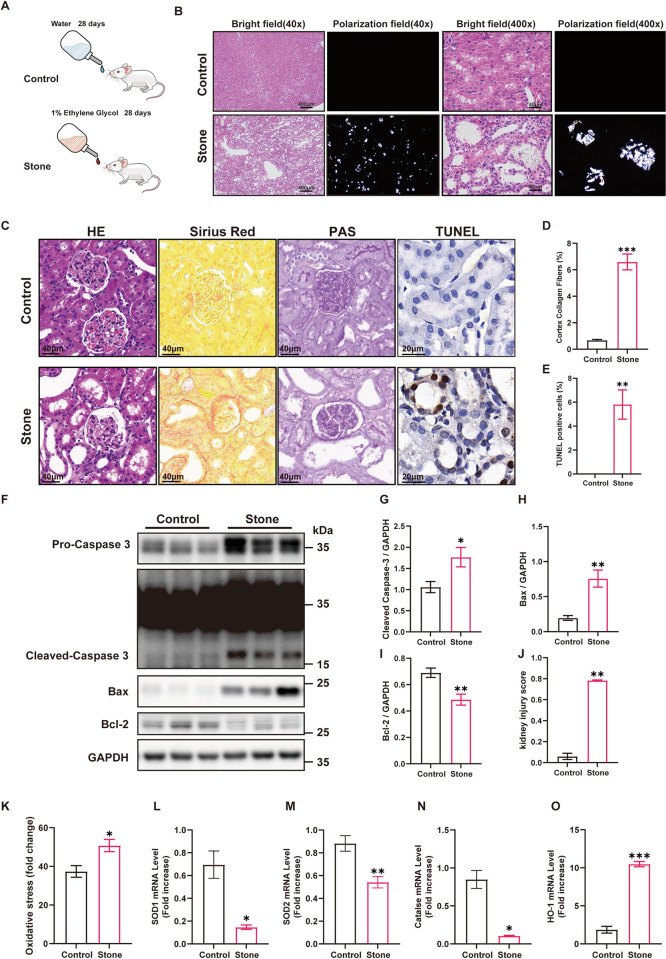
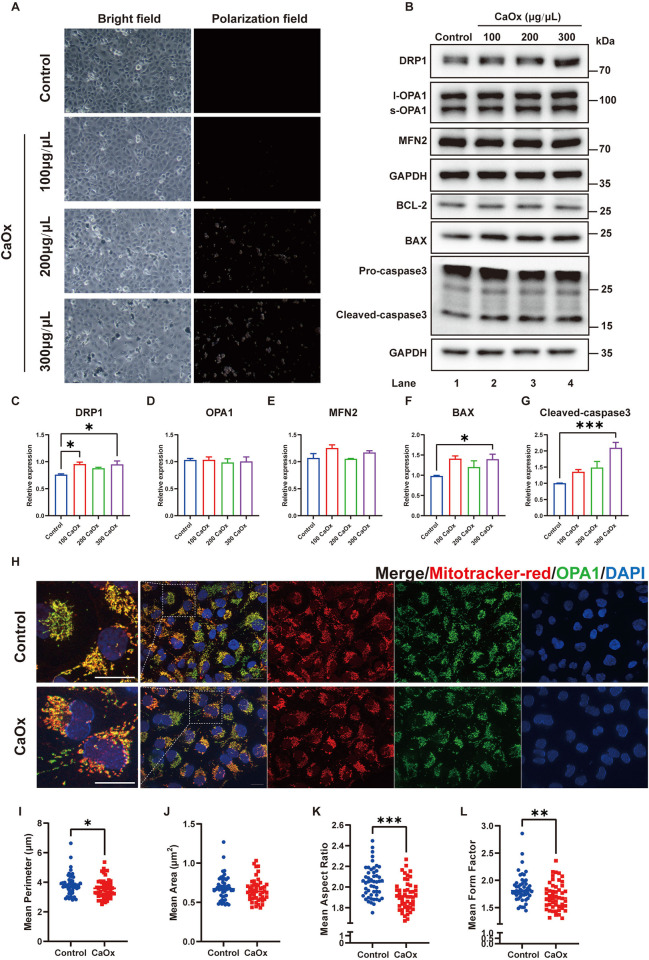
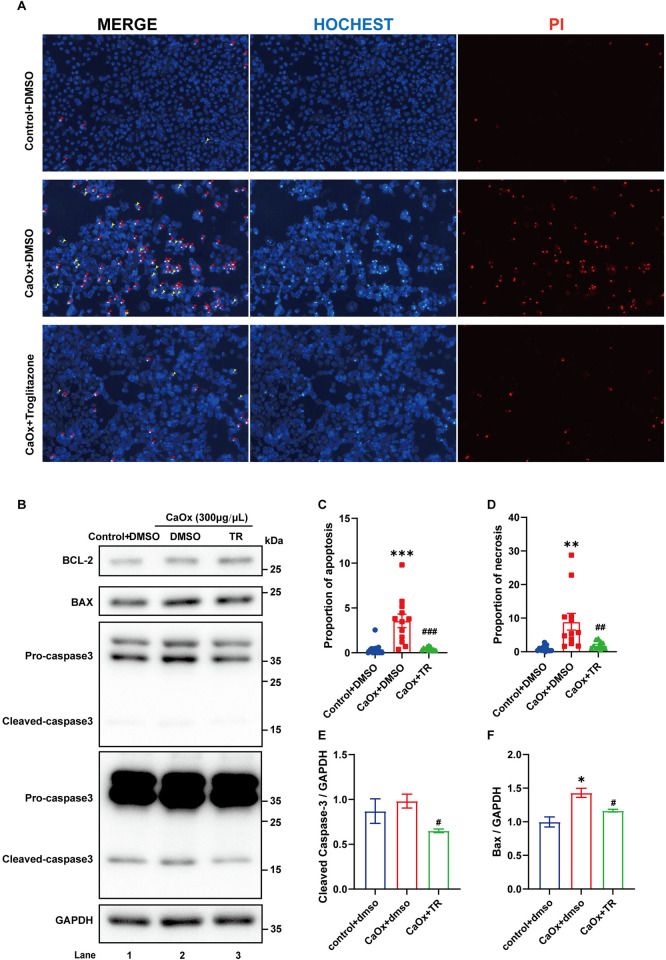
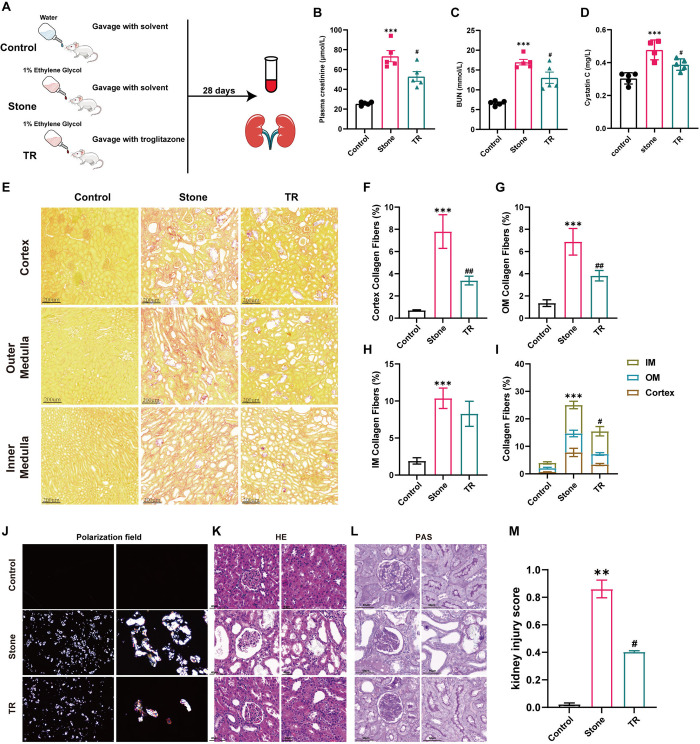
Methods: An animal model of calcium oxalate-related nephrolithiasis was established in adult male Sprague‒Dawley (SD) rats by continuously administering drinking water containing 1% ethylene glycol for 28 days. The impact of calcium oxalate crystals on mitochondrial dynamics and apoptosis in renal tubular epithelial cells was investigated using HK2 cells in vitro. Blood samples and bilateral kidney tissues were collected for histopathological evaluation and processed for tissue injury, inflammation, fibrosis, oxidative stress detection, and mitochondrial dynamics parameter analysis.

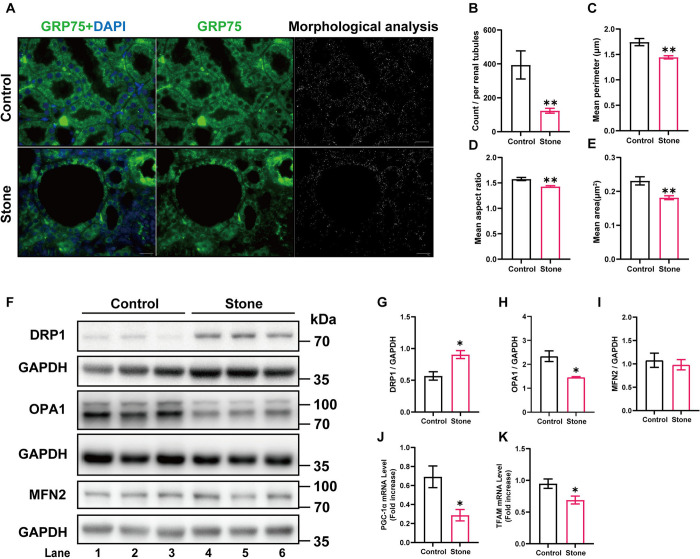
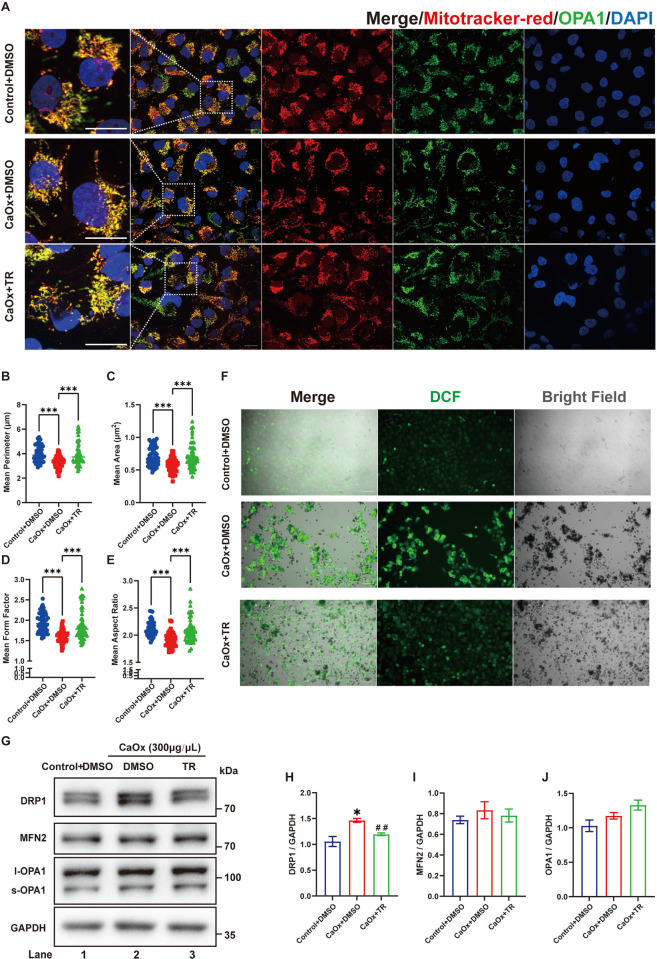
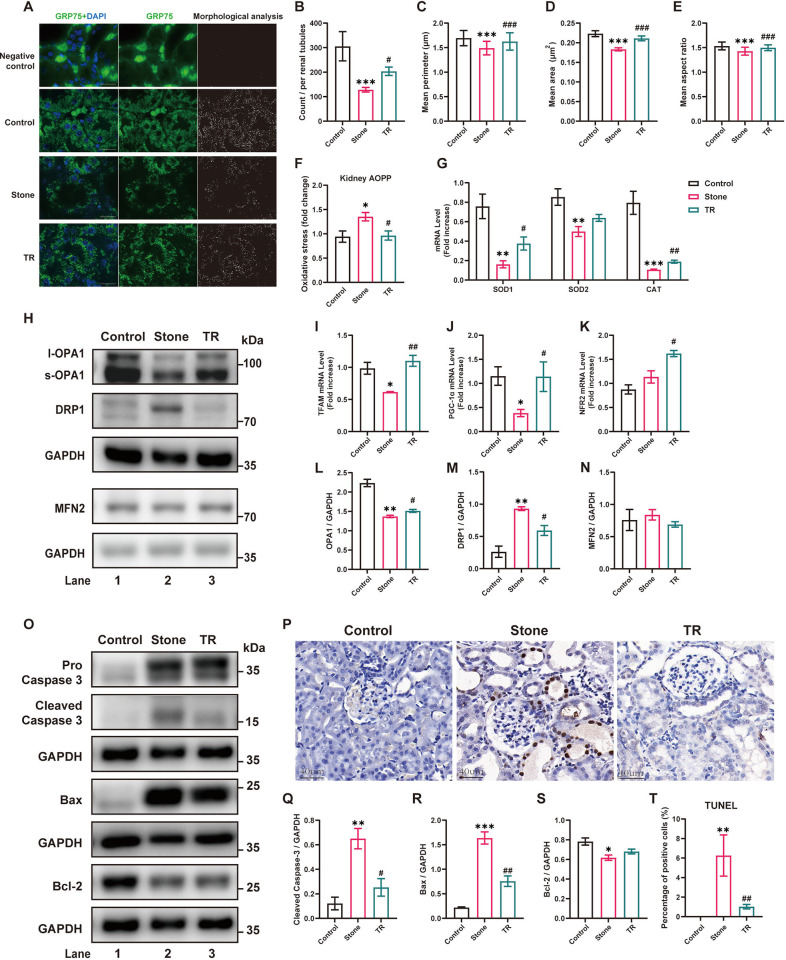
Results: Calcium oxalate crystals caused higher levels of mitochondrial fission and apoptosis in renal tubular epithelial cells both in vivo and in vitro. Administration of a PPARγ agonist significantly alleviated mitochondrial fission and apoptosis in renal tubular epithelial cells, and improved renal function, accompanied by reduced levels of oxidative stress, increased antioxidant enzyme expression, alleviation of inflammation, and reduced fibrosis in vivo.

Conclusion: Our results indicated that increased mitochondrial fission in renal tubular epithelial cells is a critical component of kidney injury caused by calcium oxalate stones, leading to the accumulation of reactive oxygen species within the tissue and the subsequent initiation of apoptosis. Regulating mitochondrial dynamics represents a promising approach for calcium oxalate nephrolithiasis.


Conflict of interest statement

The authors have declared that no competing interests exist.

Figures

Fig 1
Fig 1. The calcium oxalate nephrolithiasis induced by EG exhibits significant crystal deposition, fibrosis, apoptosis, and increased oxidative stress levels in rats.
(A) Experimental flowchart for the EG-induced calcium oxalate nephrolithiasis model; (B) Polarized light optical microscopy showed large crystals in the kidneys of rats in the stone group; (C) Paraffin-embedded sections of renal tissue were stained with H&E, Sirius Red staining, PAS staining, and TUNEL staining; (D) The degree of interstitial fibrosis in the renal cortex, n = 30 fields per group; (E) The average number of TUNEL-positive cells per high-power field, n = 15 fields per group; (F) Lysates from renal tissue were analyzed by western blotting with the indicated antibodies; (G-I) The relative protein quantification of F, n = 5 rats per group; (J) Kidney injury was scored in different groups, n = 15 fields per group; (K) Oxidative stress levels in renal tissue were measured by the AOPP test; (L-O) Gene expression levels of different renal tissues were determined by RT‒qPCR. Data are represented as the mean±SEM; * represents P<0.05, ** represents P<0.01, *** represents P<0.001.
Fig 2
Fig 2. The rat calcium oxalate nephrolithiasis model exhibits significant mitochondrial dynamics disorder and damage to biosynthesis.
(A) Immunofluorescence staining of the mitochondrial protein GRP75 and schematic representation of mitochondrial morphology in the renal cortex regions of different groups. Scale bar = 20 μm; (B-E) The mean count of mitochondria per renal tubule, mean area (um2), mean perimeter (um), and mean aspect ratio of mitochondria in the different groups were quantified, n = 15 renal tubules per group; (F) Lysates from renal tissue were analyzed by western blotting with the indicated antibodies; (G-I) The relative protein quantification of F, n = 5 rats per group; (J-K) Gene expression levels of different renal tissues were determined by RT‒qPCR, n = 5 rats per group. Data are represented as the mean ± SEM; * represents P<0.05, ** represents P<0.01, *** represents P<0.001.
Fig 3
Fig 3. Treatment with COM induced mitochondrial fission in HK2 cells.
(A) Bright-field and polarized light images of HK2 cells treated with different concentrations of COM (10×). (B) western blotting of HK2 cells with the indicated antibodies following treatment with different concentrations of COM for 48 h. (C-G) The relative protein quantification of F, n = 3 per group. (H) HK2 cells were treated with 300 μg/ml COM as indicated and stained with MitoTracker Red and GRP75 to visualize mitochondrial morphology. The left panel is an enlarged view of the boxed region in the right panel. Scale bar = 20 μm; (I-L) The means of perimeter (μm), area (μm2), aspect ratio, and form factor of mitochondria in different groups were quantified, n = 50 cells per group. Data are represented as the mean ± SEM; * represents P<0.05, ** represents P<0.01, *** represents P<0.001.
Fig 4
Fig 4. Treatment with a PPARγ agonist improved COM-induced mitochondrial fragmentation and ROS levels in HK2 cells.
(A) HK2 cells were treated with COM or COM and troglitazone as indicated and stained with MitoTracker Red and GRP75 to visualize mitochondrial morphology. The left panel is an enlarged view of the boxed region in the right panel. Scale bar = 20 μm; (B-E) The means of perimeter (μm), area (μm2), form factor, and aspect ratio of mitochondria in different groups were quantified, n = 50 cells per group; (F) The total ROS levels were analyzed by H2DCF fluorescence. Scale bar = 20 μm. (G) Lysates from HK2 cells were analyzed by western blotting with the indicated antibodies. (H-J) The relative protein quantification of G, n = 3 per group. Data are represented as the mean ± SEM; * P<0.05, ** P<0.01, *** P<0.001 vs. the control + DMSO group; # P< 0.05, ## P< 0.01, ### P< 0.001 vs. the CaOx + DMSO group.
Fig 5
Fig 5. Treatment with a PPARγ agonist improved COM-induced apoptosis in HK2 cells.
(A) The apoptosis and necrosis rates were evaluated by Hoechst and PI staining (10×). The yellow arrows indicate apoptotic cells, and red arrows indicate necrotic cells. (B) Lysates from HK2 cells were analyzed by western blotting with the indicated antibodies. (C-D) The proportion of apoptotic to necrotic cells in A, n = 12 fields per group. (E-F) The relative protein quantification of B, n = 3 per group. Data are represented as the mean ± SEM; * P<0.05, ** P<0.01, *** P<0.001 vs. the control + DMSO group; # P< 0.05, ## P< 0.01, ### P< 0.001 vs. the CaOx + DMSO group.
Fig 6
Fig 6. Treatment with a PPARγ agonist improved kidney function and pathological damage induced by calcium oxalate crystals.
(A) Experimental flowchart for establishment of EG-induced calcium oxalate nephrolithiasis and treatment with troglitazone; (B) Plasma creatinine, (C) BUN, and (D) Cystatin C were measured to assess kidney function in the different groups, n = 5 rats per group; (E) The degree of interstitial fibrosis in the renal cortex and outer and inner medulla areas in Sirius Red staining. Scale bar = 200 μm; (F-I) The quantification of E, n = 50 fields per group; (J) CaOx crystal deposits in the kidney tissues of rats by polarized light optical microphotography (left panel, magnification 10×; right panel, magnification 40×); (K-L) Paraffin-embedded sections of renal tissue were stained with H&E (Scale bar = 40 μm) and PAS staining (Scale bar = 60 μm), respectively; (M) Kidney injury was scored in the different groups, n = 15 fields per group. Data are represented as the mean ± SEM; * P<0.05, ** P<0.01, *** P<0.001 vs. control group; # P< 0.05, ## P< 0.01, ### P< 0.001 vs. stone group.
Fig 7
Fig 7. Treatment with a PPARγ agonist improved impaired mitochondrial quality control, oxidative stress, and apoptosis induced by calcium oxalate crystals in the kidney.
(A) Immunofluorescence staining of the mitochondrial protein GRP75 and schematic representation of mitochondrial morphology in the renal cortex regions of the different groups. Scale bar = 20 μm; (B-E) The mean count of mitochondria per renal tubule, mean area (μm2), mean perimeter (μm), and mean aspect ratio of mitochondria in different groups were quantified, n = 15 renal tubules per group; (F) Oxidative stress levels in renal tissue were measured by the AOPP test; (G) Gene expression levels of different renal tissues were determined by RT‒qPCR, n = 5 rats per group; (H) Lysates from renal tissue were analyzed by western blotting with indicated antibodies; (I-K) Gene expression levels of different renal tissues were determined by RT‒qPCR, n = 5 rats per group; (L-N) The relative protein quantification of H, n = 3 rats per group; (O) western blotting of renal tissue with indicated antibodies; (P) TUNEL staining for apoptotic cells in rat renal tissue. Scale bar = 40 μm; (Q-S) The relative protein quantification of O, n = 3 rats per group; (T) The proportion of TUNEL-positive cells in P, n = 15 fields per group. Data are represented as the mean ± SEM; * P<0.05, ** P<0.01, *** P<0.001 vs. the control group; # P< 0.05, ## P< 0.01, ### P< 0.001 vs. the stone group.

Similar articles

Cited by

References

    1. Zeng G, Mai Z, Xia S, Wang Z, Zhang K, Wang L, et al.. Prevalence of kidney stones in China: an ultrasonography based cross-sectional study. BJU Int, 2017, 120(1): 109–16, doi: 10.1111/bju.13828 - DOI - PubMed
    1. Kumar P, Yang Z, Lever J M, Chavez M D, Fatima H, Crossman D K, et al.. Hydroxyproline stimulates inflammation and reprograms macrophage signaling in a rat kidney stone model. Biochim Biophys Acta Mol Basis Dis, 2022, 1868(9): 166442, doi: 10.1016/j.bbadis.2022.166442 - DOI - PMC - PubMed
    1. Pearle M S, Calhoun E A, Curhan G C, Urologic Diseases Of America P. Urologic diseases in America project: urolithiasis. J Urol, 2005, 173(3): 848–57, doi: 10.1097/01.ju.0000152082.14384.d7 - DOI - PubMed
    1. El-Zoghby Z M, Lieske J C, Foley R N, Bergstralh E J, Li X, Melton L J, 3RD, et al.. Urolithiasis and the risk of ESRD. Clin J Am Soc Nephrol, 2012, 7(9): 1409–15, doi: 10.2215/CJN.03210312 - DOI - PMC - PubMed
    1. Alexander R T, Hemmelgarn B R, Wiebe N, Bello A, Samuel S, Klarenbach S W, et al.. Kidney stones and cardiovascular events: a cohort study. Clin J Am Soc Nephrol, 2014, 9(3): 506–12, doi: 10.2215/CJN.04960513 - DOI - PMC - PubMed

MeSH terms

Supplementary concepts