. 2024 Sep 26;19(9):e0310171.
doi: 10.1371/journal.pone.0310171. eCollection 2024.

A novel viral RNA detection method based on the combined use of trans-acting ribozymes and HCR-FRET analyses

Affiliations

A novel viral RNA detection method based on the combined use of trans-acting ribozymes and HCR-FRET analyses

Leonardo Ferreira da Silva et al. PLoS One. .

Abstract

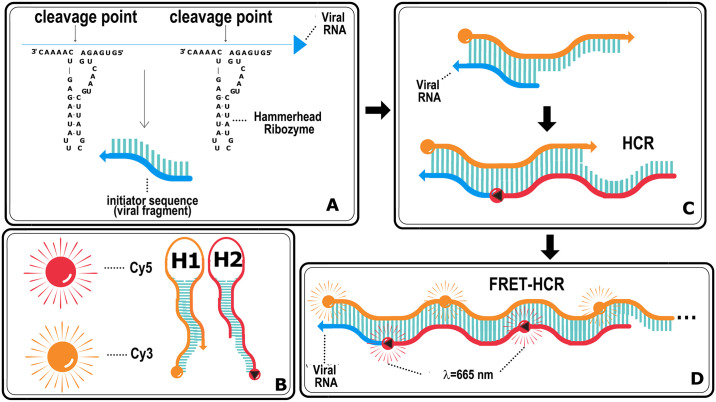
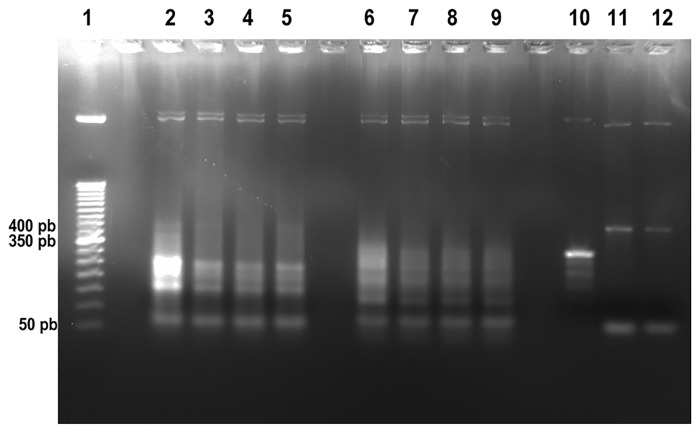
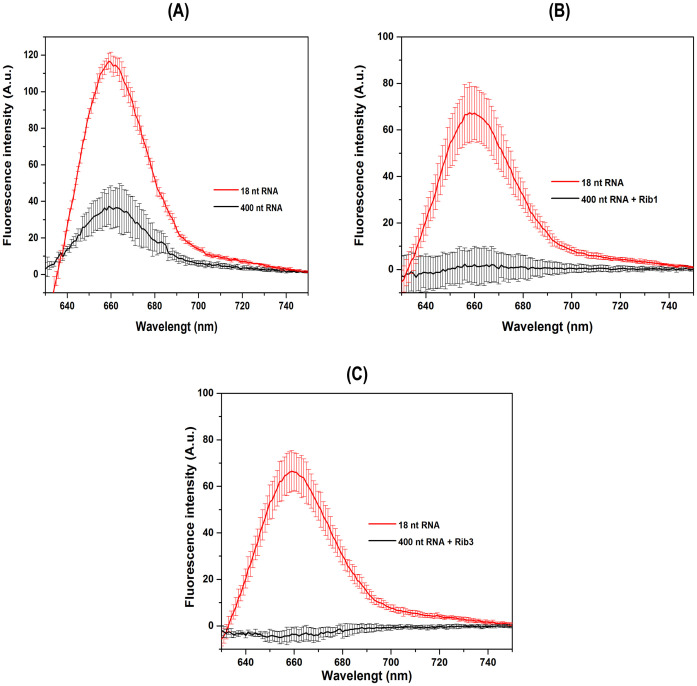
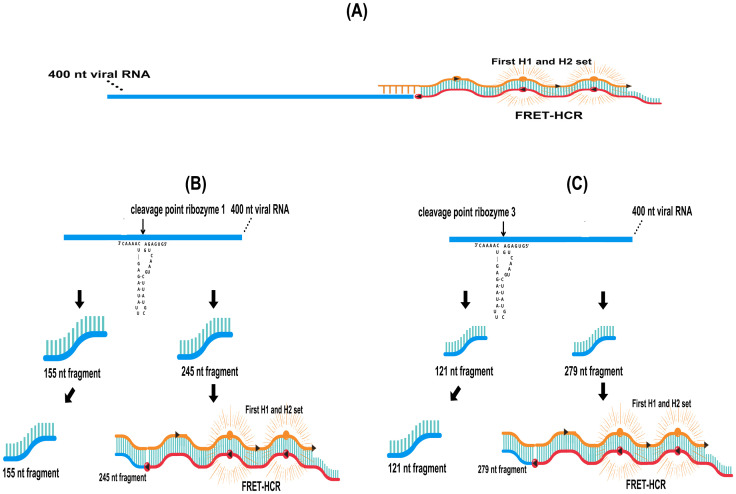
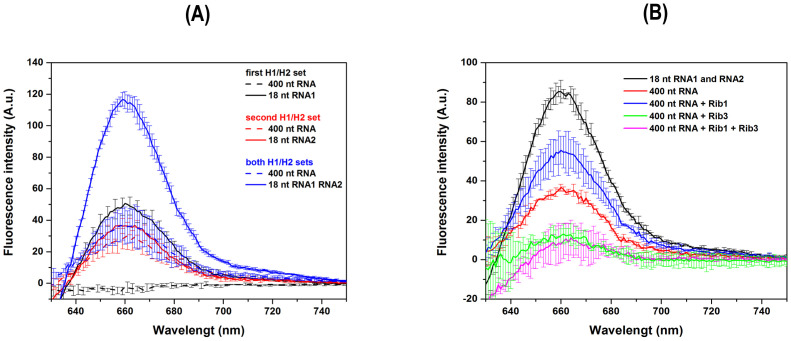
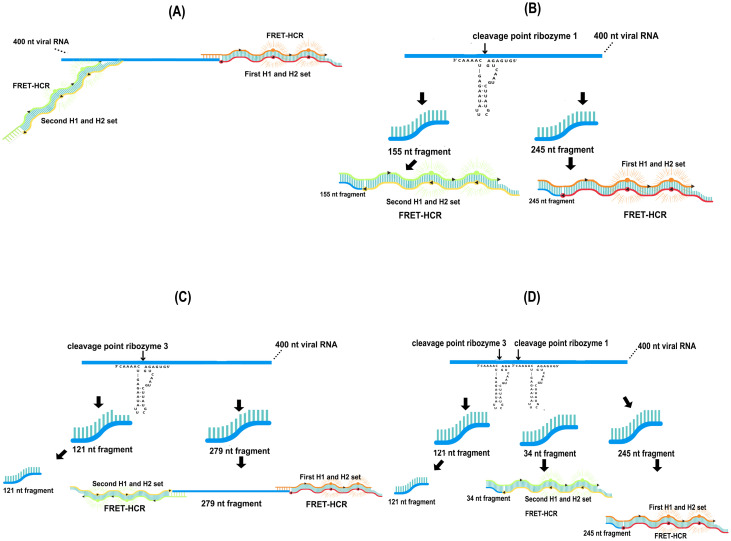
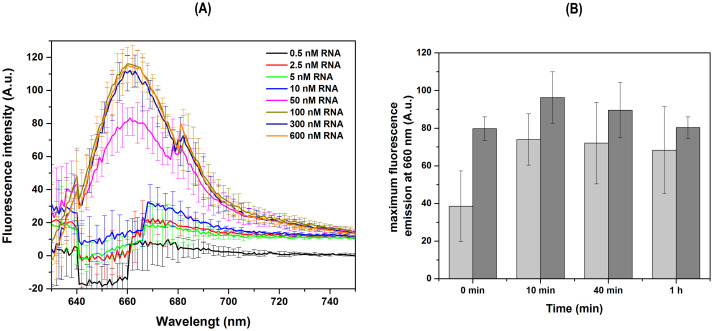
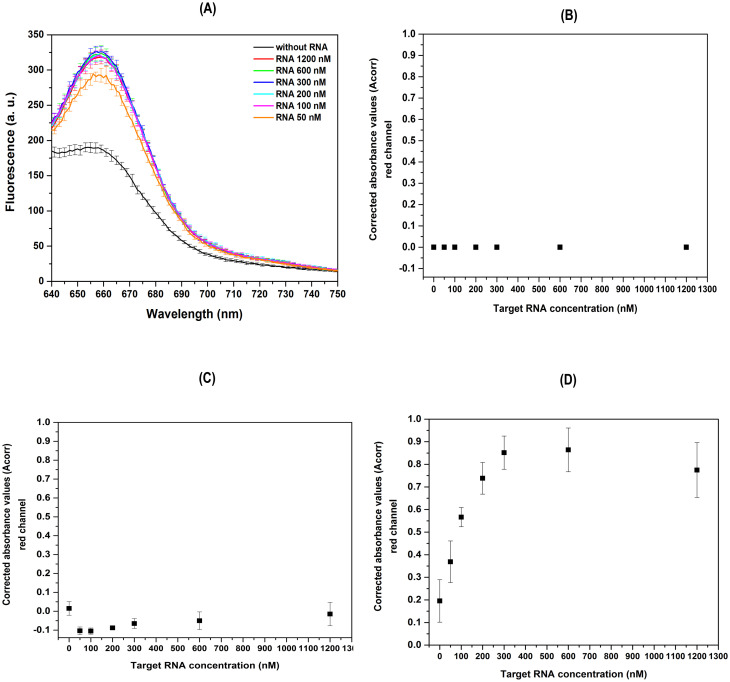
The diagnoses of retroviruses are essential for controlling the rapid spread of pandemics. However, the real-time Reverse Transcriptase quantitative Polymerase Chain Reaction (RT-qPCR), which has been the gold standard for identifying viruses such as SARS-CoV-2 in the early stages of infection, is associated with high costs and logistical challenges. To innovate in viral RNA detection a novel molecular approach for detecting SARS-CoV-2 viral RNA, as a proof of concept, was developed. This method combines specific viral gene analysis, trans-acting ribozymes, and Fluorescence Resonance Energy Transfer (FRET)-based hybridization of fluorescent DNA hairpins. In this molecular mechanism, SARS-CoV-2 RNA is specifically recognized and cleaved by ribozymes, releasing an initiator fragment that triggers a hybridization chain reaction (HCR) with DNA hairpins containing fluorophores, leading to a FRET process. A consensus SARS-CoV-2 RNA target sequence was identified, and specific ribozymes were designed and transcribed in vitro to cleave the viral RNA into fragments. DNA hairpins labeled with Cy3/Cy5 fluorophores were then designed and synthesized for HCR-FRET assays targeting the RNA fragment sequences resulting from ribozyme cleavage. The results demonstrated that two of the three designed ribozymes effectively cleaved the target RNA within 10 minutes. Additionally, DNA hairpins labeled with Cy3/Cy5 pairs efficiently detected target RNA specifically and triggered detectable HCR-FRET reactions. This method is versatile and can be adapted for use with other viruses. Furthermore, the design and construction of a DIY photo-fluorometer prototype enabled us to explore the development of a simple and cost-effective point-of-care detection method based on digital image analysis.


Conflict of interest statement

The authors have declared that no competing interests exist.

Figures

Fig 1
Fig 1. Schematic representation of the main reaction steps of the diagnostic method.
Detection and cleavage of the target viral RNA by hammerhead ribozymes, resulting in the release of an initiator fragment (A). Schematic representation of two reporter DNA molecules containing different fluorophores: H1-Cy3 (Cyanine 3) and H2-Cy5 (Cyanine 5) (B). Binding of the initiator molecule to the H1 reporter DNA molecule, causing its opening and subsequent binding and opening of the H2 reporter DNA molecule through a hybridization chain reaction (HCR) (C). Formation of a polymer of concatenated H1 and H2 molecules, resulting in HCR-FRET that amplifies the detection signal (D).
Fig 2
Fig 2. Fluorescence spectra emission analysis of FRET between H1 and H2 on different DNA target concentrations.
Average fluorescence spectra emissions (n = 3 or five independent experiments) were measured using a K2 fluorometer. Spectra were obtained by subtracting the negative control spectrum (without initiator DNA molecules), resulting in a negative fluorescence signal at 625 nm. Experiments were conducted in 5X SSCT buffer with varying concentrations of 18 bp initiator DNA molecules. Three concentrations of initiator DNA were evaluated: 100 nM (black line), 200 nM (red line), and 600 nM (blue line) (A). Additionally, the effect of 5X SSCT (blue line) versus 5X SSC (magenta line) buffers was compared at an initiator DNA concentration of 600 nM (B). Standard deviations are represented by error bars. In all experiments, 600 nM of H1 and H2 hairpin fluorophore reporter DNA molecules from the first set, were used.
Fig 3
Fig 3. Fluorescence spectra emission analysis of FRET between H1 and H2 on DNA target: Comparison between Varioskan LUX and SpectraMax M3 microplate readers.
Fluorescence emission spectra (n = three independent experiments) were recorded using the Varioskan LUX microplate reader (A) and the SpectraMax M3 multimode microplate reader (B) to assess HCR-FRET between H1 (600 nM) and H2 (600 nM) from first set. The experiments were carried out in 5X SSC buffer with different concentrations of 18 nt initiator DNA molecules (indicated by red lines) and negative controls without DNA target (black lines). Two concentrations of initiator DNA molecules were evaluated: 600 nM (solid lines) and 6000 nM (dashed lines). Standard deviations are represented with error bars. Bar graph plots displaying the maximal fluorescence intensity signals relative to the negative control signals are shown (C) with corresponding standard deviations. No significant differences were observed between concentrations using the same equipment. Additionally, the Varioskan exhibited a slightly increased sensitivity. Measurements were carried out considering the optimization of sample preparation, instrument calibration, standardization of plate reader parameters, and minimization of background fluorescence.
Fig 4
Fig 4. Specific recognition of the DNA hairpins with related SARS-CoV-2 viral target DNA and RNA sequences.
Average fluorescence intensity emission due to HCR-FRET between H1 and H2 with 18 nt initiator DNA (red line) and 18 nt RNA (blue line) in 5X SSC buffer with 600 nM of H1 and H2 from first set (A). Negative control without an initiator molecule is indicated as the black line. Bar graph plots show the maximal fluorescence intensity signals of the negative control signals with the 18 nt initiator DNA and RNA molecules with corresponding standard deviations (B). Specific recognition assay of the DNA hairpins by SARS-CoV-2 viral RNA sequences were conducted using different concentrations (0.5–600 nM) of CS-1 22 bp (C) and CS-2 30 bp (D) DNA sequences unrelated to the viral genome. The CS-1 and CS-2 sequences of DNA fragments are shown in material and methods. Assays were performed with 5x SSC buffer and 600 nM of H1 and H2 DNA hairpins. A positive control of first 18 nt SARS-CoV-2 viral RNA target was used (600 nM RNA* 18pb). Assays were performed in technical duplicates and at least in two independent assays.
Fig 5
Fig 5. Agarose gel electrophoresis of ribozyme catalytic assay products.
Ribozyme catalytic assay showing the RNA fragments obtained after ribozyme 1 (lanes 2–5) and ribozyme 3 (lanes 6–9) cleavage of the 400 nt target RNA molecule analyzed in 2% agarose gel electrophoresis. The target RNA is approximately 400 nt (lane 10), and the ribozyme 1 (lane 11) and ribozyme 3 (lane 12) of approximately 60 nt. RNA cleaved products for ribozyme 1 was 155 nt and 245 nt and for ribozyme 3 was 121 nt and 279 nt. Molecular Marker (MM) (lane 1) was the 50 bp DNA Ladder (Invitrogen).
Fig 6
Fig 6. Average fluorescence intensity emission spectra from HCR-FRET of RNA target cleaved by ribozymes using the first set of DNA hairpins, H1 and H2.
HCR-FRET assay with intact 400 nt target RNA (A), RNA cleaved with ribozyme 1 (B), and RNA cleaved with ribozyme 3 (C). Spectra were obtained by subtracting the negative control spectrum (without initiator RNA molecules) and the assays were performed with 1200 nM of RNA and 600 nM of H1 and H2 from first set in SSC 5X buffer for a target RNA:H1:H2 (2:1:1) molar ratio in technical duplicates in three independent days. In all panels, the red lines represent the positive control performed with the first 18 nt SARS-CoV-2 viral RNA target, and the black lines represent the intact 400 nt target RNA (A), RNA cleaved with ribozyme 1 (B), and RNA cleaved with ribozyme 3 (C).
Fig 7
Fig 7. Schematic representation of HCR-FRET by first DNA hairpins H1/H2 set and ribozymes cleavage.
HCR-FRET sites of the first DNA hairpins H1/H2 set on intact 400 nt SARS-CoV-2 viral RNA (A). Ribozyme 1 cleaves the 400 nt SARS-CoV-2 viral RNA at one site, producing two fragments of 155 nt and 245 nt (B), while a single cleavage by ribozyme 3 generates the segments of 121 nt and 279 nt (C). HCR-FRET may occur in segments of 245 nt and 279 nt by the first set H1/H2 DNA hairpins. The cleavage sites are represented in order and scale position relative to each other.
Fig 8
Fig 8. HCR-FRET analyses using both H1/H2 DNA hairpins sets and ribozymes.
Average fluorescence intensity emission spectra resulting from HCR-FRET with each individual DNA hairpin set, the first H1/H2 set, the second H1/H2 set, and their combination (A). The experiments were conducted using 1200 nM of 400 nt SARS-CoV-2 viral RNA target and each 18 nt SARS-CoV-2 viral RNA segment, with 600 nM of each H1/H2 DNA hairpin, maintaining a molar ratio of 2:1:1 (target:H1:H2) in 5X SSC buffer. All assays were performed in biological duplicates across at least three independent experiments. Black lines represent the first H1/H2 set, red lines the second H1/H2 set, and blue lines the combination of both H1/H2 sets. Positive controls were conducted using the corresponding 18 nt initiator RNA molecules or both. Spectra were obtained by subtracting the negative control spectrum (without initiator RNA molecules). HCR-FRET assays were similarly performed but with prior cleavage of the 400 nt SARS-CoV-2 viral RNA by ribozymes 1 and 3, separately and both (B).
Fig 9
Fig 9. Schematic representation of HCR-FRET by both H1/H2 DNA hairpins sets and ribozymes cleavage.
HCR-FRET sites of the first and second H1/H2 sets on intact 400 nt SARS-CoV-2 viral RNA (A). Ribozyme 1 cleaves the 400 nt SARS-CoV-2 viral RNA at one site, producing two fragments of 155 nt and 245 nt (B), while a single cleavage by ribozyme 3 generates the segments of 121 nt and 279 nt (C). HCR-FRET may occur on these segments by DNA hairpins H1/H2 sets. Simultaneous cleavage by ribozymes 1 and 3 produces three segments of 121 nt, 34 nt, and 245 nt, and HCR-FRET may occur in two of them (D). Cleavage sites are represented in order and scale position relative to each other.
Fig 10
Fig 10. Determination of the lowest detectable concentration of SARS-CoV-2 viral RNA target and detection time.
Average fluorescence intensity emission spectra from HCR-FRET between H1 and H2 at different concentrations of the 18 nt initiator RNA molecules (0.5, 2.5, 5, 10, 50, 100, 300, and 600 nM) and 600 nM of each H1/H2 set in 5X SSC buffer (A). Bar graph (B) showing the average fluorescence intensity emission at 660 nm after a 10-minute ribozyme 1 cleavage assay on intact 400 nt SARS-CoV-2 RNA viral, followed by fluorescence HCR-FRET detection at different time points: immediately (0 minutes), 10 minutes, 40 minutes, and one hour. The light gray bars represent cleave of 400 nt with ribozime 1 and dark gray bars the positive control. The positive control included both 18 nt initiator RNA1 and RNA2 targets at 600 nM and 600 nM of both DNA hairpins H1/H2 sets. All assays were performed in technical triplicates and at least two independent experiments. Spectra were obtained by subtracting the negative control spectrum (without initiator RNA molecules).
Fig 11
Fig 11. Detection of the FRET process using prototype DIY photo-fluorometer based on image analysis.
Fluorescence intensity emitted from HCR-FRET with both H1 to H2 sets for different RNA target concentration (50, 100, 200, 300, 600, 1200 nM) (A). The readings were carried out using the SpectraMax M3 plate reader spectrofluorometer. FRET detection (red emission channel) was performed through image analysis using a Canon DS126191 digital camera with excitation by RGB LED light sources. The white plate sample excitation was performed at an incidence angle 45° relative to the base of the plate, considering that images would be captured perpendicular to this base. The results of excitation with red, blue, and green light are shown in panels (B), (C), (D), respectively.

Similar articles

References

    1. Pradhan M, Shah K, Alexander A, Ajazuddin, Minz S, Singh MR, et al.. COVID-19: clinical presentation and detection methods. Journal of immunoassay & immunochemistry. 2022;43(1):1951291. doi: 10.1080/15321819.2021.1951291 - DOI - PubMed
    1. Artika IM, Dewi YP, Nainggolan IM, Siregar JE, Antonjaya U. Real-Time Polymerase Chain Reaction: Current Techniques, Applications, and Role in COVID-19 Diagnosis. Genes. 2022;13(12). doi: 10.3390/genes13122387 - DOI - PMC - PubMed
    1. Bossuyt PM. Testing COVID-19 tests faces methodological challenges. Journal of clinical epidemiology. 2020;126:172–6. doi: 10.1016/j.jclinepi.2020.06.037 - DOI - PMC - PubMed
    1. Gitman MR, Shaban MV, Paniz-Mondolfi AE, Sordillo EM. Laboratory Diagnosis of SARS-CoV-2 Pneumonia. Diagnostics (Basel, Switzerland). 2021;11(7). doi: 10.3390/diagnostics11071270 - DOI - PMC - PubMed
    1. Prevention. CfDCa. Antigen Testing Guidelines. 2022 [https://www.cdc.gov/coronavirus/2019-ncov/lab/resources/antigen-tests-gu....

MeSH terms

LinkOut - more resources