. 2024 Sep 26;19(9):e0293383.
doi: 10.1371/journal.pone.0293383. eCollection 2024.

Serum-deprivation response of ARPE-19 cells; expression patterns relevant to age-related macular degeneration

Affiliations

Serum-deprivation response of ARPE-19 cells; expression patterns relevant to age-related macular degeneration

Katherine M Peterson et al. PLoS One. .

Abstract

ARPE-19 cells are derived from adult human retinal pigment epithelium (RPE). The response of these cells to the stress of serum deprivation mimics some important processes relevant to age-related macular degeneration (AMD). Here we extend the characterization of this response using RNASeq and EGSEA gene set analysis of ARPE-19 cells over nine days of serum deprivation. This experiment confirmed the up-regulation of cholesterol and lipid-associated pathways that increase cholesterol levels in these cells. The gene expression analysis also identified other pathways relevant to AMD progression. There were significant changes in extracellular matrix gene expression, notably a switch from expression of collagen IV, a key component of Bruch's membrane (part of the blood-retina barrier), to expression of a fibrosis-like collagen type I matrix. Changes in the expression profile of the extracellular matrix led to the discovery that amelotin is induced in AMD and is associated with the development of the calcium deposits seen in late-stage geographic atrophy. The transcriptional profiles of other pathways, including inflammation, complement, and coagulation, were also modified, consistent with immune response patterns seen in AMD. As previously noted, the cells resist apoptosis and autophagy but instead initiate a gene expression pattern characteristic of senescence, consistent with the maintenance of barrier function even as other aspects of RPE function are compromised. Other differentially regulated genes were identified that open new avenues for investigation. Our results suggest that ARPE-19 cells maintain significant stress responses characteristic of native RPE that are informative for AMD. As such, they provide a convenient system for discovery and for testing potential therapeutic interventions.


Conflict of interest statement

The authors have declared that no competing interests exist.

Figures

Fig 1
Fig 1. The small-multiple display of volcano plots.
Scatter plots of RNASeq DESeq results, P-value vs. Fold Change (volcano plots), for each sample day arranged chronologically. Each point represents a gene. The Fold change plotted along the X-axis is the Signed Fold Change (SFC) defined in the Sequence Analysis section above. For readability of the X-axis, SFC values less than -20 and greater than 20 are truncated to -20 or 20. The P-value is plotted on the Y-axis. Color represents the P-value; red points have P-values ≤ 0.05, and grey points have P-values > 0.05. The X-axis reference line is SFC = 0. The Y-axis reference line is P-value = 0.05. While the Y-axis is rendered in log scale, the actual P-value labels are displayed along the axis. Fig 2B is an extended interactive version of Fig 1, displaying the data with gene and measure details.
Fig 2
Fig 2. Significant cholesterol genes arranged by day.
A. Volcano plots of genes identified as Cholesterol Metabolism Genes. Scatter plots of the RNASeq DESeq results, P-value vs. Fold Change for each sample day, arranged chronologically. Each point represents a gene. The Fold Change plotted on the X-axis is the SFC. The P-value is plotted on the Y-axis. Color represents the P-value; red points have P-values ≤ 0.05, and grey points have P-values > 0.05. The X-axis reference line is SFC = 0. The Y-axis reference line is P-value = 0.05. While the Y-axis is rendered in log scale, the actual P-value labels are given along the axis. B. The 15 gene sets identified as significant by EGSEA for Cholesterol contain 40 unique genes. Tiles represent the genes for each sample day when the P-value is ≤ 0.05. Genes with increased expression are blue; genes with decreased expression are orange; the depth of color reflects the magnitude of the increase or decrease. An expanded and interactive version of this figure is available here, Fig 3.
Fig 3
Fig 3. Expression patterns of differentially expressed genes associated with the extracellular matrix.
Highlight display of DEGs for basement membrane collagens, integrins, laminins, nidogens, perlecan, and fibrillar collagens. Genes are represented in the rows. The SFC for each sample day is represented by squares color-coded for the magnitude of the fold change. Orange squares represent down-regulated expression, blue squares represent up-regulated expression, and grey squares have P-values greater than 0.05.
Fig 4
Fig 4. Collagen type I vs. collagen type IV in normal and AMD human retina.
Human retinas probed with collagen type I, collagen type IV, DAPI (nuclei), and PNA (detects cone photoreceptors). A. normal retina. B. AMD retina. ONL- outer nuclear layer, PR–photoreceptors, RPE–retinal pigment epithelium, Sc–sclera. Arrows indicate collagen in Bruch’s membrane.
Fig 5
Fig 5. Volcano plots of cell cycle genes.
Scatter plots of RNASeq DESeq results, P-value vs. Fold Change (volcano plots),for each sample day arranged chronologically and filtered to genes involved in the cell cycle. Each point represents a gene. The Fold change plotted on the X-axis is the SFC. The P-value is plotted on the Y-axis. Color represents the P-value; red points have P-values ≤ 0.05, and grey points have P-values > 0.05. The X-axis reference line is SFC = 0. The Y-axis reference line is P-value = 0.05. While the Y-axis is rendered in log scale, the actual p-value labels are given along the axis. Fig 5 presents an expanded and interactive version of this figure.
Fig 6
Fig 6. ß-galactosidase activity in serum-deprived ARPE-19 cells.
A. ARPE-19 cells cultured in serum-supplemented media stained for ß-galactosidase activity. B. ARPE-19 cells cultured in serum-free media for nine days and stained for ß-galactosidase activity. The ß-galactosidase substrate turns blue in the presence of ß-galactosidase activity.
Fig 7
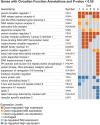
Fig 7. Genes annotated with circadian functions and their expression patterns.
The list of genes and their symbols. Each square represents the gene expression level in raw counts and the change direction. Orange squares represent downregulation, and blue squares represent upregulation. The darker shades of color represent higher expression levels (see Fig 7A).

References

    1. Fleckenstein M, Keenan TDL, Guymer RH, Chakravarthy U, Schmitz-Valckenberg S, Klaver CC, et al.. Age-related macular degeneration. Nat Rev Dis Primers. 2021;7(1):25. doi: 10.1038/s41572-021-00265-2 . - DOI - PubMed
    1. Ambati J, Fowler BJ. Mechanisms of Age-Related Macular Degeneration. Neuron. 2012;75(1):26–39. doi: 10.1016/j.neuron.2012.06.018 - DOI - PMC - PubMed
    1. O’Leary F, Campbell M. The blood-retina barrier in health and disease. Febs Journal.14. doi: 10.1111/febs.16330 . - DOI - PubMed
    1. Curcio CA, Johnson M. Structure, Function, and Pathology of Bruch’s Membrane. In: Stephen J. Ryan SRS,… Andrew P. Schachat, editor. Retina (Fifth Edition). 1: Elsevier; 2013. p. 465–81.
    1. Fritsche LG, Fariss RN, Stambolian D, Abecasis GR, Curcio CA, Swaroop A. Age-Related Macular Degeneration: Genetics and Biology Coming Together. In: Chakravarti A, Green E, editors. Annual Review of Genomics and Human Genetics, Vol 15. Annual Review of Genomics and Human Genetics. 15. Palo Alto: Annual Reviews; 2014. p. 151–71. - PMC - PubMed

MeSH terms