. 2024 Sep 26;22(9):e3002795.
doi: 10.1371/journal.pbio.3002795. eCollection 2024 Sep.

An estimate of fitness reduction from mutation accumulation in a mammal allows assessment of the consequences of relaxed selection

Affiliations

An estimate of fitness reduction from mutation accumulation in a mammal allows assessment of the consequences of relaxed selection

Jobran Chebib et al. PLoS Biol. .

Abstract

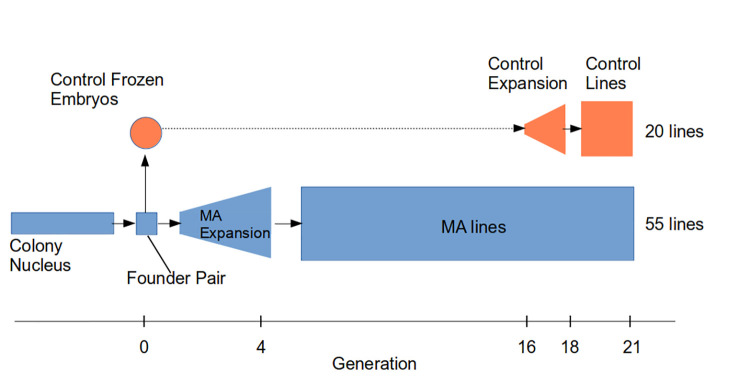
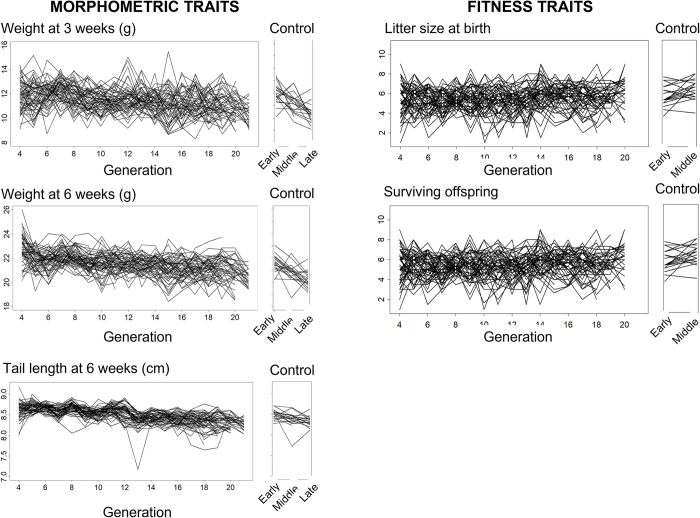
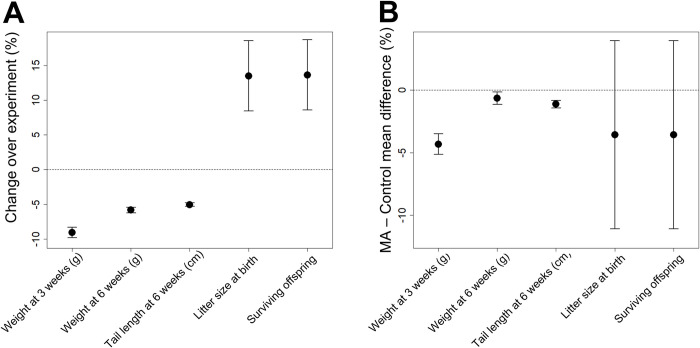
Each generation, spontaneous mutations introduce heritable changes that tend to reduce fitness in populations of highly adapted living organisms. This erosion of fitness is countered by natural selection, which keeps deleterious mutations at low frequencies and ultimately removes most of them from the population. The classical way of studying the impact of spontaneous mutations is via mutation accumulation (MA) experiments, where lines of small effective population size are bred for many generations in conditions where natural selection is largely removed. Such experiments in microbes, invertebrates, and plants have generally demonstrated that fitness decays as a result of MA. However, the phenotypic consequences of MA in vertebrates are largely unknown, because no replicated MA experiment has previously been carried out. This gap in our knowledge is relevant for human populations, where societal changes have reduced the strength of natural selection, potentially allowing deleterious mutations to accumulate. Here, we study the impact of spontaneous MA on the mean and genetic variation for quantitative and fitness-related traits in the house mouse using the MA experimental design, with a cryopreserved control to account for environmental influences. We show that variation for morphological and life history traits accumulates at a sufficiently high rate to maintain genetic variation and selection response. Weight and tail length measures decrease significantly between 0.04% and 0.3% per generation with narrow confidence intervals. Fitness proxy measures (litter size and surviving offspring) decrease on average by about 0.2% per generation, but with confidence intervals overlapping zero. When extrapolated to humans, our results imply that the rate of fitness loss should not be of concern in the foreseeable future.


Conflict of interest statement

The authors have declared that no competing interests exist.

Figures

Fig 1
Fig 1. Overall design of the MA experiment.
The colony nucleus was maintained by Janvier Laboratories, who supplied the founder pair. From these mice, we carried out an expansion phase to establish the MA lines. In parallel, embryos descended from the founder pair were frozen and revived at generation 16 and bred as control lines after an expansion phase.
Fig 2
Fig 2. The pedigree of the MA lines.
The founder pair is shown in yellow at the centre. Their immediate descendants and the expansion phase of the experiment are shown in green. The established separate MA lines are shown in blue, represented as the females that had offspring.
Fig 3
Fig 3. Average trait values of each MA and control line plotted against generation number (the first 3 and 2 generations of the MA and control experiments, respectively, were used to breed separate lines from founder individuals in an expansion phase, and therefore are not included).
The values for the morphological traits are averages for the 2 sexes. For the fitness-related traits, litter size at birth and surviving offspring, values belong only to mothers, and therefore there are no data for these traits in the final generation. The data underlying this figure can be found in https://zenodo.org/records/12783268.
Fig 4
Fig 4
(A) The percent change in trait value over the experiment and its 95% confidence interval for the 3 morphometric traits (body weight at 3 and 6 weeks and tail length at 6 weeks) and the two fitness-related traits (litter size and number of surviving offspring) estimated using linear models, with generation as a fixed effect and sex and litter size fitted as additional fixed effects in models with morphometric traits. (B) Differences between phenotypic means of MA lines and controls for overlapping time periods (mice born and bred during the same time period), expressed as percent difference with 95% confidence intervals. The data underlying this figure can be found in https://zenodo.org/records/12783268.
Fig 5
Fig 5. Birth dates of mice used in contemporary phenotypic comparison of MA (2,030 mice) and Control (1,132 mice) lines.
The vertical (solid) line separates MA line mice (left) from Control line mice (right). The horizontal (dashed) lines separate the 3 time periods used in the analysis. Note that the control mice underwent an expansion phase and this will mitigate the influence maternal effects. The data underlying this figure can be found in https://zenodo.org/records/12783268.

Comment in

Similar articles

Cited by

References

    1. Barton NH, Otto SP. Evolution of recombination due to random drift. Genetics. 2005;169:2353–2370. doi: 10.1534/genetics.104.032821 - DOI - PMC - PubMed
    1. Krasovec M, Sanchez-Brosseau S, Piganeau G. First estimation of the spontaneous mutation rate in diatoms. Genome Biol Evol 2019;11(7):1829–1837. doi: 10.1093/gbe/evz130 - DOI - PMC - PubMed
    1. Bergeron LA et al.. Evolution of the germline mutation rates across vertebrates. Nature. 2023;615:295–291. - PMC - PubMed
    1. Lynch M, Ali F, Lin T, Wang Y, Ni J, Long H. The divergence of mutation rates and spectra across the Tree of Life. EMBO Rep. 2023;24(10):e57561. doi: 10.15252/embr.202357561 - DOI - PMC - PubMed
    1. Wang Y, Obbard DJ. Experimental estimates of germline mutation rate in eukaryotes: a phylogenetic meta-analysis. Evol Lett. 2023;7:216–226. - PMC - PubMed

LinkOut - more resources