. 2024 Sep 26;20(9):e1011416.
doi: 10.1371/journal.pgen.1011416. eCollection 2024 Sep.

Human cells contain myriad excised linear intron RNAs with links to gene regulation and potential utility as biomarkers

Affiliations

Human cells contain myriad excised linear intron RNAs with links to gene regulation and potential utility as biomarkers

Jun Yao et al. PLoS Genet. .

Abstract

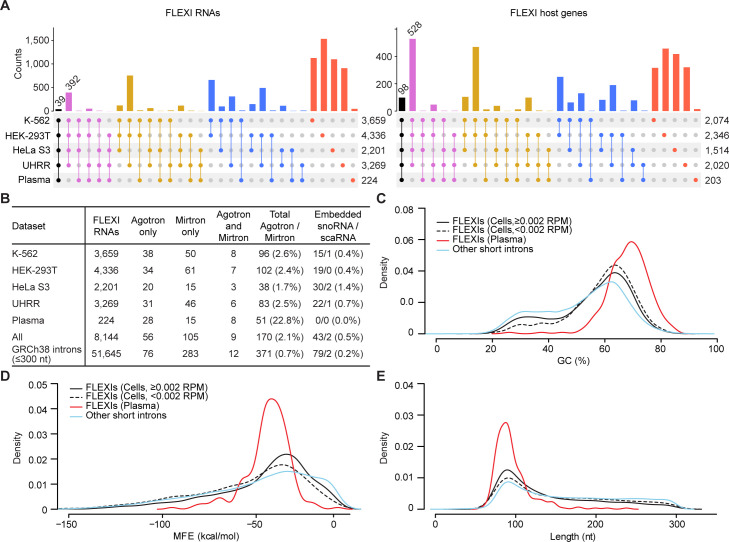
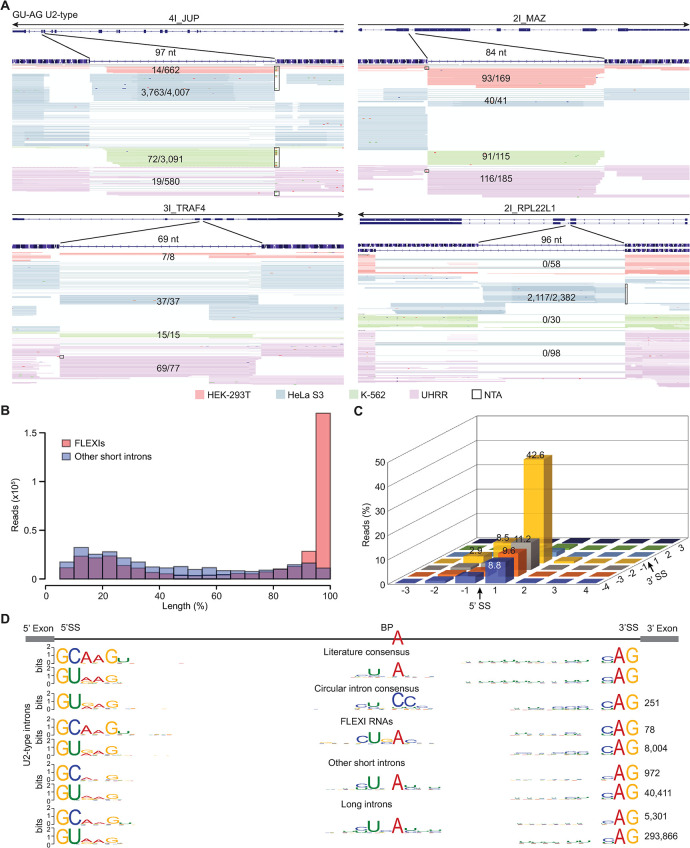
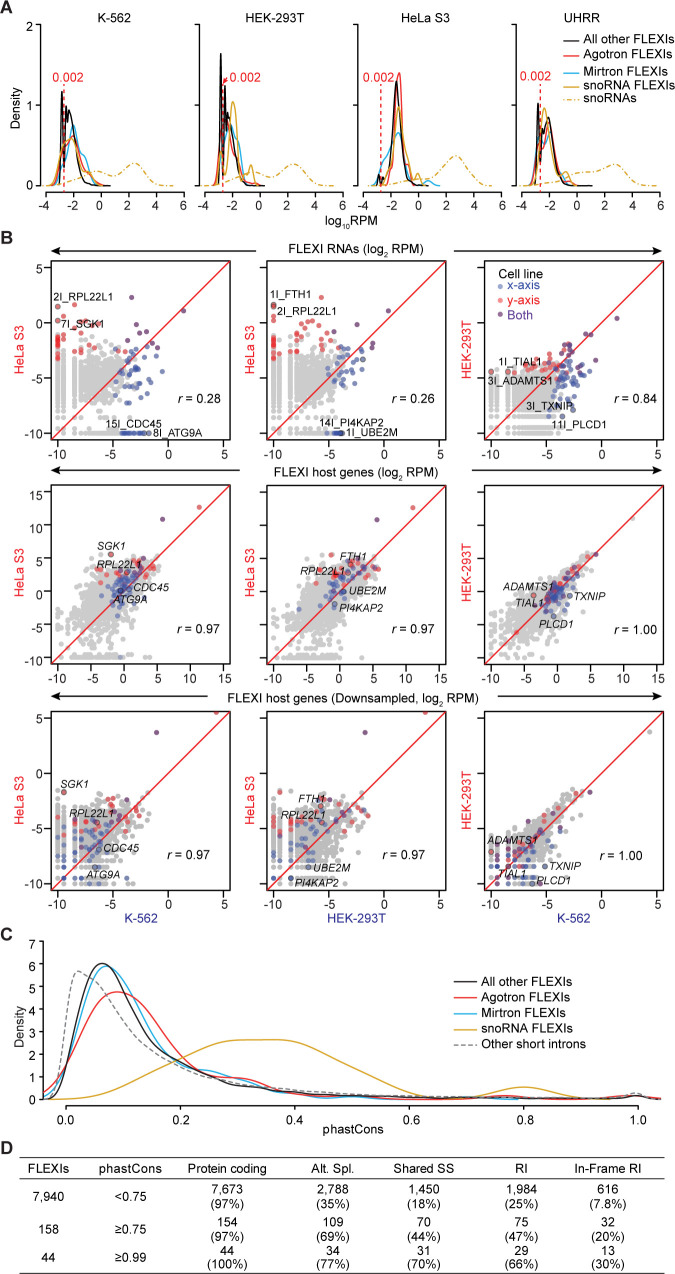
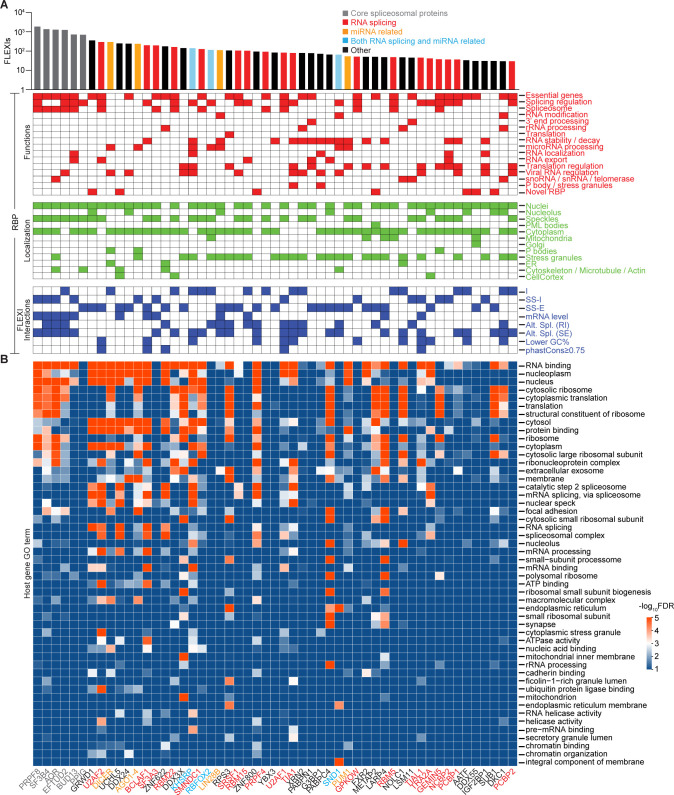
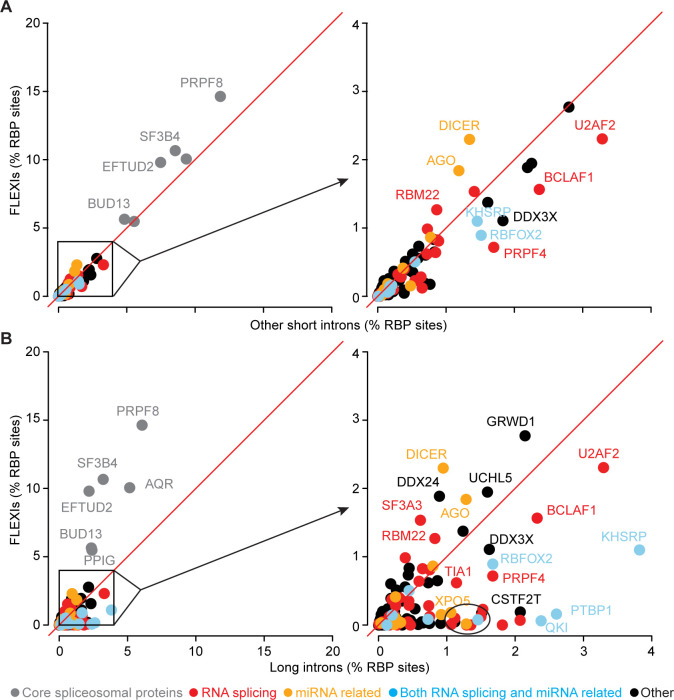
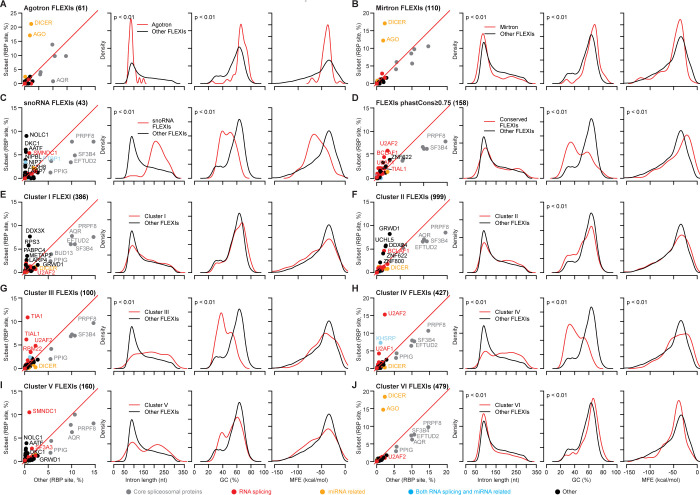
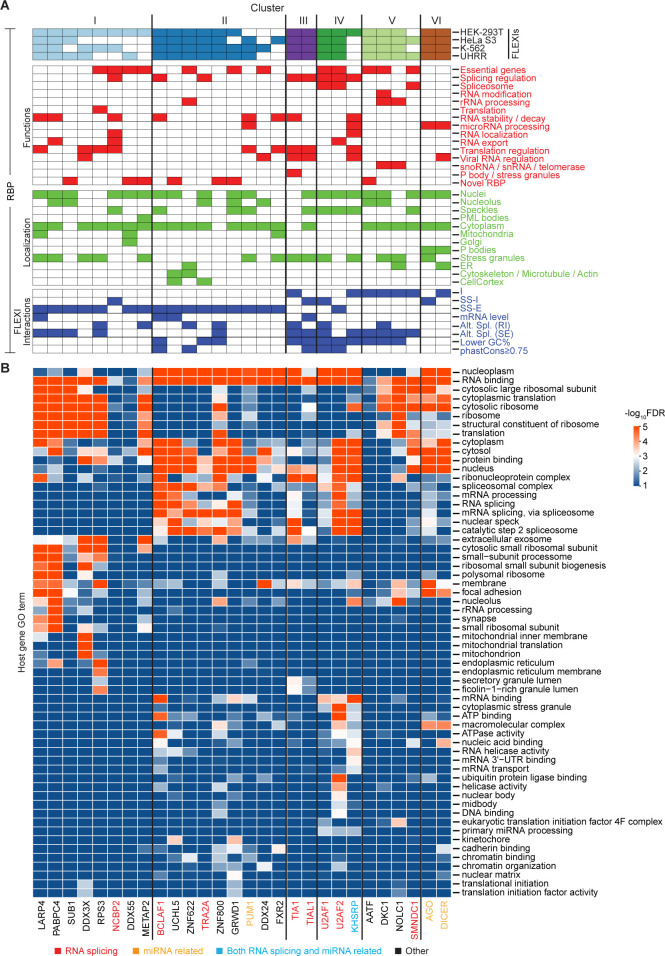
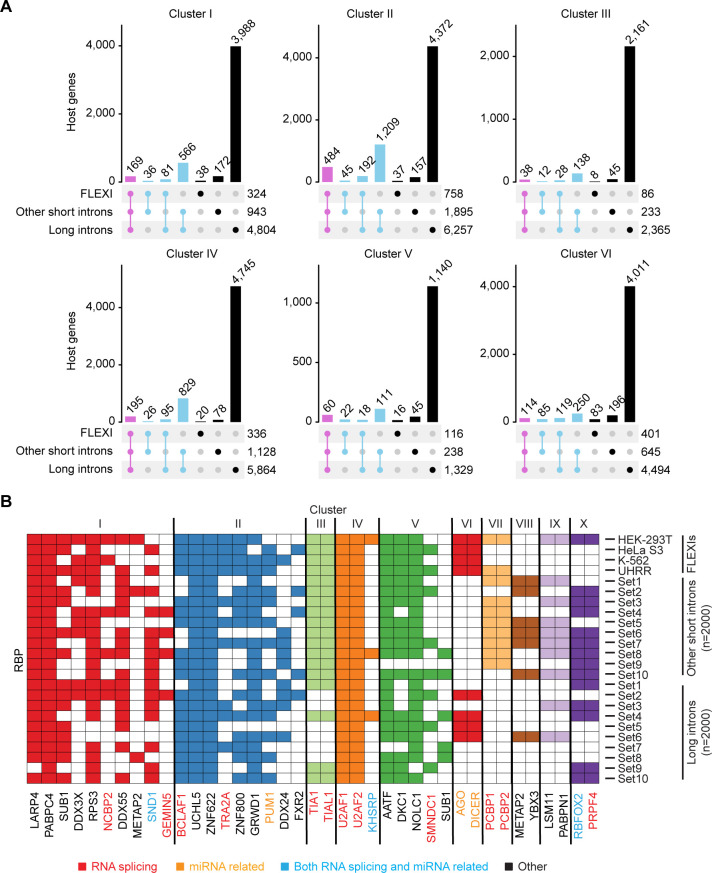
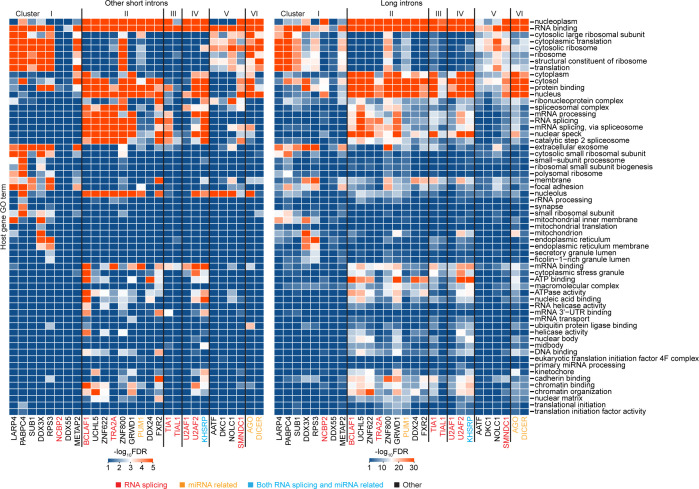
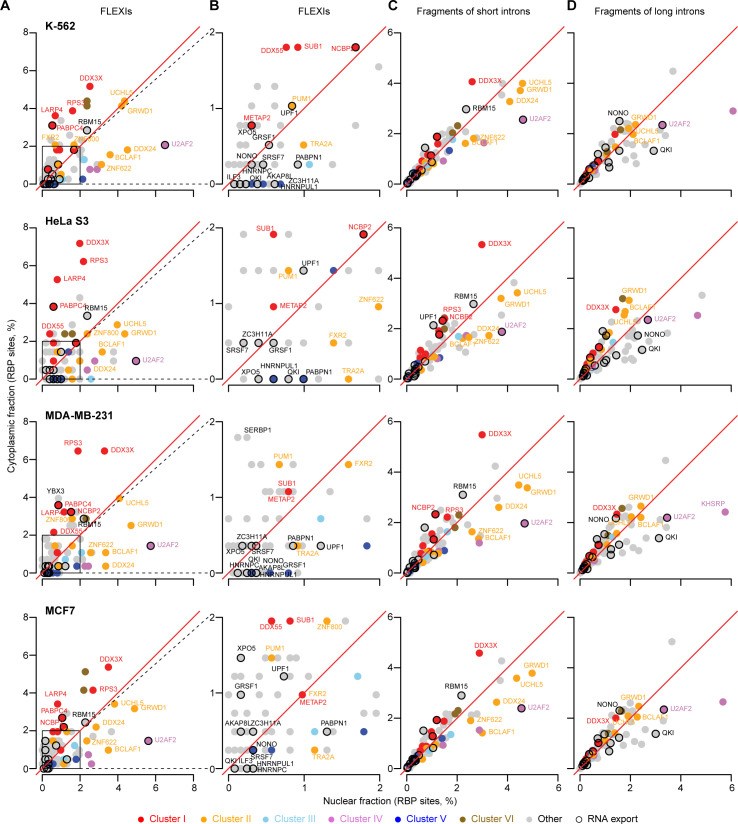
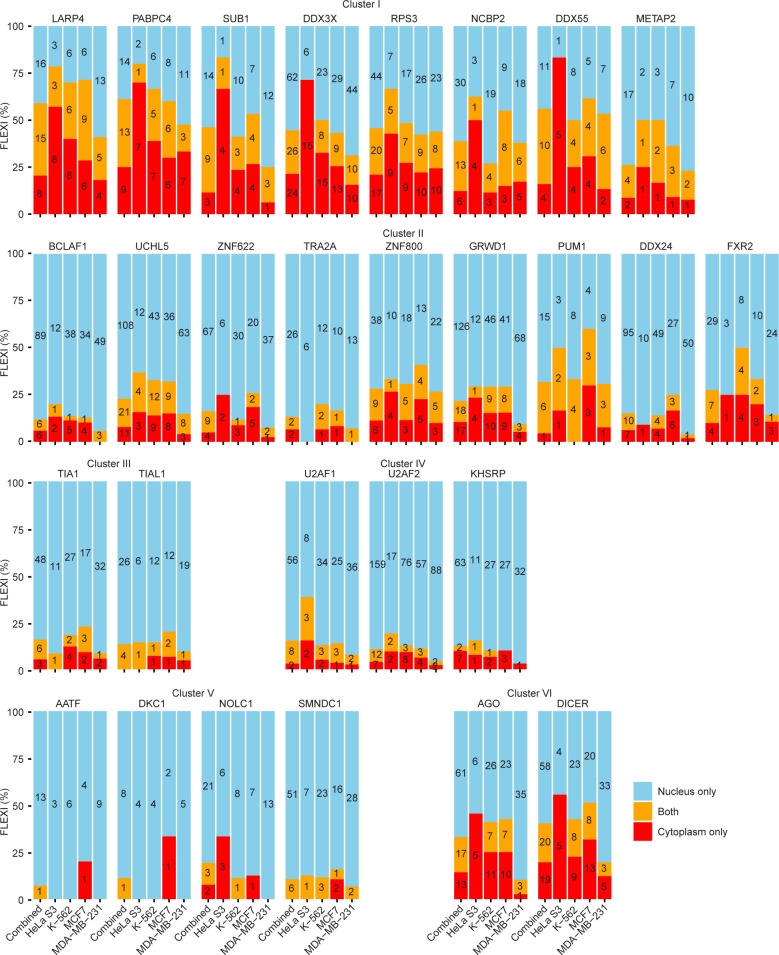
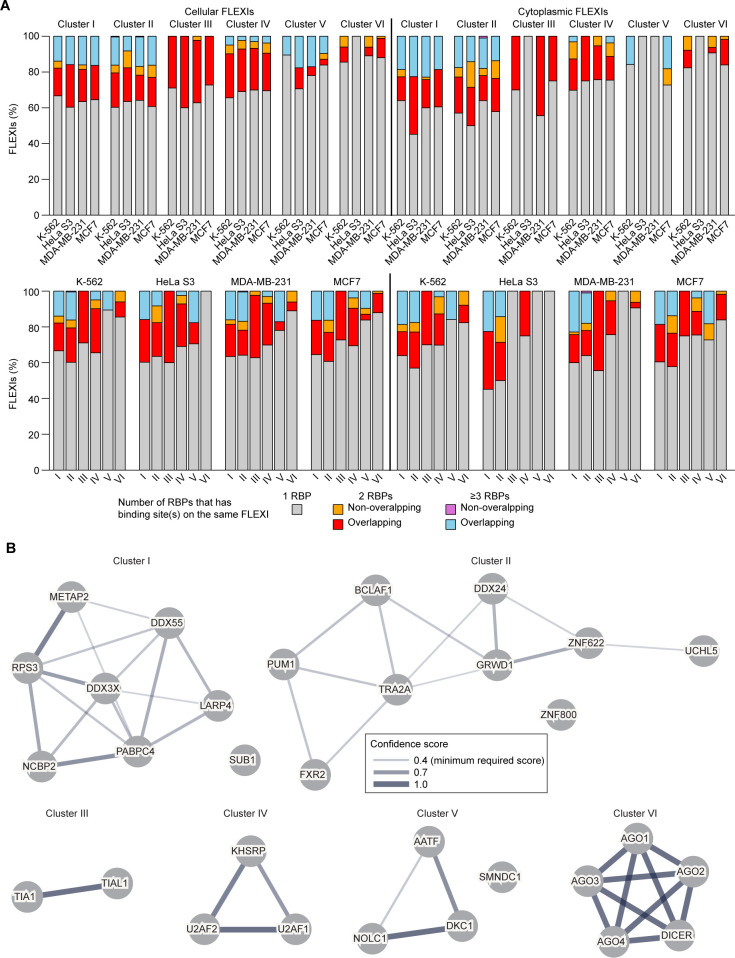
A previous study using Thermostable Group II Intron Reverse Transcriptase sequencing (TGIRT-seq) found human plasma contains short (≤300 nt) structured full-length excised linear intron (FLEXI) RNAs with potential to serve as blood-based biomarkers. Here, TGIRT-seq identified >9,000 different FLEXI RNAs in human cell lines, including relatively abundant FLEXIs with cell-type-specific expression patterns. Analysis of public CLIP-seq datasets identified 126 RNA-binding proteins (RBPs) that have binding sites within the region corresponding to the FLEXI or overlapping FLEXI splice sites in pre-mRNAs, including 53 RBPs with binding sites for ≥30 different FLEXIs. These included splicing factors, transcription factors, a chromatin remodeling protein, cellular growth regulators, and proteins with cytoplasmic functions. Analysis of ENCODE datasets identified subsets of these RBPs whose knockdown impacted FLEXI host gene mRNA levels or proximate alternative splicing, indicating functional interactions. Hierarchical clustering identified six subsets of RBPs whose FLEXI binding sites were co-enriched in six subsets of functionally related host genes: AGO1-4 and DICER, including but not limited to agotrons or mirtron pre-miRNAs; DKC1, NOLC1, SMNDC1, and AATF (Apoptosis Antagonizing Transcription Factor), including but not limited to snoRNA-encoding FLEXIs; two subsets of alternative splicing factors; and two subsets that included RBPs with cytoplasmic functions (e.g., LARP4, PABPC4, METAP2, and ZNF622) together with regulatory proteins. Cell fractionation experiments showed cytoplasmic enrichment of FLEXI RNAs with binding sites for RBPs with cytoplasmic functions. The subsets of host genes encoding FLEXIs with binding sites for different subsets of RBPs were co-enriched with non-FLEXI other short and long introns with binding sites for the same RBPs, suggesting overarching mechanisms for coordinately regulating expression of functionally related genes. Our findings identify FLEXIs as a previously unrecognized large class of cellular RNAs and provide a comprehensive roadmap for further analyzing their biological functions and the relationship of their RBPs to cellular regulatory mechanisms.


Conflict of interest statement

I have read the journal’s policy and the authors of this manuscript have the following competing interests: AML is an inventor on patents owned by the University of Texas at Austin for TGIRT enzymes and other stabilized reverse transcriptase fusion proteins and methods for non-retroviral reverse transcriptase template switching. AML, JY, and HX are inventors on a patent application filed by the University of Texas for the use of FLEXIs and other intron RNAs as biomarkers.

Figures

Fig 1
Fig 1. Characteristics of FLEXIs in human cells and plasma.
(A) UpSet plots of FLEXI RNAs and their host genes identified by TGIRT-seq of RNA preparations from the indicated human cell lines and plasma. Different FLEXIs from the same host gene were aggregated into one entry for that gene in the plot. (B) Numbers and percentages of different FLEXIs in datasets for each sample type that correspond to an annotated agotron, a pre-miRNA of an annotated mirtron, or encode an annotated snoRNA, including Cajal body-specific snoRNAs (scaRNAs). "All" indicates the number and percentages of different FLEXIs in each category in this group of samples, and GRCh38 indicates the number and percentages of all 51,645 annotated short introns (≤300 nt) in each category in the GRCh38 human genome reference sequence. (C-E) Density distribution plots of (C) GC content, (D) minimum free energy (MFE) for the most stable RNA secondary structure predicted by RNAfold, and (E) length for different categories of FLEXIs compared to other GRCh38-annotated short introns in a merged dataset for the 4 cellular RNA samples.
Fig 2
Fig 2. FLEXI RNAs are detected by TGIRT-seq as continuous full-length, end-to-end reads.
(A) Integrative Genomics Viewer (IGV) screenshots showing read alignments for FLEXI RNAs in RNA samples from different cell lines. FLEXIs are named at the top above an arrow indicating the 5’ to 3’ orientation of the RNA with the tracks below showing gene annotations (exons, thick lines; introns, thin lines) followed by alignments of FLEXI reads in different cellular RNA samples color coded by sample type. The length of the intron that is the focus of each panel is shown above the read alignments, and the fraction of FLEXI reads (continuous reads that began and ended within 3 nt of the annotated 5’- and 3’-splice sites) for that intron in different cell lines is shown within the read alignments. Boxes indicate non-templated nucleotides added to the 3’ end of cDNAs by TGIRT-III (denoted NTA). Reads were down sampled to a maximum of 100 for display in IGVs. (B) Histogram of the length distribution of reads mapping to introns identified as FLEXIs (red) compared to those mapping to other Ensemble GRCh38-annotated short introns (≤300 nt; blue) in a merged dataset for the K-562, HEK-293T, HeLa S3, and UHRR cellular RNA samples. Percent length was calculated from TGIRT-seq read spans in the indicated intervals normalized to the length of the corresponding intron. FLEXIs encoding embedded sno/scaRNAs were excluded to avoid contributions from fully or partially processed sno/scaRNAs. (C) Three-dimensional bar graph showing the percentage of FLEXI reads in a merged dataset for the 4 cellular RNA samples ending at different positions around intron-exon junctions. Arrows indicate the 5’- and 3’-splice sites (5’SS and 3’SS, respectively). (D) Splice-site and branch-point (BP) consensus sequences of FLEXIs corresponding to GC-AG and GU-AG U2-type spliceosomal introns in a merged dataset for the 4 cellular RNA samples compared to the literature consensus sequences for human U2-type spliceosomal introns [29,30], circular introns [12], and Ensemble GRCh38-annotated U2-type other short (≤300 nt) or long (>300 nt) introns. The number of introns with each consensus sequence is indicated to the right.
Fig 3
Fig 3. FLEXI RNA abundance, cell-type specific expression patterns, and conservation.
(A) Density distribution plots of the abundance of different categories of FLEXIs in different cellular RNA samples color coded as shown at the top right. A plot for the abundance distribution of annotated snoRNAs (dashed yellow line) in each cellular RNA sample is shown for comparison. The vertical dashed red line in each plot separates lower and higher abundance FLEXIs (<0.002 and ≥0.002 RPM, respectively). (B) Scatter plots showing pairwise comparisons of FLEXI and host gene RNA abundance (log2-transformed RPM) in different cellular RNA samples. Top row, all reads that mapped to different FLEXIs; middle row, all reads that mapped to different FLEXI host genes; bottom row, all reads that mapped to different FLEXI host genes down sampled to match the sequencing depth of FLEXI reads. Dots for relatively abundant FLEXI RNAs (≥0.01 RPM) that were reproducibly highly expressed in one or both of the compared cell lines in all technical replicates are colored red, blue, or purple in the top row of plots with examples named in the plots and dots corresponding to their host gene RNAs similarly named and color coded in the middle and bottom rows of plots. Pearson correlation coefficients (r) for all detected FLEXIs or their host gene RNAs are shown for each scatter plot. (C) Density distribution plots of phastCons scores for different categories of FLEXIs in the cellular and plasma RNA samples compared to those of other annotated short introns (≤300 nt). PhastCons scores were calculated as the average score across all intron bases from multiple sequences alignment of 27 primates, including humans, mice, dogs, and armadillos. (D) Characteristics of conserved FLEXIs with different phastCons scores (<0.75, ≥0.75, and ≥0.99) in a merged dataset for the K-562, HEK-293T, HeLa S3, and UHRR cellular RNA samples. The number of FLEXIs in each group is shown to the left, and the numbers and percentages FLEXIs in different categories are shown to the right. Alt. Spl. indicates FLEXIs that were alternatively spliced to generate different protein isoforms based on Ensemble GRCh38 annotations. Shared SS indicates FLEXIs that share a 5’- or 3’-splice site with a longer intron (>300 nt). RI indicates FLEXIs that are retained in some annotated alternatively spliced transcripts, and In-Frame RI indicates subsets of those retained FLEXIs that have reading frames in frame with their flanking exons.
Fig 4
Fig 4. FLEXI interactions with RNA-binding proteins.
(A) Bar graph showing the number of different FLEXI RNAs that have a CLIP-seq-identified binding site for each of the 53 RBPs with binding sites for ≥30 different FLEXIs in a merged dataset for the K-562, HEK-293T, HeLa S3, and UHRR cellular RNA samples. An extended version of the bar graph for all 126 RBPs is shown in S10A Fig. Bar graph RBPs are color coded by protein function as shown above the bar graph. The grids below the bar graph show reported RBP Functions (red boxes), Intracellular Localization (green boxes), and FLEXI Interactions (blue boxes). RNA-binding sites: I, within introns corresponding to FLEXIs; SS-I and SS-E, bimodally enriched across the 5’- and 3’ splice sites in unspliced pre-mRNAs with the midpoints in the intron or flanking exon (SS-I and SS-E, respectively; Figs 4A and S11). mRNA levels, RBPs whose knockdown resulted in significant difference in mRNA levels (increased or decreased, DESeq2 |LFC|≥1, adjusted p≤0.05) from host gene of FLEXIs with a binding site for that RBP compared to those genes whose transcripts lacked a binding site for the same RBPs based on ENCODE RBP-knockdown datasets (p≤0.05 calculated by Fisher’s exact test; S13 Fig). Alt. Spl., RBPs whose knockdown resulted in significant changes (p≤0.05 calculated by Kolmogorov–Smirnov test) in proximate alternative splicing (retained intron (RI) or adjacent skipped exon (SE)) for FLEXIs containing a binding site for that RBP compared to FLEXIs that lacked a binding site for the same RBP (S14 Fig). Lower GC%, percentage of RBPs whose binding sites were significantly enriched in FLEXIs having lower GC% content than other FLEXIs (density plots, S16 Fig); phastCons scores ≥0.75, RBPs whose binding sites were significantly enriched in evolutionarily conserved FLEXIs with phastCons ≥0.75 (Fig 3C). RBP functions and localization for the 51 RBPs in ENCODE eCLIP datasets were based Table S2 of ref. [41] and annotations in the RNA Granule and Mammalian Stress Granules Proteome (MSGP) databases [42, 43], and those for AGO1-4 and DICER were based on the UniProt database (https://www.uniprot.org) and references [–48]. RBP-FLEXI Interactions were based on annotated binding sites and data in ENCODE eCLIP and knockdown datasets and PAR-CLIP datasets for AGO1-4 and DICER [–40]. (B) Heatmap of GO terms enriched in host genes of FLEXI RNAs containing binding sites for different RBPs. GO enrichment analysis was performed with DAVID bioinformatics tools, using all FLEXI host genes as the background. The color scale shown at the right is based on -log10-transformed false discovery rate (FDR).
Fig 5
Fig 5. Relative abundance of annotated RBP-binding sites in FLEXIs compared to other short or long introns.
(A and B) Scatter plots comparing the abundance (%) of different RBP-binding sites in FLEXIs to (A) other short introns and (B) long introns. RBPs whose binding sites constituted ≥1% of the total RBP-binding sites and whose abundance was significantly different between the compared groups (adjusted p≤0.05; calculated by Fisher’s exact test and adjusted by the Benjamini-Hochberg procedure) are indicated by the name of the protein color coded by protein function as indicated at the bottom of the Figure. For each panel, the box within the scatter plot on the left delineates a region that is expanded in the scatter plot on the right. The circled cluster of dots at the bottom left of the scatterplot on the right in panel B encompasses 12 additional RBPs (FAM120A, GTF2F1, HNRNPC, HNRNPK, HNRNPL, HNRNPM, ILF3, MATR3, NONO, PCBP2, SUGP2, and TARDBP) whose binding sites met the abundance and significance criteria for enrichment in long introns compared to FLEXIs but were too numerous to name in the Figure.
Fig 6
Fig 6. Characterization of subsets of FLEXIs enriched in binding sites for different subsets of RBPs.
(A) FLEXIs annotated as agotrons; (B) FLEXIs that are pre-miRNAs of annotated mirtrons; (C) FLEXIs encoding an annotated snoRNA. Binding sites for AATF were found only in FLEXIs encoding C/D-box snoRNAs, while those for DKC1, a core H/ACA-box snoRNA-binding protein [76], were found in FLEXIs encoding both H/ACA- and C/D-box snoRNAs. (D) Conserved FLEXIs with phastCons score ≥0.75; (E-J) FLEXIs identified by hierarchical clustering as being enriched in binding sites for different subsets of RBPs (see Fig 7 below). The different subsets of FLEXIs are named above the plots with the number of FLEXIs in that subset indicated in parentheses. The leftmost panels show scatter plots for CLIP-seq-identified binding sites in the indicated subset of FLEXIs (y-axis) compared to all other FLEXIs (x-axis) in a merged dataset for the K-562, HEK-293T, HeLa S3, and UHRR cellular RNA samples, and the three panels to the right show density plots comparing different characteristics of that subset of FLEXIs to all other FLEXIs in the same merged datasets. RBP-binding site annotations in the scatter plots were based on the ENCODE eCLIP datasets for 150 RBPs [38] and AGO1-4 and DICER PAR-CLIP datasets [39, 40]. In the scatter plots, FLEXI RBP-binding sites whose abundance was ≥2% of all RBP-binding sites and significantly different between the compared subset and all other FLEXIs (adjusted p≤0.05; calculated by Fisher’s exact test and adjusted by the Benjamini-Hochberg procedure) are labeled with the name of the RBP color coded by protein function as indicated at the bottom of the Figure. The density distribution plots compare the length, GC content, and MFE for the most stable secondary structure predicted by RNAfold for the subset of FLEXIs (red) compared to all other detected FLEXIs (black). p-values for significant differences are shown at the top left of those density plots in which the distribution for the subset of FLEXIs differed significantly from other FLEXIs (p<0.01 by Kolmogorov–Smirnov test and false positive rate <5% as determined by 1,000 Monte-Carlo simulations). Similar plots for each individual RBP associated with each cluster are shown in S16 Fig.
Fig 7
Fig 7. Identification of RBPs whose binding sites were co-enriched in clusters of FLEXI RNAs.
(A) Hierarchical clustering of FLEXI RNAs based on patterns of over- and under-represented RBP-binding sites (see Materials and Methods and S15 Fig). Clusters I to VI are delineated at the top of panel A, and the names of the RBPs associated with each cluster are shown at the bottom of panel B color coded by protein function as indicated at the bottom of the Figure. The RBPs that met the abundance and significance criteria for association with the clusters in HEK-293T, HeLa S3, K-562, and UHRR are indicated by filled boxes in the grid at the top. The grids below summarize RBP Functions, Localization, and Interactions with FLEXIs based on data sources and analysis indicated in the legend of Fig 4. (B) Heatmap of GO terms enriched in host genes of FLEXI RNAs containing binding sites for RBPs associated with different clusters. GO enrichment analysis was performed with DAVID bioinformatics tools, using all FLEXI host genes as the background. The color scale to the right is based on -log10-transformed false discovery rate (FDR).
Fig 8
Fig 8
Host genes for FLEXIs are enriched in other short and long introns with binding sies from the same subsets of RBPs, (A) UpSet plots showing the distribution of other short (≤300 nt) and long (>300 nt) introns in host genes for FLEXIs with CLIP-seq identified binding sites for RBPs belonging to Cluster I to VI. (B) Hierarchical clustering for co-enrichment of RBP-binding sites in other short and long introns was done as in Fig 7 for 10 subsets of 2,000 randomly selected other short introns or long introns (Set1-10). Hierarchical clustering of other short and long introns with binding sites for different subsets of RBPs recapitulated Clusters I to VI found for FLEXIs with additional RBPs associated with these clusters as well as additional clusters of RBPs (VII to X) found for some subsets of other short or long introns. RBPs whose binding sites were enriched in subsets of FLEXIs in HEK-293T, HeLa S3, K-562, and UHRR are shown at the top for comparison. Names of RBPs are color coded by protein function as indicated at the bottom of the Figure.
Fig 9
Fig 9. GO terms for host genes of non-FLEXI introns with binding sites for Clusters I to VI RBPs.
GO term enrichment analysis was done using DAVID bioinformatics tools for host genes containing other short (left) or long (right) introns. The color scales at the bottom of each heat map were based on -log10-transformed FDR. RBP names are color coded by protein function as indicated at the bottom of the Figure.
Fig 10
Fig 10. The intracellular localization of FLEXI RNAs correlates with that of their CLIP-seq-identified RNA-binding proteins.
Scatter plots comparing the relative abundance of annotated RBP-binding sites in FLEXIs and fragments of other short introns and long intron RNAs in nuclear or cytoplasmic fraction from K-562, HeLa S3, MDA-MB-231, and MCF7 cells. (A and B) Scatter plots for FLEXIs. The box within the scatter plot in panel A delineates a region that is expanded in panel B. (C and D) Scatter plots for other short and long introns, respectively. Each dot in the scatter plots represents the relative abundance of RBP-binding sites in intron RNAs in the nuclear and cytoplasmic fractions, with dots for different categories of RBPs color coded as shown below the plots. In panels A and B, only FLEXIs that were differentially enriched in the nuclear or cytoplasmic fractions (Fold Change >1.5 by DESeq2 analysis; denoted nuclear and cytoplasmic FLEXIs, respectively) were subject to this analysis. For A and B, RBPs that belong to Clusters I and II or function in nuclear RNA export are indicated by named dots in the scatter plots. Other named dots are RBPs whose binding sites constituted ≥2% of all RBP-binding sites and were significantly enriched in FLEXI RNAs in the nuclear or cytoplasmic fractions (adjusted p≤0.05; calculated by Fisher’s exact test and adjusted by the Benjamini-Hochberg procedure). In panels C and D, named RBPs are those that belong to Clusters I and II, function in nuclear RNA export and whose binding sites were significantly enriched in RNA fragments of other short or long introns in the nuclear or cytoplasmic fractions (abundance ≥2%, adjusted p≤0.05; calculated by Fisher’s exact test and adjusted by the Benjamini-Hochberg procedure).
Fig 11
Fig 11. Distribution of FLEXI RNAs between nuclear, cytoplasmic, or both fractions.
Stacked bar graphs show the percentages of FLEXI RNAs containing binding sites for RBPs associated with Clusters I to VI in nuclear, cytoplasmic, or both fractions color coded as shown at the bottom right in combined (left bar) or separate (right bars) TGIRT-seq datasets for 4 different cell lines. The number of FLEXIs identified in either or both fractions is indicated within each segment of the stacked bar graph.
Fig 12
Fig 12. Numbers of CLIP-seq binding sites for Cluster I to VI RBPs in cellular and cytoplasmically enriched FLEXI RNAs.
(A) Stacked bar graphs organized by cluster (top row) or cell type (bottom row) showing the percentage of all cellular (left) and cytoplasmically enriched (right) FLEXI RNAs that have an annotated CLIP-seq-identified binding site for a single RBP, 2 RBPs, or ≥3 RBPs associated with Clusters I to VI. Bars for FLEXI RNAs with binding sites for ≥2 RBPs are subdivided by whether or not the CLIP-seq-identified binding sites were overlapping or non-overlapping. Cytoplasmically enriched FLEXIs were defined as FLEXIs that have LFC>0 using DESeq2 in each cell line. (B) Protein-protein interactions of RBPs associated with Clusters I to VI based solely on protein-interaction network analysis using the STRING database (https://string-db.org/). Interacting RBPs are connected by lines whose thickness indicates the confidence level of the interaction score.

Similar articles

Cited by

References

    1. Wilkinson ME, Charenton C, Nagai K. RNA splicing by the spliceosome. Annu Rev Biochem. 2020;89(1):359–88. doi: 10.1146/annurev-biochem-091719-064225 . - DOI - PubMed
    1. Chapman KB, Boeke JD. Isolation and characterization of the gene encoding yeast debranching enzyme. Cell. 1991;65(3):483–92. doi: 10.1016/0092-8674(91)90466-c - DOI - PubMed
    1. Farrell MJ, Dobson AT, Feldman LT. Herpes simplex virus latency-associated transcript is a stable intron. Proc Natl Acad Sci U S A. 1991;88(3):790–4. doi: 10.1073/pnas.88.3.790 - DOI - PMC - PubMed
    1. Kulesza CA, Shenk T. Murine cytomegalovirus encodes a stable intron that facilitates persistent replication in the mouse. Proc Natl Acad Sci U S A. 2006;103(48):18302–7. Epub 2006/11/14. doi: 10.1073/pnas.0608718103 . - DOI - PMC - PubMed
    1. Gardner EJ, Nizami ZF, Talbot CC, Gall JG. Stable intronic sequence RNA (sisRNA), a new class of noncoding RNA from the oocyte nucleus of Xenopus tropicalis. Genes Dev. 2012;26(22):2550–9. doi: 10.1101/gad.202184.112 - DOI - PMC - PubMed