. 2024 Sep 26;20(9):e1012581.
doi: 10.1371/journal.ppat.1012581. eCollection 2024 Sep.

DNA methylation profiling identifies TBKBP1 as potent amplifier of cytotoxic activity in CMV-specific human CD8+ T cells

Affiliations

DNA methylation profiling identifies TBKBP1 as potent amplifier of cytotoxic activity in CMV-specific human CD8+ T cells

Zheng Yu et al. PLoS Pathog. .

Abstract

Epigenetic mechanisms stabilize gene expression patterns during CD8+ T cell differentiation. Although adoptive transfer of virus-specific T cells is clinically applied to reduce the risk of virus infection or reactivation in immunocompromised individuals, the DNA methylation pattern of virus-specific CD8+ T cells is largely unknown. Hence, we here performed whole-genome bisulfite sequencing of cytomegalovirus-specific human CD8+ T cells and found that they display a unique DNA methylation pattern consisting of 79 differentially methylated regions (DMRs) when compared to memory CD8+ T cells. Among the top demethylated DMRs in cytomegalovirus-specific CD8+ T cells was TBKBP1, coding for TBK-binding protein 1 that can interact with TANK-binding kinase 1 (TBK1) and mediate pro-inflammatory responses in innate immune cells downstream of intracellular virus sensing. Since TBKBP1 has not yet been reported in T cells, we aimed to unravel its role in virus-specific CD8+ T cells. TBKBP1 demethylation in terminal effector CD8+ T cells correlated with higher TBKBP1 expression at both mRNA and protein level, independent of alternative splicing of TBKBP1 transcripts. Notably, the distinct DNA methylation patterns in CD8+ T cell subsets was stable upon long-term in vitro culture. TBKBP1 overexpression resulted in enhanced TBK1 phosphorylation upon stimulation of CD8+ T cells and significantly improved their virus neutralization capacity. Collectively, our data demonstrate that TBKBP1 modulates virus-specific CD8+ T cell responses and could be exploited as therapeutic target to improve adoptive T cell therapies.


Conflict of interest statement

The authors have declared that no competing interests exist.

Figures

Fig 1
Fig 1. Genome-wide methylation profiling of T(CMV) cells.
CD8+ T cell subsets including TN (n = 4), Tmem (n = 5), and T(CMV) cells (n = 5) were sorted using flow cytometry. From each sample, genomic DNA was isolated and converted by bisulfite treatment, followed by WGBS. (A) Circos plot showing DNA methylation levels for TN, Tmem, and T(CMV) cells across the whole genome (in 10 kb tiling windows, aggregated all donors). CpG methylation levels are represented as histogram tracks across the genome based on the sample. High levels of methylation are indicated by dark blue, while low levels of methylation are indicated by light yellow. Brown-teal colour-coding between the bar tracks indicates differences in methylation levels relative to TN cells. (B) Principal Component Analysis (PCA) per cell type and donor samples based on 50,000 highly variable 1 kb tiling regions. The percent of explained variance for each component is denoted in the axis labels. (C) Hierarchical clustering of 15,598 non-overlapping DMRs identified in pair-wise comparisons of methylomes from TN, Tmem, and T(CMV) cells. The dendrogram on top corresponds to hierarchical clustering of the samples. The colour-code illustrates the mean methylation levels of the DMRs as indicated (yellow: methylation level = 0%, blue: methylation level = 100%). (D) Pie charts indicating the position of the pairwise DMRs identified in indicated group-wise comparisons relative to annotated genes. Numbers in parentheses show the number of DMRs in intergenic, promoter, or gene body regions according to their genomic position.
Fig 2
Fig 2. Methylation profiles of gene loci associated with top DMRs from epigenetic signature of T(CMV) cells.
Out of the 71 genes showing unique differential DNA methylation patterns between T(CMV) and Tmem cells the top 12 DMR-associated gene loci were selected. For each gene, CpG motifs (barcodes), DMRs (light grey boxes), and exons of the surrounding gene body (dark grey boxes, transcriptional start site indicated by arrows) are displayed. Coloured lines illustrate methylation values ranging from 0–100% of TN (black), Tmem (cyan), and T(CMV) cells (red) in a linear manner. Mean values from all donors per CD8+ T cell subset are depicted.
Fig 3
Fig 3. Demethylation of TBKBP1 DMR correlates with increased TBKBP1 expression in TEMRA and TEM CD8+ T cell subsets and is stably maintained upon in vitro culture.
Indicated CD8+ T cell subsets were isolated from CMV-seropositive healthy donors and genomic DNA as well as RNA were isolated from sorted samples. Bisulfite-converted genomic DNA was subjected to pyrosequencing using primers targeting the TBKBP1 DMR and RNA was transcribed into cDNA to determine TBKBP1 expression levels by qRT-PCR. (A) Methylation profiles of the TBKBP1 DMR in indicated CD8+ T cell subsets. (Left) The methylation values from 1 representative donor were translated into a colour-code according to the scale ranging from yellow (0% methylation) via white (50% methylation) to blue (100% methylation), the position of the CpG motifs is depicted, and each rectangle represents the methylation value of a single CpG motif. (Right) The scatter plot shows the mean methylation level of all 5 CpG motifs of the TBKBP1 DMR in indicated CD8+ T cell subsets from 5 independent donors. Each dot represents data from one donor and mean values±SD are depicted. (B) The bar plot shows the relative TBKBP1 expression normalized to the housekeeping gene RPS9 in indicated CD8+ T cell subsets. Mean values±SD are depicted (n = 5). (C) Scatterplot and linear regression analysis show correlation of mean methylation of TBKBP1 DMR with mean TBKBP1 expression in indicated CD8+ T cell subsets from 5 donors (r, correlation coefficient; p, p-value).
Fig 4
Fig 4. Long-term in vitro culture of CD8+ T cell subsets does not alter the TBKBP1 DMR methylation patterns.
CD8+ TN and TEMRA cells were isolated from CMV-seropositive healthy donors and cultured in vitro with plate-bound anti-CD3/CD28 antibodies in the presence of exogenous human IL-2 for up to 30 days. Every 5 days, samples from cultured TN (top) and TEMRA cells (bottom) were taken to analyse the TBKBP1 DMR methylation status as described in Fig 3. The heatmaps are from a representative donor (left) and scatter plots summarize the mean methylation levels of all 5 CpG motifs of the TBKBP1 DMR from 5 independent donors. Each dot represents data from one donor and mean values±SD are depicted.
Fig 5
Fig 5. TEM and TEMRA cells display an increased phosphorylation of TBK1 when compared to TCM cells.
To characterize the status of the TBK1 pathway in CD8+ T cell subsets, TN, TCM, TEM and TEMRA cells were isolated from CMV-seropositive healthy donors, and lysates were generated and utilised for immunoblotting. (A) Representative immunoblot analysis of indicated CD8+ T cell subsets from one out of five donors showing the expression of TBKBP1, phosphorylated TBK1 (pTBK1) and TBK1. The analysis of GAPDH expression served as loading control. (B) The bar plots show GAPDH- or α-tubulin-normalized band intensities for TBK1 quantified from sorted TCM, TEM and TEMRA cells of 5 donors. Symbols indicate samples from the same donor. (C) The box-and-whiskers plots show the ratio of GAPDH- or α-tubulin-normalized band intensities of phosphorylated TBK1 and TBK1 from sorted TCM, TEM and TEMRA cells of 5 donors. For statistical analyses, a paired two-tailed student’s t test was conducted with *, p ≤ 0.05.
Fig 6
Fig 6. TBKBP1 overexpression in restimulated CD8+ T cells results in increased TBK1 phosphorylation.
PBMCs obtained from CMV-seronegative healthy donors were stimulated with plate-bound anti-human CD3 and anti-human CD28 for 48 hours and subsequently retrovirally transduced with TBKBP1-expressing vectors or empty vector (EV) controls. Successfully transduced CD8+mCherry+ T cells were sorted by flow cytometry, serum-starved overnight, and subsequently stimulated with soluble anti-human CD3, anti-human CD28, and cross-linking antibodies, while unstimulated cells served as additional controls. Samples from both unstimulated (-) and stimulated (+) EV-transduced or TBKBP1-overexpressing CD8+ T cells were subjected to immunoblotting to determine the expression of (A) TBKBP1, (B) TBK1, and (C) phosphorylated TBK1 (pTBK1). The analysis of GAPDH expression served as loading control. (D) Band intensities for pTBK1 and TBK1 were quantified and the fold change of TBK1 phosphorylation upon stimulation of EV-transduced or TBKBP1-overexpressing CD8+ T cells was determined by dividing the ratio of pTBK1/TBK1 band intensities of stimulated cells to the ratio of pTBK1/TBK1 band intensities of unstimulated samples. Data are combined from 4 independent donors analysed in 2 independent experiments. (E) EV-transduced or TBKBP1-overexpressing CD8+ T cells were stimulated in the presence of a PKCθ inhibitor (+) or treated with DMSO as control (-). Subsequently, CD3+CD8+ cells were analysed for intracellular IFN-γ expression by flow cytometry. The geometric mean fluorescent intensity (gMFI) of IFN-γ expression among CD3+CD8+ cells is depicted. Data are combined from 4 independent donors analysed in 2 independent experiments. (D, E) For statistical analyses, a paired two-tailed student’s t test was conducted with *, p ≤ 0.05.
Fig 7
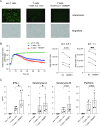
Fig 7. TBKBP1 overexpression enhances virus-reducing capacity of CD8+ T cells.
PBMCs obtained from CMV-seronegative healthy donors were stimulated with plate-bound anti-human CD3 and anti-human CD28 for 48 hours and subsequently retrovirally transduced with both the high-avidity TCR 5–2 containing murine constant regions (mTCR) and directed against the CMV HLA-A*02-peptide NLVPMVATV and also TBKBP1-overexpressing vectors or empty vector (EV) controls. Successfully transduced mTCR 5–2+mCherry+ CD8+ T cells were sorted by flow cytometry and added at indicated effector:target (E:T) ratios to MRC 5 cells infected with recombinant CMV expressing the reporter protein mNeonGreen. ARMATA measures the expression of mNeonGreen using live cell imaging. (A) Representative microscopic images 48 hours after infection showing the expression of mNeonGreen (fluorescence image) and the location of the cells in corresponding brightfield images in CMV-infected MRC-5 cells in the absence of added T cells (w/o T cells), in the presence of EV-transduced mTCR 5–2+ CD8+ T cells (T cells + TCR 5–2 +EV) or in the presence of TBKBP1-overexpressing mTCR 5–2+ CD8+ T cells (T cells + TCR 5–2 +TBKBP1). T cells were added at a E:T ratio of 1:1. (B) The ARMATA was quantified by hourly measurements of the reporter signal in cultures in the absence of added T cells (w/o T cells, green curve), in the presence of EV-transduced mTCR 5–2+ CD8+ T cells (T cells + TCR 5–2 +EV, blue curve) or in the presence of TBKBP1-overexpressing mTCR 5–2+ CD8+ T cells (T cells + TCR 5–2 +TBKBP1, red curve). (Left) The graph depicts mean values±SD from 2 technical replicates of 1 representative out of 3 independent experiments. (Right) The line plots summarize data from 3 independent experiments by showing the average area under the curve (AUC) ±95% CI for EV-transduced or TBKBP1-overexpressing mTCR 5–2+ CD8+ T cells cultured with CMV-infected MRC-5 at indicated E:T ratios. (C) 36 hours after infection, culture supernatants were harvested and cytokine profiles were determined from cultures of CMV-infected MRC-5 cells in the absence of added T cells (w/o T cells), in the presence of EV-transduced mTCR 5–2+ CD8+ T cells (T cells + EV, E:T = 1:1) or in the presence of TBKBP1-overexpressing mTCR 5–2+ CD8+ T cells (T cells + TBKBP1, E:T = 1:1). Data from 3 independent experiments with 2 technical replicates each are shown. Symbols indicate samples from the same donor. For statistical analyses, a paired two-tailed student’s t test (leaving out “w/o T cell” group) was conducted with *, p ≤ 0.05 and **, p ≤ 0.01.

Similar articles

References

    1. Picarda G, Benedict CA. Cytomegalovirus: shape-shifting the immune system. J Immunol. 2018;200(12):3881–9. doi: 10.4049/jimmunol.1800171 - DOI - PMC - PubMed
    1. Takenaka K, Nishida T, Asano-Mori Y, Oshima K, Ohashi K, Mori T, et al.. Cytomegalovirus reactivation after allogeneic hematopoietic stem cell transplantation is associated with a reduced risk of relapse in patients with acute myeloid leukemia who survived to day 100 after transplantation: the Japan Society for Hematopoietic Cell Transplantation Transplantation-related Complication working group. Biol Blood Marrow Transplant. 2015;21(11):2008–16. doi: 10.1016/j.bbmt.2015.07.019 - DOI - PubMed
    1. Teira P, Battiwalla M, Ramanathan M, Barrett AJ, Ahn KW, Chen M, et al.. Early cytomegalovirus reactivation remains associated with increased transplant-related mortality in the current era: a CIBMTR analysis. Blood. 2016;127(20):2427–38. doi: 10.1182/blood-2015-11-679639 - DOI - PMC - PubMed
    1. Lisboa LF, Kumar D, Wilson LE, Humar A. Clinical utility of cytomegalovirus cell-mediated immunity in transplant recipients with cytomegalovirus viremia. Transplantation. 2012;93(2):195–200. doi: 10.1097/TP.0b013e31823c1cd4 - DOI - PubMed
    1. Tischer S, Priesner C, Heuft HG, Goudeva L, Mende W, Barthold M, et al.. Rapid generation of clinical-grade antiviral T cells: selection of suitable T-cell donors and GMP-compliant manufacturing of antiviral T cells. J Transl Med. 2014;12:336. doi: 10.1186/s12967-014-0336-5 - DOI - PMC - PubMed

MeSH terms

Substances