. 2024 Sep 27;385(6716):eadk2536.
doi: 10.1126/science.adk2536. Epub 2024 Sep 27.

A host-adapted auxotrophic gut symbiont induces mucosal immunodeficiency

Affiliations

A host-adapted auxotrophic gut symbiont induces mucosal immunodeficiency

Qiuhe Lu et al. Science. .

Abstract

Harnessing the microbiome to benefit human health requires an initial step in determining the identity and function of causative microorganisms that affect specific host physiological functions. We show a functional screen of the bacterial microbiota from mice with low intestinal immunoglobulin A (IgA) levels; we identified a Gram-negative bacterium, proposed as Tomasiella immunophila, that induces and degrades IgA in the mouse intestine. Mice harboring T. immunophila are susceptible to infections and show poor mucosal repair. T. immunophila is auxotrophic for the bacterial cell wall amino sugar N-acetylmuramic acid. It delivers immunoglobulin-degrading proteases into outer membrane vesicles that preferentially degrade rodent antibodies with kappa but not lambda light chains. This work indicates a role for symbionts in immunodeficiency, which might be applicable to human disease.


Conflict of interest statement

Competing interests: T.S.S. is an advisor for Janssen, AbbVie, and Nxera. All other authors declare no competing interests.

Figures

Fig. 1.
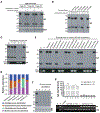
Fig. 1.. Functional screening of IgA-low mouse feces allows identification of a previously unreported IgA-degrading bacterium.
(A) to (C) and (E) and (F) Immunoblot analysis for IgA. (A) and (F) (Bottom) Ponceau S staining for BSA. (C), (E), and (G) (Bottom) PCR for Muribaculaceae sp. strain X (XP) and total bacteria (16S). (D) Relative abundance of family/genus 16S rRNA gene amplicon sequences from bacterial composition of colony #8. (G) (Top) Fecal IgA levels from IgA-high (n = 6) and IgA-low (n = 6) mice. H, heavy chain; L, light chain of IgA; N, negative control; P, positive control.
Fig. 2.
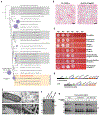
Fig. 2.. T. immunophila represents a previously uncharacterized genus and species within the Muribaculaceae family.
(A) Phylogenomic tree of T. immunophila, placed within the context of the family Muribaculaceae. All validly named species, as well as representatives from major metagenome-assembled genome–inferred genera from the genome taxonomy database (GTDB) (>10 genomes) are included to represent genera which have yet to be cultured. Purple circles are sized proportionally with the number of inferred species within each genus and are placed at the split in the tree for the genus or at the tip if only a single representative is included. (B) Representative Gram stain images of T. immunophila without (left) and with (right) MurNAc. Scale bars are 5 μm. (C) T. immunophila cultures were serially diluted and spotted on anaerobic blood agar plates containing the indicated additives. (D) Schematic to scale of predicted MurNAc transport and utilization gene loci in T. immunophila and T. forsythia 92A2. XthA, predicted Xanthan lyase; GT, protein with glycosyltransferase domains; DUF4922, protein with domain of function 4922; LytB, predicted amidase enhancer; AmpG, predicted muropeptide transporter; DUF1343, protein with domain of function 1343; FOXRED, FAD-dependent oxidoreductase domain-containing protein; MurT, putative MurNAc transporter; MurK, putative MurNAc kinase; MurQ, putative N-acetylmuramic acid 6-phosphate etherase. SIAE, putative sialate O-acetylesterase. Gene functions annotated from National Center for Biotechnology Information Reference Sequence Database (NCBI RefSeq) and protein-protein Basic Local Alignment Search Tool (BLASTp). (E) Representative transmission and scanning electron microscopy images of T. immunophila and its OMVs. Scale bars are 200 nm. (F) Mouse IgA incubated with T. immunophila culture, supernatant (Sup), OMVs, or OMV supernatant, followed by immunoblot analysis. N denotes IgA negative control. (G) Time course incubation of T. immunophila OMVs, either intact or disrupted by sonication or Tween 20, with IgA followed by immunoblot analysis.
Fig. 3.
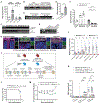
Fig. 3.. T. immunophila–mediated IgA degradation renders mice more susceptible to infection.
(A) and (B) Fecal IgA levels (A) and PCR detection of T. immunophila (Ti) and total fecal bacteria (16S) (B) in cohoused IgA-low (n = 4) and IgA-high mice (n = 6). (C) and (D) PCR detection of Ti and 16S (C) and fecal IgA levels (D) pre- and post-vancomycin treatment. (E) and (F) Fecal IgA levels (E) in mice gavaged with IgA-high fecal slurry, either without (control) or with Ti; PCR detection of Ti and 16S (F) pre- and postgavage. (G) PCR detection of Ti and total 16S along the intestinal tract of IgA-low mice. (H) FISH for localization of Ti in intestinal sections of IgA-low mice; scale bars are 15 μm. (I) IgA levels of luminal contents along the intestinal tract in IgA-high and IgA-low mice. (J) Workflow for Salmonella vaccination and infection. (K) Fecal IgA levels under specified conditions. (L) Survival curve of Salmonella vaccination/infection mouse model. (M) Colony-forming unit assay of fecal Salmonella in mice after vaccination. (A), (D), (E), (I), (K), (L), and (M). Error bars represent mean ± SEM and each dot represents an individual mouse. Statistical tests: one-way analysis of variance (ANOVA) with Tukey’s test (A), Mann-Whitney U-test (D) and (I), two-way ANOVA with Tukey’s test (E) and (K), log-rank test (L), and mixed-effects model with Tukey’s test (M). Statistical significance denoted as not significant (ns), **P < 0.01, ***P < 0.001, ****P < 0.0001.
Fig. 4.
Fig. 4.. Administration of T. immunophila induces the production of intestinal IgA specific to itself.
(A) Fecal IgA levels in mice gavaged with T. immunophila (Ti) compared with PBS controls. (B) and (C) Heat-killed Ti and (D) several bacterial species (Bt, Bacteroides thetaiotaomicron; Bf, Bacteroides fragilis; Ef, Enterococcus faecalis; Mi, Muribaculum intestinale; and two Muribaculaceae species isolates (Ms1 and Ms2) from IgA-low mice (table S1) were incubated with monoclonal mouse IgA (Mono-IgA) or IgA from fecal pellets of PBS- or Ti-administered mice (in triplicate). Samples were analyzed by flow cytometry with anti-IgA-PE staining. (E) and (F) Realtime PCR determination of Ti copy number in fecal samples from WT or Rag1−/− (E) and WT or Pigr−/− mice (F) gavaged with IgA-low fecal slurry (E) or IgA-high fecal slurry plus Ti (F). Error bars show mean ± SEM (A), (C), (E), and (F); each dot represents an individual mouse (A), (E), and (F), Statistical tests: two-way ANOVA with Tukey’s test (A) and (C) or uncorrected Fisher LSD test (E), and Mann-Whitney U-test (F). Significance denoted as not significant (ns), *P < 0.05, ****P < 0.0001.
Fig. 5.
Fig. 5.. T. immunophila preferentially degrades mouse immunoglobulins with kappa light chains.
(A) Mouse antibody isotypes were incubated with T. immunophila (Ti) and analyzed by stain-free SDS-PAGE. The N-terminal sequences of IgG cleavage fragments (black arrows) were determined by Edman degradation. (B) Schematic representation of the mouse IgG heavy chain constant region (CH), showing the Ti-mediated cleavage site (magenta triangle). Partial amino acid sequences depicting Ti-mediated cleavage sites (magenta triangle) in the WT antibodies, with an additional cleavage site at K92 (cyan triangle) in the mouse IgG1 mutant (K95A/K96A). Numbers denote the positions of amino acid residues in the constant region of mouse IgG1. (C) Recombinant mouse IgG1 antibodies (WT, K95A/K96A, and K92A/K95A/K96A mutants) were incubated with Ti and analyzed by immunoblotting. (D) FL, F(ab′)2, and Fc fragments of mouse IgG were incubated with Ti and analyzed by stain-free SDS-PAGE. (E) Mouse IgG1, IgG2a, IgG2b, and IgG3 with κ or λ light chains were incubated with Ti and analyzed by stain-free SDS-PAGE. (F) Recombinant mouse IgG1 antibodies with κ, λ1, or λ2 light chains were incubated with Ti and analyzed by stain-free SDS-PAGE. (G) Mouse IgM with κ or λ light chains was incubated with Ti and analyzed by stain-free SDS-PAGE. (H) Mouse serum incubated with Ti and analyzed by immunoblotting for IgG, IgA, IgM, light chains (κ, λ), and albumin. (I) Fecal slurry from IgA-high mice incubated with Ti cultures or OMVs under different culture conditions. The levels of proteins were determined by immunoblotting. (A, C, E, F, and G), H, heavy; L, light chain IgA. (A), (D), (E), and (F). Black arrows denote cleaved fragments. All SDS-PAGE and immunoblots shown are representative of two to three independent experiments.
Fig. 6.
Fig. 6.. Light chains determine species-specific immunoglobulin cleavage by T. immunophila.
(A) IgG/Y from various species were incubated with T. immunophila (Ti) and analyzed by stain-free SDS-PAGE. (B) Hamster IgG1 and IgG2 antibodies with κ or λ1 light chains were incubated with Ti and analyzed by stain-free SDS-PAGE. (C) Human antibody isotypes and subclasses were incubated with Ti and analyzed by stain-free SDS-PAGE. Mouse IgG1 (mIgG1) is a positive control. (D and E) Recombinant chimeric IgG antibodies, including mouse heavy chain with mouse (m-κ) or human κ light (h-κ) chains and human heavy chain with human or mouse κ light chains, were incubated with Ti and analyzed by immunoblotting. H, heavy; L, light chains of immunoglobulins; C, cleaved fragments. (A), (B), and (C) Black arrows indicate cleaved fragments. All SDS-PAGE and immunoblots shown are representative of two to three independent experiments.

Comment in

References

    1. Gilbert JA et al. , Current understanding of the human microbiome. Nat. Med 24, 392–400 (2018). doi: 10.1038/nm.4517 - DOI - PMC - PubMed
    1. Wensel CR, Pluznick JL, Salzberg SL, Sears CL, Next-generation sequencing: Insights to advance clinical investigations of the microbiome. J. Clin. Invest 132, e154944 (2022). doi: 10.1172/JCI154944 - DOI - PMC - PubMed
    1. Hitch TCA et al. , Recent advances in culture-based gut microbiome research. Int. J. Med. Microbiol 311, 151485 (2021). doi: 10.1016/j.ijmm.2021.151485 - DOI - PubMed
    1. Lu Q, Stappenbeck TS, Local barriers configure systemic communications between the host and microbiota. Science 376, 950–955 (2022). doi: 10.1126/science.abo2366 - DOI - PubMed
    1. Yu JSL et al. , Microbial communities form rich extracellular metabolomes that foster metabolic interactions and promote drug tolerance. Nat. Microbiol 7, 542–555 (2022). doi: 10.1038/s41564-022-01072-5 - DOI - PMC - PubMed

Publication types

Substances

LinkOut - more resources