. 2024 Sep 6;15(6):2828-2851.
doi: 10.14336/AD.2024.0241.

NAD+ Metabolism and Mitochondrial Activity in the Aged Oocyte: Focus on the Effects of NAMPT Stimulation

Affiliations

NAD+ Metabolism and Mitochondrial Activity in the Aged Oocyte: Focus on the Effects of NAMPT Stimulation

Giovanna Di Emidio et al. Aging Dis. .

Abstract

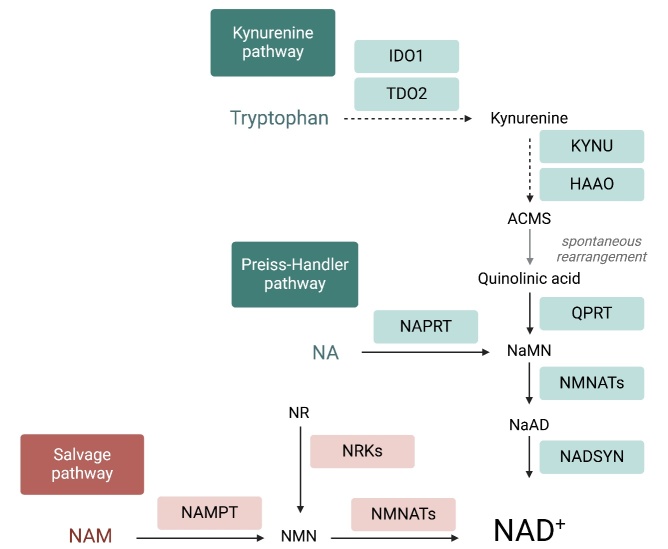
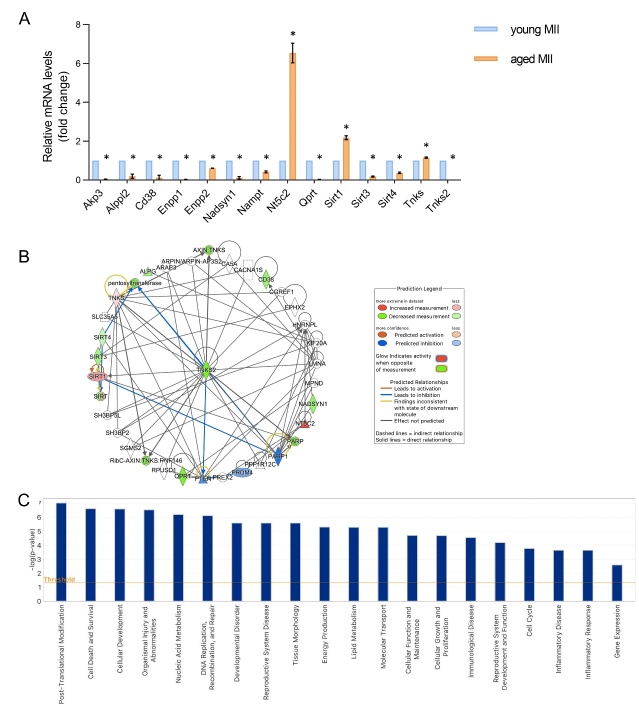
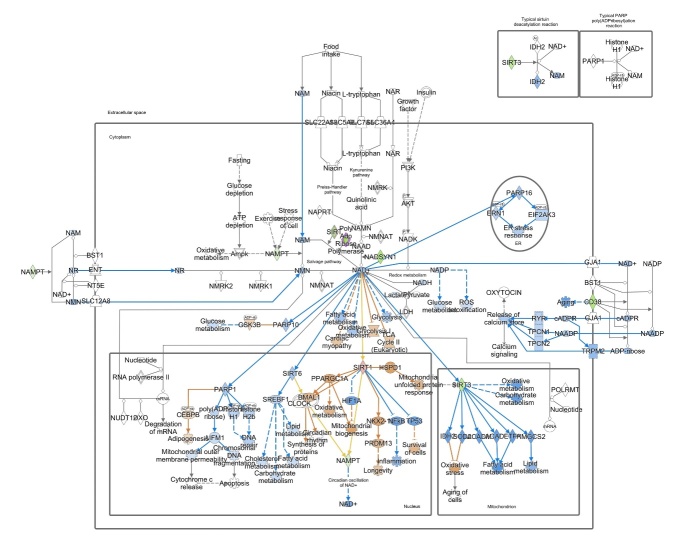
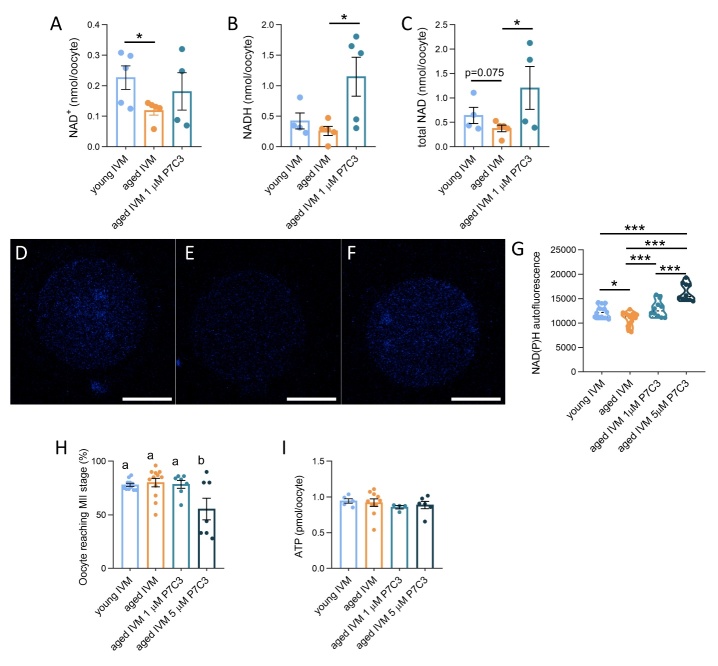
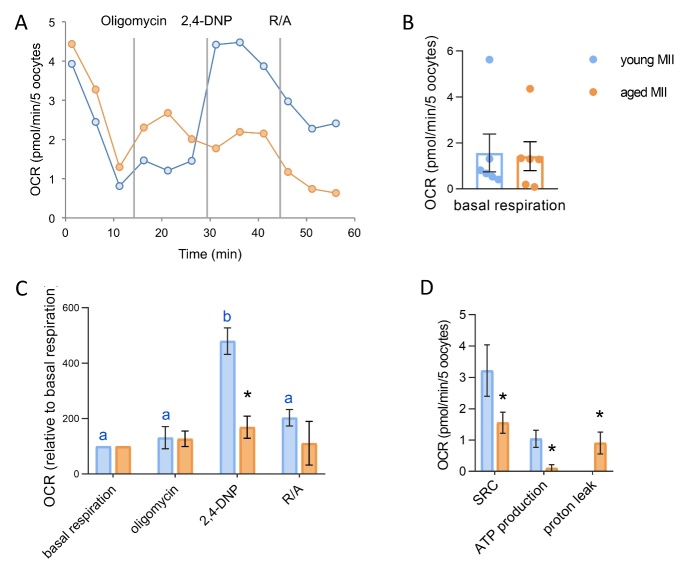
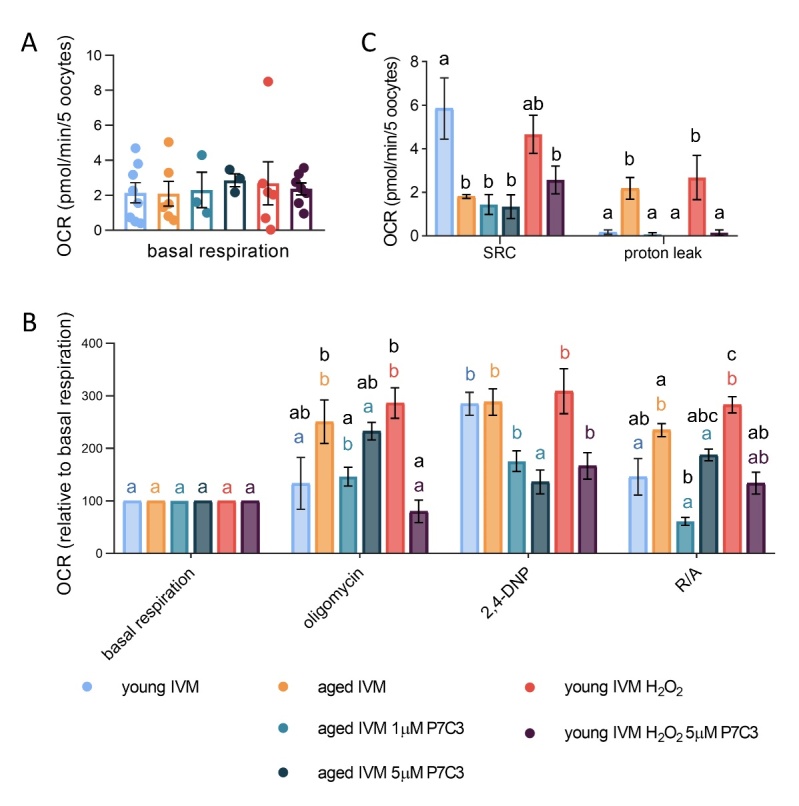
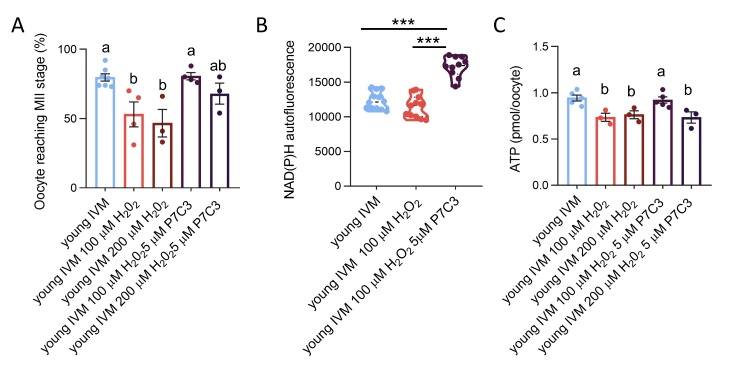
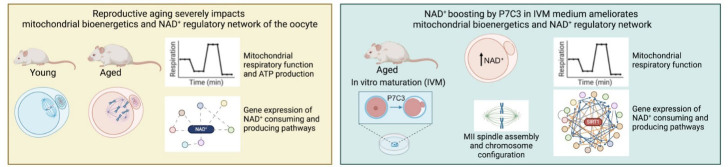
The ovary experiences an age-dependent decline starting during the fourth decade of life. Ovarian aging is the predominant factor driving female reproductive aging. Modern trend to postpone childbearing age contributes to reduced fertility and natality worldwide. Recently, the beneficial role of NAD+ precursors on the maintenance of oocyte competence and female fertility affected by aging has emerged. Nevertheless, age-related changes in NAD+ regulatory network have not been investigated so far. In this context, our goal was to investigate changes induced by the aging process in the expression level of genes participating in NAD+ biosynthetic and NAD+ consuming pathways and in the cellular bioenergetics in the mouse oocyte. From Ingenuity Pathway Analysis (IPA) it emerged that aging caused the downregulation of all cellular pathways for NAD+ synthesis (Kynurenine pathway, Preiss-Handler pathway and NAD+ salvage pathway) and deeply influenced the activity of NAD+-dependent enzymes, i.e. PARPs and SIRTs, with effects on many cellular functions including compromised ROS detoxification. Considering that NAMPT, the rate-limiting enzyme of NAD+ salvage pathway, was deregulated, aged oocytes were matured in the presence of P7C3, NAMPT activator. P7C3 improved spindle assembly and mitochondrial bioenergetics and reduced mitochondrial proton leak. Moreover, P7C3 influenced gene expression of NAD+ regulatory network, with Sirt1 as the central node of IPA-interfered target gene network. Finally, P7C3 effectively counteracted oocyte alterations induced by exposure to oxidative stress. Our study contributes to establish effective NAD+ boosting interventions to alleviate the effects of advanced maternal age on fertility and explore their potential in redox-related fertility disorders.


Conflict of interest statement

The authors declare that they have no competing interests.

Figures

Figure 1.
Figure 1.
Intracellular pathways of NAD+ production. Mammalian cells can synthesize NAD+ de novo from tryptophan by the kynurenine pathway or from NA by the Preiss-Handler pathway, while most NAD+ is recycled via salvage pathways by NAMPT from NAM, a by-production of NAD+-consuming reactions. Abbreviations: ACMS: α-amino-β-carboxymuconate-ε-semialdehyde; HAAO, 3-Hydroxyanthranilic Acid Dioxygenase; IDOs, indoleamine 2,3-dioxygenase; KYNU, Kynureninase; NA, nicotinic acid; NaAD, Nicotinic acid adenine dinucleotide; NADKs, NAD+ kinases; NADSYN, NAD synthase; NAM, nicotinamide; NaMN,nicotinate mononucleotide; NAPRT, nicotinic acid phosphoribosyltransferase; NMN, nicotinamide mononucleotide; NMNATs, nicotinamide mononucleotide adenylyl transferases; NR, nicotinamide riboside; NRK, Nicotinamide Riboside Kinase; QPRT, quinolinate phosphoribosyl-transferase; TDO, tryptophan 2,3-dioxygenase. The image was generated by Biorender.
Figure 2.
Figure 2.
Representative images of MII spindle and chromosome configuration in oocytes showing polar body after IVM. Meiotic spindle was labeled by mouse anti -tubulin primary antibody and secondary antibody conjugated with DyLight® 594 (red); chromosomes were stained by Hoechst 33342 (blue). Oocytes were classified as normal (A), slightly aberrant (D) or aberrant (G). Spindle was classified as normal (B), slightly aberrant (E), or aberrant (H). Chromosomes were classified as normal (C), slightly aberrant (F), or aberrant (I). Scale bars: 20 μm.
Figure 3.
Figure 3.
Differentially expressed genes involved in NAD+ metabolism in young and aged MII oocytes and Ingenuity pathway analysis (IPA)-generated functional analysis. (A) Histograms of significant mean fold change values for all differentially expressed genes in physiological aged oocytes compared to young controls. Pools of 25 oocytes isolated from 3-6 mice were employed. The experiment was repeated three times. Statistical analysis by paired t-test: *p<0.05. (B) IPA-interfered target gene network for NAD+ metabolism of physiologically aged MII oocytes compared to controls. Tnks2 gene is the central node of IPA-interfered target gene network for NAD+ metabolism of physiologically aged oocytes in comparison to young oocytes. In red the up-regulated genes, while in green the down-regulated ones. Blue arrow lines indicate a predicted inhibition. (C) The bar-chart is generated based on a -log (p-value) threshold of 0.05 and indicates the main significant biological functions regulated by our gene dataset in aged oocytes.
Figure 4.
Figure 4.
Schematic depiction of the NAD+ biosynthetic pathways with genes significantly down regulated in aged oocytes. In green are indicated products genes significantly down regulated in aged oocytes in comparison to young oocytes. In blue are indicated products that are predicted to be reduced as a consequence of reduced enzymatic activity. The canonical pathways were analyzed using QIAGEN’s Ingenuity Pathway Analysis (IPA; QIAGEN Inc., www.qiagenbioinformatics.com/products/ingenuity-pathway-analysis). Differentially expressed genes in aged oocytes were subjected to IPA analysis, and significant canonical pathways were identified at p<0.05. The above-identified pathways demonstrate that genes differentially expressed with aging influence NAD+ biosynthesis leading to a reduction of NAD+ availability.
Figure 5.
Figure 5.
NAD+-related metabolic pathways influenced by oocyte aging generated by Ingenuity pathway analysis (IPA) analysis. Signaling pathway diagram highlighting the effects of aging on NAD+ metabolism in the mouse MII oocyte. At nucleus level the observed increased level of SIRT1 is connected with predicted increased longevity, reduced inflammation and increased survival, activation of protein unfolded response. It is also predicted the activation of PPARGC1A leading to increased mitochondrial biogenesis; the inhibition of SIRT6 with negative effects on metabolism; the inhibition of PARP1 on DNA repair and mitochondrial integrity. At cytoplasmic level, the observed NAMPT decrease leads to predictive reduction of metabolites and NAD+. Predicted decreased NAD+ reduction leads to predictive reduction of PARPs and SIRTs in other compartments. Decreased oxidative metabolism and ROS detoxification are also predicted. At mitochondrial level it is observed a decreased activation of SIRT3, while it is predicted the inhibition of oxidative metabolism and carbohydrate metabolism and the activation of oxidative stress, reduced fatty acid metabolism and lipid metabolism. This network was derived from QIAGEN’s Ingenuity Pathway Analysis (IPA; QIAGEN Inc., www.qiagenbioinformatics.com/products/ingenuity-pathway-analysis). NADD: nicotinic acid adenine dinucleotide; NAADP: nicotinic acid adenine dinucleotide phosphate; NAD: nicotinamide adenine dinucleotide; NADP: nicotinamide adenine dinucleotide phosphate; NAM: niacinamide/nicotinamide; NAMN: nicotinic acid d-ribonucleotide; NAR: nicotinic acid d-ribonucleoside; NMN: nicotinamide mononucleotide; NR: nicotinamide ribonucleoside.
Figure 6.
Figure 6.
Effect of NAMPT stimulation by P7C3 on NAD content, IVM rate, ATP production of aged oocytes. (A) Bioluminescent quantification of NAD+ in young, aged and aged oocytes exposed to NAMPT stimulation by P7C3 during IVM. In brackets numbers of pools: young (n=5); aged (n=5); aged 1 µM P7C3 (n=4). Pools of at least 25 oocytes collected from 3-6 mice were employed. Statistical analysis by Mann-Whitney test. *p=0.0476. (B) Bioluminescent quantification of NADH in young, aged and aged oocytes exposed to NAMPT stimulation by P7C3 during IVM. In brackets numbers of pools: young (n=4); aged (n=5); aged 1 µM P7C3 (n=5). Pools of at least 25 oocytes collected from 3-6 mice were employed. Statistical analysis by unpaired t-test *p=0.0263. (C) Bioluminescent quantification of total NAD in young, aged and aged oocytes exposed to NAMPT stimulation by P7C3 during IVM. In brackets numbers of pools: young (n=4); aged (n=5); aged 1 µM P7C3 (n=4). Pools of at least 25 oocytes collected from 3-6 mice were employed. Statistical analysis by unpaired t-test *p=0.0365. Representative confocal images of autofluorescence to determine NAD(P)H content in young (D), aged (E) or aged P7C3 (F) IVM oocytes. Scale bars: 30 μm (G) Quantification of NAD(P)H autofluorescence in from young, aged and aged oocytes exposed to two different concentrations of NAMPT stimulation by P7C3 during IVM. 10-20 oocytes isolated from 3-6 animals were analyzed. The experiment was repeated three times. Statistical analysis by one-way ANOVA: p<0.001; followed by Tukey’s multiple comparisons test: *p<0.05; ***p<0.001. (H) Effect of aging and NAMPT stimulation by P7C3 on oocyte ability to reach the MII stage after IVM. IVM was performed in pools of at least 15 oocytes from 3-6 mice in each experimental group. In brackets numbers of pools: young (n=11); aged (n=12); aged 1 µM P7C3 (n=7); aged 5 µM P7C3 (n=7). Statistical analysis by one-way ANOVA: p=0.006; followed by Tukey’s multiple comparisons test: *p<0.05; ***p<0.001. Different letters indicate p<0.05. (I) Effect of aging and NAMPT stimulation by P7C3 on ATP production in IVM oocytes. Pools of 5-8 oocytes from 3-6 mice were measured. In brackets numbers of pools: young (n=5); aged (n=10); aged 1 µM P7C3 (n=4); aged 5 µM P7C3 (n=6). Statistical analysis by Kruskal-Wallis test: not significant.
Figure 7.
Figure 7.
Bioenergetic profile of young and aged MII oocytes. (A) Representative profile of live measurements of changes OCR of young and aged MII oocytes upon injection of mitochondrial inhibitors. (B) Basal respiration (mean of third measure) of young and aged MII oocytes. Pools of 5-8 oocytes from 3-6 mice were measured. In brackets numbers of pools: young (n=6); aged (n=6). Statistical analysis by Mann Whitney test: not significant. (C) Mean values of OCR after oligomycin, 2,4-DNP and R/A of young and aged MII oocytes. Pools of 5-8 oocytes from 3-6 mice were measured. In brackets numbers of pools: young (n=6); aged (n=6). Oocyte response to addition of mitochondrial inhibitors was analyzed by one way ANOVA, followed by Student-Newman-Keuls multiple comparison. Different letters indicate a p<0.05 in young MII oocytes (blue). No differences were found in aged oocytes. *p<0.05 indicates differences in OCR between young and aged MII oocytes after unpaired t-test analysis. (D) Spare respiratory capacity (SRC), ATP production and proton leak obtained from live measurements of OCR. Statistical analysis by unpaired t-test *p<0.05 for SRC; or by Mann Whitney test *p<0.05 for ATP production and proton leak.
Figure 8.
Figure 8.
Effect of NAMPT stimulation by P7C3 on bioenergetic profile of aged oocytes or young oocytes exposed to oxidative stress. (A) Basal respiration (mean of third measure) of young IVM oocytes, aged IVM oocytes, aged oocytes exposed to 1 or 5 µM P7C3 during IVM, young oocytes stressed with H2O2 or exposed to P7C3 after stress with H2O2. Pools of 5-8 oocytes from 3-6 mice were measured. In brackets numbers of pools: young (n=8); aged (n=6); aged 1 µM P7C3 (n=3); aged 5 µM P7C3 (n=3); young H2O2 (n=6); young H2O2 5 µM P7C3 (n=7). Statistical analysis by one-way ANOVA: not significant. (B) Bioenergetic profile of aged and young stressed oocytes and effect of NAMPT stimulation by P7C3. Mean values of OCR after oligomycin, 2,4-DNP and R/A of young IVM oocytes, aged IVM oocytes, aged oocytes exposed to 1 or 5 µM P7C3 during IVM, young oocytes stressed with H2O2 or exposed to P7C3 after stress with H2O2. Pools of 5-8 oocytes from 3-6 mice were measured. In brackets numbers of pools: young (n=8); aged (n=6); aged 1 µM P7C3 (n=3); aged 5 µM P7C3 (n=3); young H2O2 (n=6); young H2O2 5 µM P7C3 (n=7). Oocyte response to addition of mitochondrial inhibitors was analyzed by one-way ANOVA, followed by Student-Newman-Keuls multiple comparison. Different letters indicate a p<0.05 in young (blue); aged (orange); aged 1 µM P7C3 (pale green); aged 5 µM P7C3 (green); young H2O2 (red); young H2O2 5 µM P7C3 (purple) IVM oocytes. Differences in response to mitochondrial inhibitors among experimental groups were analyzed by one-way ANOVA, followed by Student-Newman-Keuls multiple comparison. Different letters (black) indicate a p <0.05. (C) Spare respiratory capacity (SRC) and proton leak obtained from live measurements of OCR. Statistical analysis by one-way ANOVA (p=0.0093) followed by Student-Newman-Keuls multiple comparison for SRC; or by Kruskal Wallis test (p=0.0075) followed by uncorrected Dunn’s test for multiple comparisons of proton leak. Different letters (black) indicate a p<0.05.
Figure 9.
Figure 9.
Effect of NAMPT stimulation by P7C3 on IVM rate, NAD content and ATP production of young oocytes exposed to oxidative stress. (A) Effect of exposure to oxidative stress and NAMPT stimulation by P7C3 on oocyte ability to reach the MII stage after IVM. IVM was performed in pools of at least 20 oocytes in each experimental group, isolated from 3-6 mice. In brackets numbers of pools: young (n=7); young 100 µM H2O2 (n=4); young 200 µM H2O2 (n=3); young 100 µM H2O2 5 µM P7C3 (n=4); young 200 µM H2O2 5 µM P7C3 (n=3). Statistical analysis by one-way ANOVA: p=0.0023 followed by Tukey’s multiple comparisons test. Different letters indicate p<0.05. (B) Quantification of NAD(P)H autofluorescence in from young, exposed to oxidative stress prior to IVM and matured in the presence or absence of NAMPT stimulation by P7C3. 10-20 oocytes isolated from 3-6 animals were analyzed. The experiment was repeated three times. Statistical analysis by one-way ANOVA: p<0.001; followed by Tukey’s multiple comparisons test: ***p<0.001. (C) Effect of exposure to oxidative stress and NAMPT stimulation by P7C3 on ATP production in IVM oocytes. Pools of 5 oocytes were measured. In brackets numbers of pools: young (n=5); young 100 µM H2O2 (n=3); young 200 µM H2O2 (n=3); young 100 µM H2O2 5 µM P7C3 (n=5); young 200 µM H2O2 5 µM P7C3 (n=3). Statistical analysis by one-way ANOVA p=0.003, followed by Tukey’s multiple comparisons test. Different letters indicate p<0.05.
Figure 10.
Figure 10.
Differentially expressed genes involved in NAD+ metabolism in aged oocytes exposed to NAMPT stimulation by P7C3 during IVM and Ingenuity pathway analysis (IPA)-generated functional analysis. (A) Histograms of significant mean fold change values for all differentially expressed genes in aged oocytes exposed to P7C3 compared to controls. Pools of 25 oocytes isolated from 3-6 mice were employed. The experiment was repeated three times. Statistical analysis by paired t-test: *p<0.05. (B) The bar-chart is generated based on a -log(p-value) threshold of 0.05 and indicates the main significant biological functions regulated by our gene dataset in aged oocytes exposed to P7C3.
Figure 11.
Figure 11.
Sirtuins are the central node of IPA-interfered target gene network. (A) IPA-interfered target gene network for NAD+ metabolism of aged oocytes exposed to 1 µM P7C3 during IVM revealed that Sirt1 gene is the central node of IPA-interfered target gene network. In red the up-regulated genes, while in green the down-regulated ones. Blue arrow lines indicate a predicted inhibition, while orange arrow lines a predicted activation. (B) IPA-generated Sirtuin 1 Signaling Pathway: in this panel the main responses mediated by sirtuins under the action of P7C3 are depicted. In the nucleus there is a reduction of oxidative stress, apoptosis, improvement of DNA repair, epigenetic regulation through heterochromatin formation. In the mitochondria it is predicted increased ROS detoxification and mild reduction of ATP reduced ROS accumulation.
Figure 12.
Figure 12.
Effect of aging and NAMPT stimulation by P7C3 on the protein level of NAMPT and SIRT1, key NAD+ producing and consuming enzymes. Representative confocal images of NAMPT in young (A), aged (B) or aged P7C3 (C) IVM oocytes. Scale bars: 30 μm. (D) Quantification of fluorescence intensity of NAMPT in young, aged or aged P7C3 IVM oocytes. 10-20 oocytes isolated from 3-6 animals were analyzed. The experiment was repeated three times. Statistical analysis by one-way ANOVA: p<0.001; followed by Tukey’s multiple comparisons test: ***p<0.001. Representative confocal images of SIRT1 in young (E), aged (F) or aged P7C3 (G) IVM oocytes. Scale bars: 30 μm. (H) Quantification of fluorescence intensity of SIRT1 in young, aged or aged P7C3 IVM oocytes. 10-20 oocytes isolated from 3-6 animals were analyzed. The experiment was repeated three times. Statistical analysis by one-way ANOVA: p<0.001; followed by Tukey’s multiple comparisons test: ***p<0.001.
Figure 13.
Figure 13.
Graphical abstract reporting experimental design and main conclusions.

References

    1. Xiao W, Wang R-S, Handy DE, Loscalzo J (2018). NAD(H) and NADP(H) Redox Couples and Cellular Energy Metabolism. Antioxid Redox Signal, 28:251-272. - PMC - PubMed
    1. Kulikova VA, Gromyko DV, Nikiforov AA (2018). The Regulatory Role of NAD in Human and Animal Cells. Biochem Mosc, 83:800-812. - PubMed
    1. Olgun A (2009). Converting NADH to NAD+ by nicotinamide nucleotide transhydrogenase as a novel strategy against mitochondrial pathologies during aging. Biogerontology, 10:531-534. - PubMed
    1. Yang Y, Sauve AA (2016). NAD+ metabolism: Bioenergetics, signaling and manipulation for therapy. Biochim Biophys Acta, 1864:1787-1800. - PMC - PubMed
    1. Xie N, Zhang L, Gao W, Huang C, Huber PE, Zhou X, et al.. (2020). NAD+ metabolism: pathophysiologic mechanisms and therapeutic potential. Signal Transduct Target Ther, 5:227. - PMC - PubMed

Substances

LinkOut - more resources