

Changes in 10-Year Predicted Cardiovascular Disease Risk for a Multiethnic Semirural Population in South East Asia: Prospective Study
- PMID: 39326046
- PMCID: PMC11467610
- DOI: 10.2196/55261
Changes in 10-Year Predicted Cardiovascular Disease Risk for a Multiethnic Semirural Population in South East Asia: Prospective Study
Abstract
Background: Cardiovascular disease (CVD) risk factors tend to cluster and interact multiplicatively and have been incorporated into risk equations such as the Framingham risk score, which can reasonably predict CVD over short- and long-term periods. Beyond risk factor levels at a single time point, recent evidence demonstrated that risk trajectories are differentially related to CVD risk. However, factors associated with suboptimal control or unstable CVD risk trajectories are not yet established.
Objective: This study aims to examine factors associated with CVD risk trajectories in a semirural, multiethnic community-dwelling population.
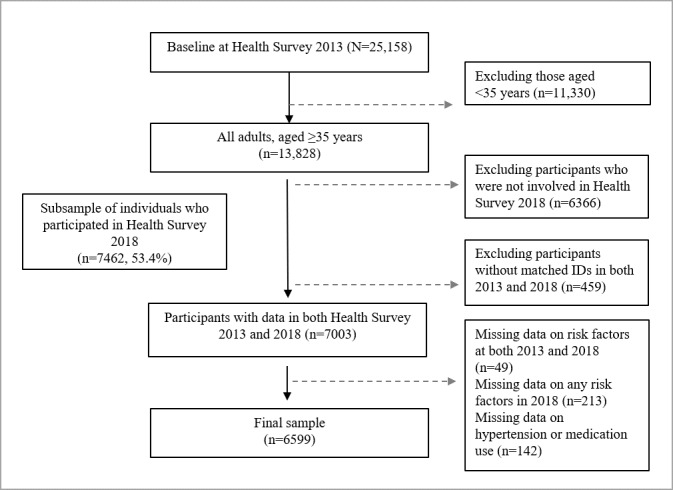
Methods: Data on demographic, socioeconomic, lifestyle, mental health, and cardiovascular factors were measured at baseline (2013) and during follow-up (2018) of the South East Asia Community Observatory cohort. The 10-year CVD risk change transition was computed. The trajectory patterns identified were improved; remained unchanged in low, moderate, or high CVD risk clusters; and worsened CVD risk trajectories. Multivariable regression analyses were used to examine the association between risk factors and changes in Framingham risk score and predicted CVD risk trajectory patterns with adjustments for concurrent risk factors.
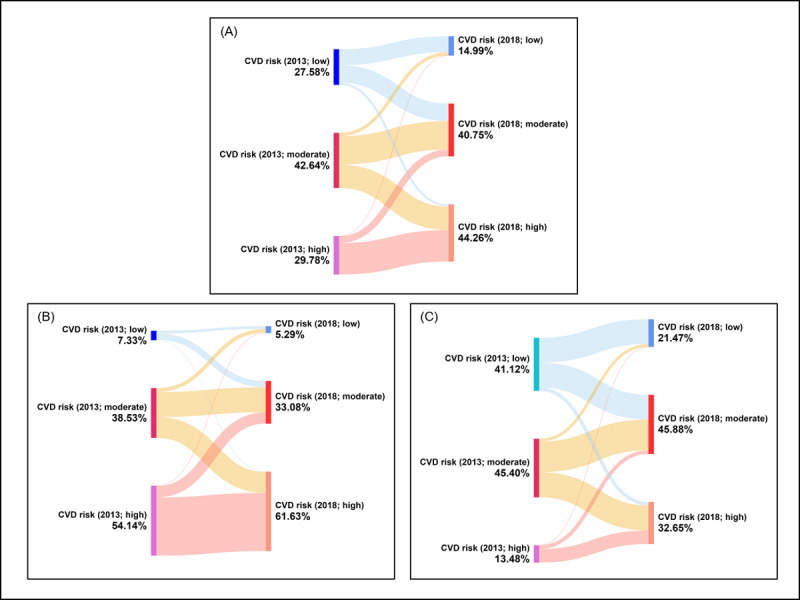
Results: Of the 6599 multiethnic community-dwelling individuals (n=3954, 59.92% female participants and n=2645, 40.08% male participants; mean age 55.3, SD 10.6 years), CVD risk increased over time in 33.37% (n=2202) of the sample population, while 24.38% (n=1609 remained in the high-risk trajectory pattern, which was reflected by the increased prevalence of all major CVD risk factors over the 5-year follow-up. Meanwhile, sex-specific prevalence data indicate that 21.44% (n=567) of male and 41.35% (n=1635) of female participants experienced an increase in CVD risk. However, a stark sex difference was observed in those remaining in the high CVD risk cluster, with 45.1% (n=1193) male participants and 10.52% (n=416) female participants. Regarding specific CVD risk factors, male participants exhibited a higher percentage increase in the prevalence of hypertension, antihypertensive medication use, smoking, and obesity, while female participants showed a higher prevalence of diabetes. Further regression analyses identified that Malay compared to Chinese (P<.001) and Indian (P=.04) ethnicity, nonmarried status (P<.001), full-time employment (P<.001), and depressive symptoms (P=.04) were all significantly associated with increased CVD risk scores. In addition, lower educational levels and frequently having meals from outside were significantly associated to higher odds of both worsening and remaining in high CVD risk trajectories.
Conclusions: Sociodemographics and mental health were found to be differently associated with CVD risk trajectories, warranting future research to disentangle the role of psychosocial disparities in CVD. Our findings carry public health implications, suggesting that the rise in major risk factors along with psychosocial disparities could potentially elevate CVD risk among individuals in underserved settings. More prevention efforts that continuously monitor CVD risk and consider changes in risk factors among vulnerable populations should be emphasized.
Keywords: Framingham risk score; cardiovascular risk trajectory; low- and middle-income countries; population-based study.
©Hamimatunnisa Johar, Chiew Way Ang, Roshidi Ismail, Zaid Kassim, Tin Tin Su. Originally published in JMIR Public Health and Surveillance (https://publichealth.jmir.org), 26.09.2024.
Conflict of interest statement
Conflicts of Interest: None declared.
Figures

References
-
- Vardell Emily. Global Health Observatory Data Repository. Med Ref Serv Q. 2020;39(1):67–74. doi: 10.1080/02763869.2019.1693231. https://www.tandfonline.com/doi/abs/10.1080/02763869.2019.1693231 - DOI - PubMed
-
- Statistics on causes of death, Malaysia, 2022. Department of Statistics Malaysia. 2022. Oct 27, [2024-09-03]. https://www.dosm.gov.my/portal-main/release-content/statistics-on-causes... .
-
- The direct health-care cost of noncommunicable diseases in Malaysia. Ministry of Health Malaysia. 2022. [2024-09-03]. https://www.moh.gov.my/moh/resources/Penerbitan/Rujukan/NCD/NCD_Laporan/... .
-
- Regional action framework for noncommunicable disease prevention and control in the Western Pacific. World Health Organization. 2023. Jun 22, [2024-09-11]. https://www.who.int/publications/i/item/9789290620044 .
MeSH terms
LinkOut - more resources
Full Text Sources
