. 2024 Oct 15;5(10):101747.
doi: 10.1016/j.xcrm.2024.101747. Epub 2024 Sep 25.

A PD-1-targeted, receptor-masked IL-2 immunocytokine that engages IL-2Rα strengthens T cell-mediated anti-tumor therapies

Affiliations

A PD-1-targeted, receptor-masked IL-2 immunocytokine that engages IL-2Rα strengthens T cell-mediated anti-tumor therapies

Jiaxi Wu et al. Cell Rep Med. .

Abstract

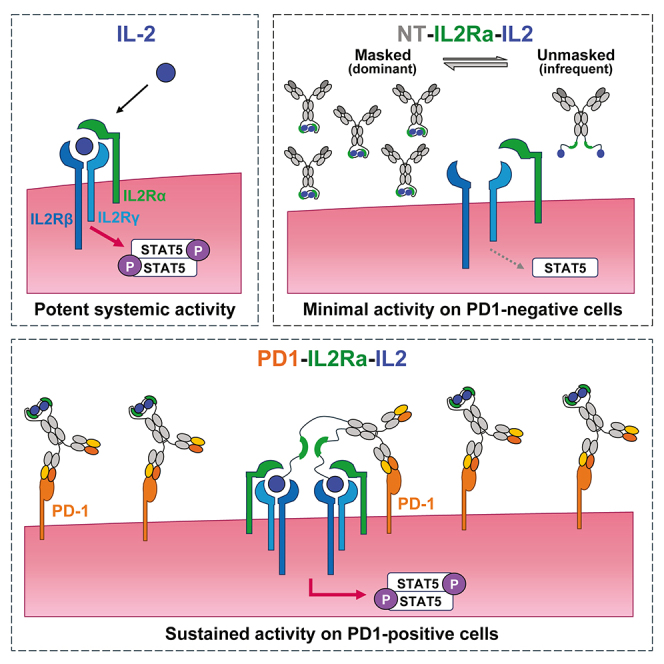
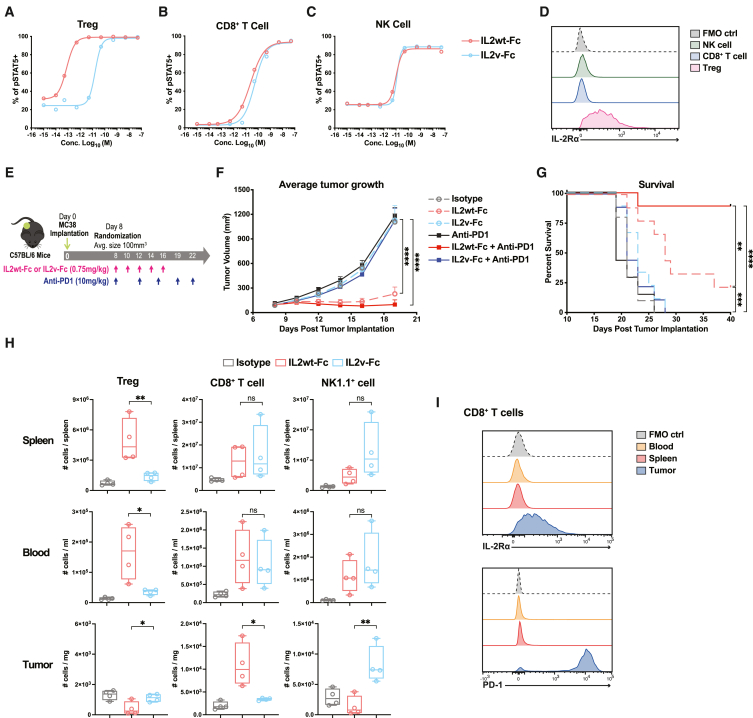
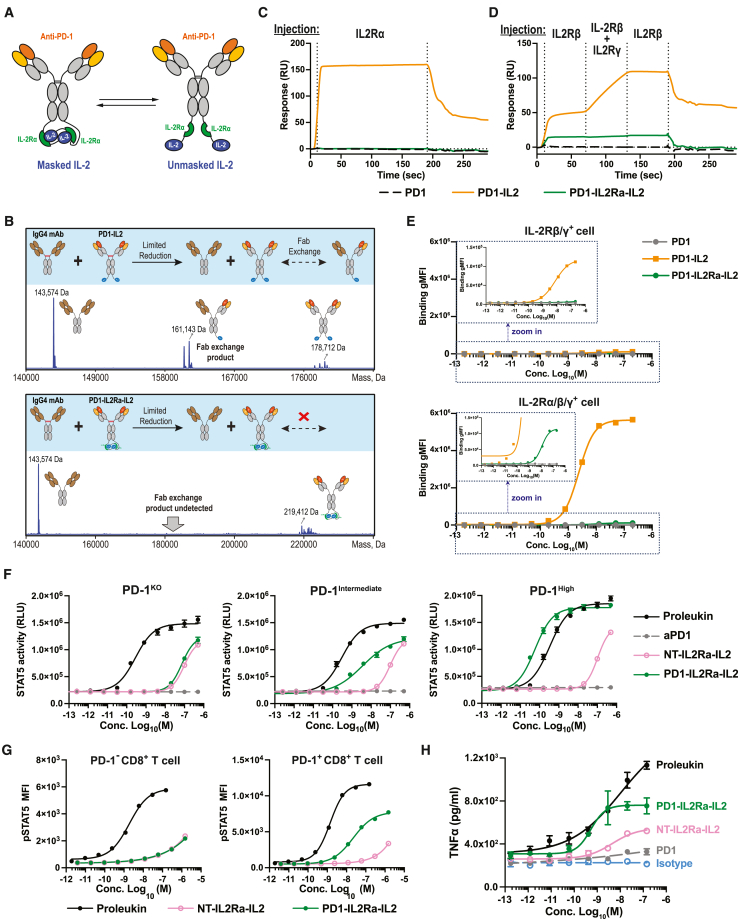
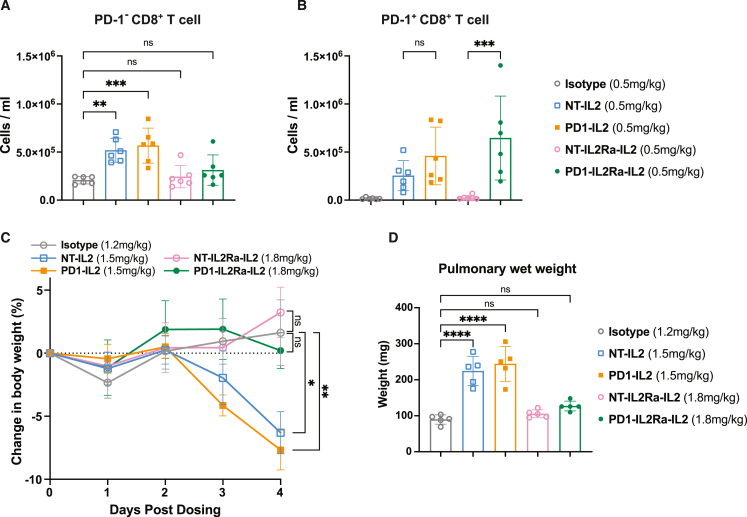
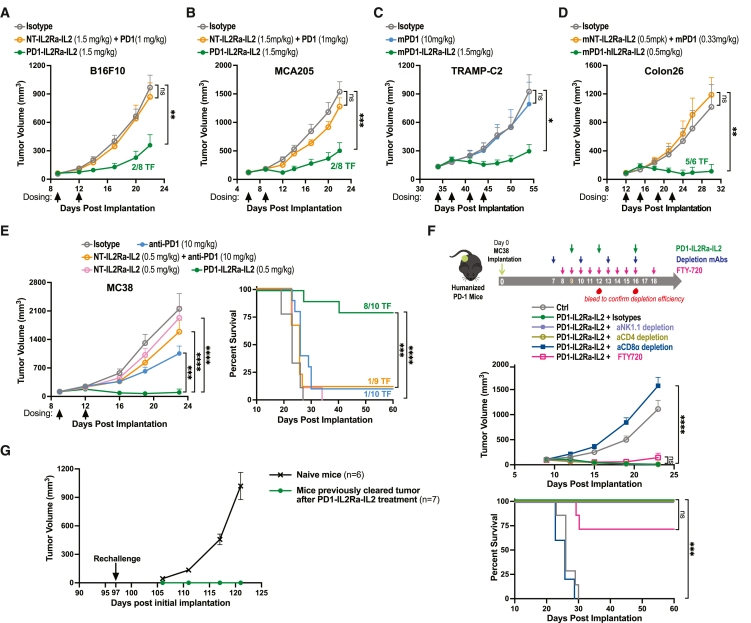
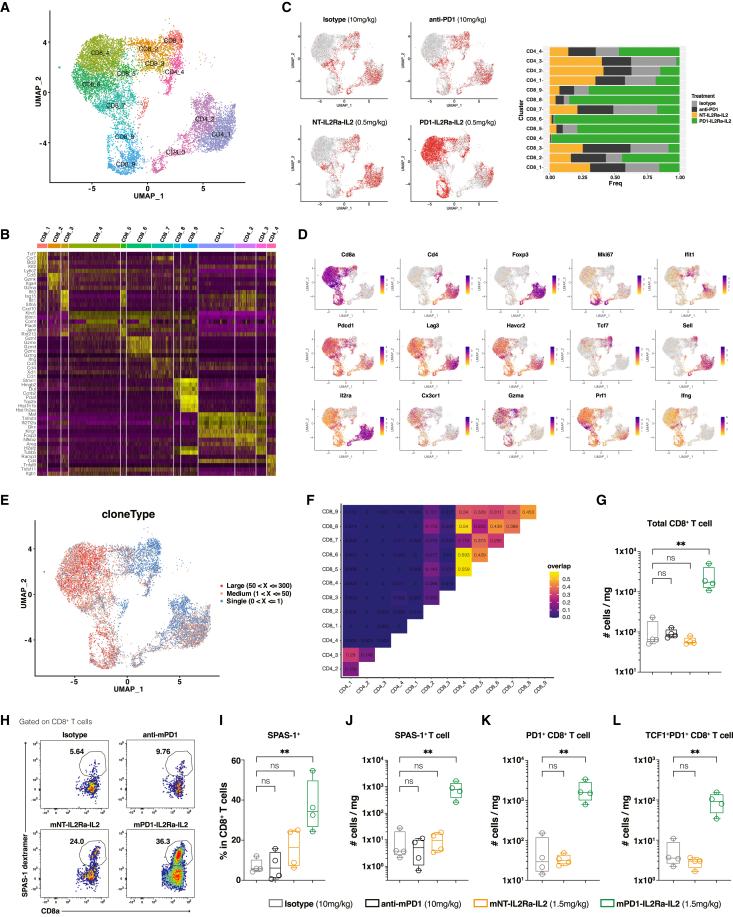
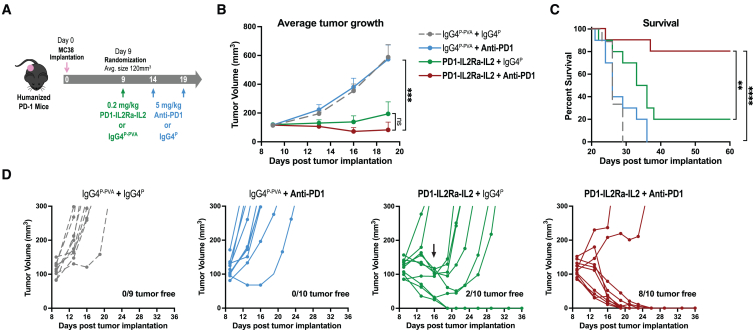
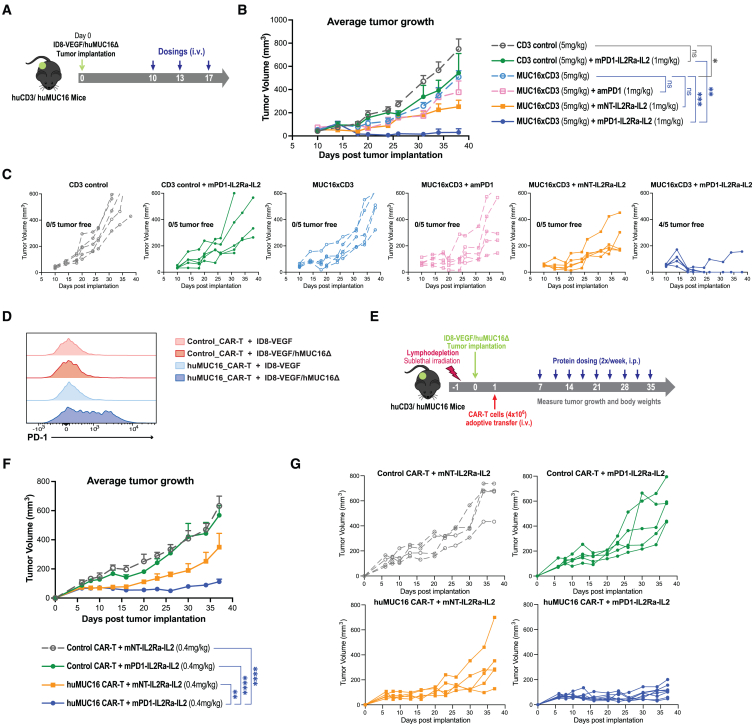
The clinical use of interleukin-2 (IL-2) for cancer immunotherapy is limited by severe toxicity. Emerging IL-2 therapies with reduced IL-2 receptor alpha (IL-2Rα) binding aim to mitigate toxicity and regulatory T cell (Treg) expansion but have had limited clinical success. Here, we show that IL-2Rα engagement is critical for the anti-tumor activity of systemic IL-2 therapy. A "non-α" IL-2 mutein induces systemic expansion of CD8+ T cells and natural killer (NK) cells over Tregs but exhibits limited anti-tumor efficacy. We develop a programmed cell death protein 1 (PD-1)-targeted, receptor-masked IL-2 immunocytokine, PD1-IL2Ra-IL2, which attenuates systemic IL-2 activity while maintaining the capacity to engage IL-2Rα on PD-1+ T cells. Mice treated with PD1-IL2Ra-IL2 show no systemic toxicities observed with unmasked IL-2 treatment yet achieve robust tumor growth control. Furthermore, PD1-IL2Ra-IL2 can be effectively combined with other T cell-mediated immunotherapies to enhance anti-tumor responses. These findings highlight the therapeutic potential of PD1-IL2Ra-IL2 as a targeted, receptor-masked, and "α-maintained" IL-2 therapy for cancer.


Conflict of interest statement

Declaration of interests All authors are employees of Regeneron Pharmaceuticals, Inc. and may hold stock or stock options in the company. J.W., T.Z., E.S., and J.C.L. are inventors on US patent US11725034B2; “IL2 agonists and methods of uses thereof”. J.W., N.B., T.Z., J.C.L., S.D., E.S., and E.U. are inventors on a pending US patent application (US20220402989A1; “IL2-based therapeutics and methods of uses thereof”). D.J.D. and J.W. are inventors on a pending US patent application (US20240148867A1; “Methods of treating cancer with a combination of adoptive cell therapy and a targeted immunocytokine”).

Figures

None
Graphical abstract
Figure 1
Figure 1
IL-2Rα engagement is required for the anti-tumor activity of IL-2 (A–D) Human PBMCs were stimulated with a titration of IL2WT-Fc or IL2v-Fc. Percentages of phospho-STAT5-positive cells in gated Tregs (A), CD8+ T cells (B), and NK cells (C). (D) Levels of IL-2Rα expression on each gated population. Data are representative of three independent experiments. (E–G) C57BL/6 mice bearing subcutaneously established MC38 tumors were treated intraperitoneally with indicated proteins on the specified days (E). (F) Average tumor growth (mean + SEM), with statistical significance determined by two-way ANOVA and Bonferroni’s multiple comparisons tests (∗∗∗∗p ≤ 0.0001). (G) Survival curves, with statistical significance determined by Kaplan-Meier analysis with the log rank test (∗∗p ≤ 0.01, ∗∗∗p ≤ 0.001, ∗∗∗∗p ≤ 0.0001). Data are representative of three independent experiments. (H and I) C57BL/6 mice bearing established MC38 tumors were dosed intraperitoneally with 0.75 mg/kg IL2WT-Fc, IL2v-Fc, or isotype control every other day for three total doses. (H) Two days after the last dose, numbers of Tregs, NK1.1+ cells, and CD8+ T cells in the spleen, blood, and tumor were quantified. (I) Expression of IL-2Rα and PD-1 on CD8+ T cells from each tissue. Data are representative of two experiments. Statistical analyses were performed using one-way ANOVA with Tukey’s multiple comparisons tests (∗p ≤ 0.05, ∗∗p ≤ 0.01).
Figure 2
Figure 2
Design and in vitro characterization of PD1-IL2Ra-IL2 (A) Schematic representation of PD1-IL2Ra-IL2 in both masked and unmasked conformations. (B) Experiment design and resulting native mass spectra of a mixture of PD1-IL2Ra-IL2 + a hIgG4 mAb (lower) compared to a mixture of PD1-IL2 + a hIgG4 mAb (upper) under partial reduction conditions. Data are representative of two experiments. (C and D) SPR sensorgrams for binding of PD1-IL2Ra-IL2 or control molecules to IL-2 receptor subunit proteins IL-2Rα (C), IL-2Rβ, and IL-2Rγ (D). (E) Binding of a titration of each indicated molecule to YT/STAT5-Luc/IL2RaKO/PD1KO (upper) or YT/STAT5-Luc/IL2RaOE/PD1KO (lower) cells analyzed by flow cytometry. (F) Activation of STAT5 luciferase reporter on YT/STAT5-Luc/IL2RaKO cell lines expressing various levels of PD-1 by a titration of each indicated molecule. Each data point is shown as mean ± SD of three technical replicates. Data are representative of at least three experiments. (G) Human PBMCs were stimulated with a titration of each indicated molecule. Levels of STAT5 phosphorylation on gated PD-1 CD8+ T cells (left) or PD-1+ CD8+ T cells (right) were measured by flow cytometry. Data are representative of three independent experiments performed on different donors. (H) Production of TNF-α by primary human T cells stimulated with allogeneic PBMCs in the presence of a titration of each indicated molecule. Each data point is shown as mean ± SD of three technical replicates. Data are representative of four assays with different donor T cell/PBMC combinations.
Figure 3
Figure 3
Compared to unmasked IL-2 molecules, PD1-IL2Ra-IL2 shows improved specificity and reduced toxicity in vivo (A and B) Human PD-1 knockin mice bearing established MC38 tumors were treated twice with the indicated molecules on days 0 and 3. On day 6, peripheral blood leukocytes were analyzed by flow cytometry for numbers of (A) PD-1CD8+ T cells and (B) PD-1+CD8+ T cells. Results are presented as means ± SD, with statistical analyses performed using one-way ANOVA with Tukey’s multiple comparisons tests (∗∗p ≤ 0.01, ∗∗∗p ≤ 0.001). Data are representative of two experiments. (C and D) Human PD-1 knockin mice were treated daily with equimolar amounts of indicated molecules via intraperitoneal injection for a total of 4 injections. (C) Body weight changes, with statistical analyses performed using two-way ANOVA with Bonferroni’s multiple comparisons tests (∗p ≤ 0.05, ∗∗p ≤ 0.01). (D) One day after the last dose, mice were euthanized, and pulmonary wet weight was determined by subtracting dry lung weight (after desiccation at 55°C for 72 h) from fresh lung weight (immediately after collection). Statistical analyses were performed using one-way ANOVA with Dunnett’s multiple comparisons tests (∗∗∗∗p ≤ 0.0001). Data are representative of two experiments.
Figure 4
Figure 4
Anti-tumor activity of PD1-IL2Ra-IL2 in various syngeneic tumor models (A–D) Human PD-1 knockin mice were implanted subcutaneously with (A) B16F10 or (B) MCA205 tumors. (C) C57BL/6 mice were implanted subcutaneously with TRAMP-C2 tumor cells. (D) BALB/c mice were implanted subcutaneously with Colon 26 tumor cells. When tumors were established, mice were randomized into groups and treated with indicated molecules on the indicated days via intraperitoneal injection. Tumor growth (mean + SEM) was monitored over time and the number of tumor-free (TF) mice at the end of the study is indicated for select tumor models. (E) Human PD-1 knockin mice bearing subcutaneously established MC38 tumors were randomized and then treated with indicated molecules on the indicated days via intraperitoneal injection. Tumor growth (mean + SEM) (left) and mice survival (right) were monitored over time, and the number of TF mice at the end of the study is indicated for select groups. Data are representative of at least three experiments. (F) Human PD-1 knockin mice bearing established MC38 tumors were randomized and were treated with isotype control or PD1-IL2Ra-IL2 (0.5 mg/kg) in combination with the indicated depletion mAbs or FTY-720 via intraperitoneal injection. Schedule of injection for each reagent is indicated on the schematic (top). Tumor growth (mean + SEM) (middle) and mice survival (bottom) were monitored over time. (G) PD-1 knockin mice that previously cleared MC38 tumors after treatment with PD1-IL2Ra-IL2, along with naive control mice, were rechallenged with a secondary MC38 tumor implant through subcutaneous injection on the opposite flank. Tumor growth (mean ± SEM) was monitored over time. Data are representative of three experiments. All statistical analyses for tumor growth were performed using two-way ANOVA with Bonferroni’s multiple comparisons tests (∗p ≤ 0.05, ∗∗p ≤ 0.01, ∗∗∗p ≤ 0.001, ∗∗∗∗p ≤ 0.0001). All statistical significance for mice survival were determined by Kaplan-Meier analyses with the log rank tests (∗∗∗p ≤ 0.001, ∗∗∗∗p ≤ 0.0001).
Figure 5
Figure 5
PD1-IL2Ra-IL2 increases intratumoral CD8+ T cells with distinct effector profiles and tumor specificity (A–F) Single-cell RNA and TCR sequencing analyses of MC38 tumor-infiltrating T cells from human PD-1 knockin mice treated with indicated molecules. (A) Uniform manifold approximation and projection (UMAP) of all T cells colored by clusters. (B) Heatmap of normalized expression of the top five marker genes in each cluster. (C) Treatment-specific contribution of cells on the UMAP (left) and in each cluster (right). (D) UMAP projection of T cells colored by expression levels of indicated marker genes. (E) UMAP projection of T cells colored by TCR clonal frequency ranges. (F) Overlap of TCR clonality profiles across different pairs of T cell clusters. (G–L) C57BL/6 mice bearing subcutaneously established TRAMP-C2 tumors were grouped and treated with a single dose of indicated molecules. 6 days post-dosing, tumors were analyzed by flow cytometry for (G) tumor CD8+ T cell density and (H and I) SPAS-1-Dextramer+ CD8+ T cells as a percentage of total CD8+ T cells with representative flow cytometry plots. Densities of (J) SPAS-1-Dextramer+ CD8+ T cells, (K) PD-1+CD8+ T cells, and (L) TCF1+PD-1+CD8+ T cells in the tumor are quantified. Statistical analyses were performed using one-way ANOVA with Dunnett’s multiple comparisons tests (∗∗p ≤ 0.01). Data are representative of two experiments.
Figure 6
Figure 6
Combination of PD1-IL2Ra-IL2 with anti-PD-1 treatment results in a higher frequency of complete tumor regression Human PD-1 knockin mice bearing subcutaneously established MC38 tumors were randomized and treated with indicated molecules and doses via intraperitoneal injection. (A) Study schematic with schedule of injection for each reagent. (B) Average tumor growth (mean + SEM) and (C) mice survival were monitored over time. (D) Individual tumor growth curves and the number of tumor-free mice in each group at the end of the study. Arrow indicates when mice initially underwent tumor regression. Statistical analyses for average tumor growth were performed using two-way ANOVA with Bonferroni’s multiple comparisons tests (∗∗∗p ≤ 0.001). Statistical significance for mice survival were determined by Kaplan-Meier analyses with the log rank tests (∗∗p ≤ 0.01, ∗∗∗∗p ≤ 0.0001). Data are representative of three independent experiments.
Figure 7
Figure 7
mPD1-IL2Ra-IL2 enhances the anti-tumor efficacy of MUC16xCD3 and anti-huMUC16 CAR-T cells (A–C) In vivo anti-tumor efficacy of combination therapy with mPD1-IL2Ra-IL2 and MUC16xCD3. (A) Study schematic, HuCD3/huMUC16 knockin mice bearing subcutaneously established ID8-VEGF/huMUC16Δ tumors were injected with indicated molecules on the specified days. (B) Average tumor growth curves (mean + SEM), with statistical analyses performed using two-way ANOVA with Bonferroni’s multiple comparisons tests (∗p ≤ 0.05, ∗∗p ≤ 0.01, ∗∗∗p ≤ 0.001). (C) Individual tumor growth curves and the number of tumor-free mice in each treatment group at the end of the study. Data are representative of two independent experiments. (D) Expression of PD-1 on anti-huMUC16 or control CAR+ T cells after co-culture with indicated tumor cell lines in vitro. (E–G) In vivo anti-tumor efficacy of combination therapy with mPD1-IL2Ra-IL2 and anti-huMUC16 CAR-T cells. (E) Study schematic, HuCD3/huMUC16 knockin mice were lymphodepleted, implanted with ID8-VEGF/huMUC16Δ tumor cells, and administered with anti-huMUC16 or control CAR-T cells and protein molecules on the indicated days. (F) Average tumor growth curves (mean + SD), with statistical analyses performed using two-way ANOVA with Bonferroni’s multiple comparisons tests (∗∗p ≤ 0.01, ∗∗∗∗p ≤ 0.0001). (G) Individual tumor growth curves from each treatment group. Data are representative of two independent experiments.

Similar articles

Cited by

References

    1. Bagchi S., Yuan R., Engleman E.G. Immune Checkpoint Inhibitors for the Treatment of Cancer: Clinical Impact and Mechanisms of Response and Resistance. Annu. Rev. Pathol. 2021;16:223–249. doi: 10.1146/annurev-pathol-042020-042741. - DOI - PubMed
    1. June C.H., O’Connor R.S., Kawalekar O.U., Ghassemi S., Milone M.C. CAR T cell immunotherapy for human cancer. Science. 2018;359:1361–1365. doi: 10.1126/science.aar6711. - DOI - PubMed
    1. van de Donk N.W.C.J., Zweegman S. T-cell-engaging bispecific antibodies in cancer. Lancet. 2023;402:142–158. doi: 10.1016/S0140-6736(23)00521-4. - DOI - PubMed
    1. Waldman A.D., Fritz J.M., Lenardo M.J. A guide to cancer immunotherapy: from T cell basic science to clinical practice. Nat. Rev. Immunol. 2020;20:651–668. doi: 10.1038/s41577-020-0306-5. - DOI - PMC - PubMed
    1. Fridman W.H., Pagès F., Sautès-Fridman C., Galon J. The immune contexture in human tumours: impact on clinical outcome. Nat. Rev. Cancer. 2012;12:298–306. doi: 10.1038/nrc3245. - DOI - PubMed

MeSH terms

Substances