. 2024 Oct 21;34(20):4662-4676.e9.
doi: 10.1016/j.cub.2024.08.053. Epub 2024 Sep 25.

Structural genomic variation and behavioral interactions underpin a balanced sexual mimicry polymorphism

Affiliations

Structural genomic variation and behavioral interactions underpin a balanced sexual mimicry polymorphism

Tristram O Dodge et al. Curr Biol. .

Abstract

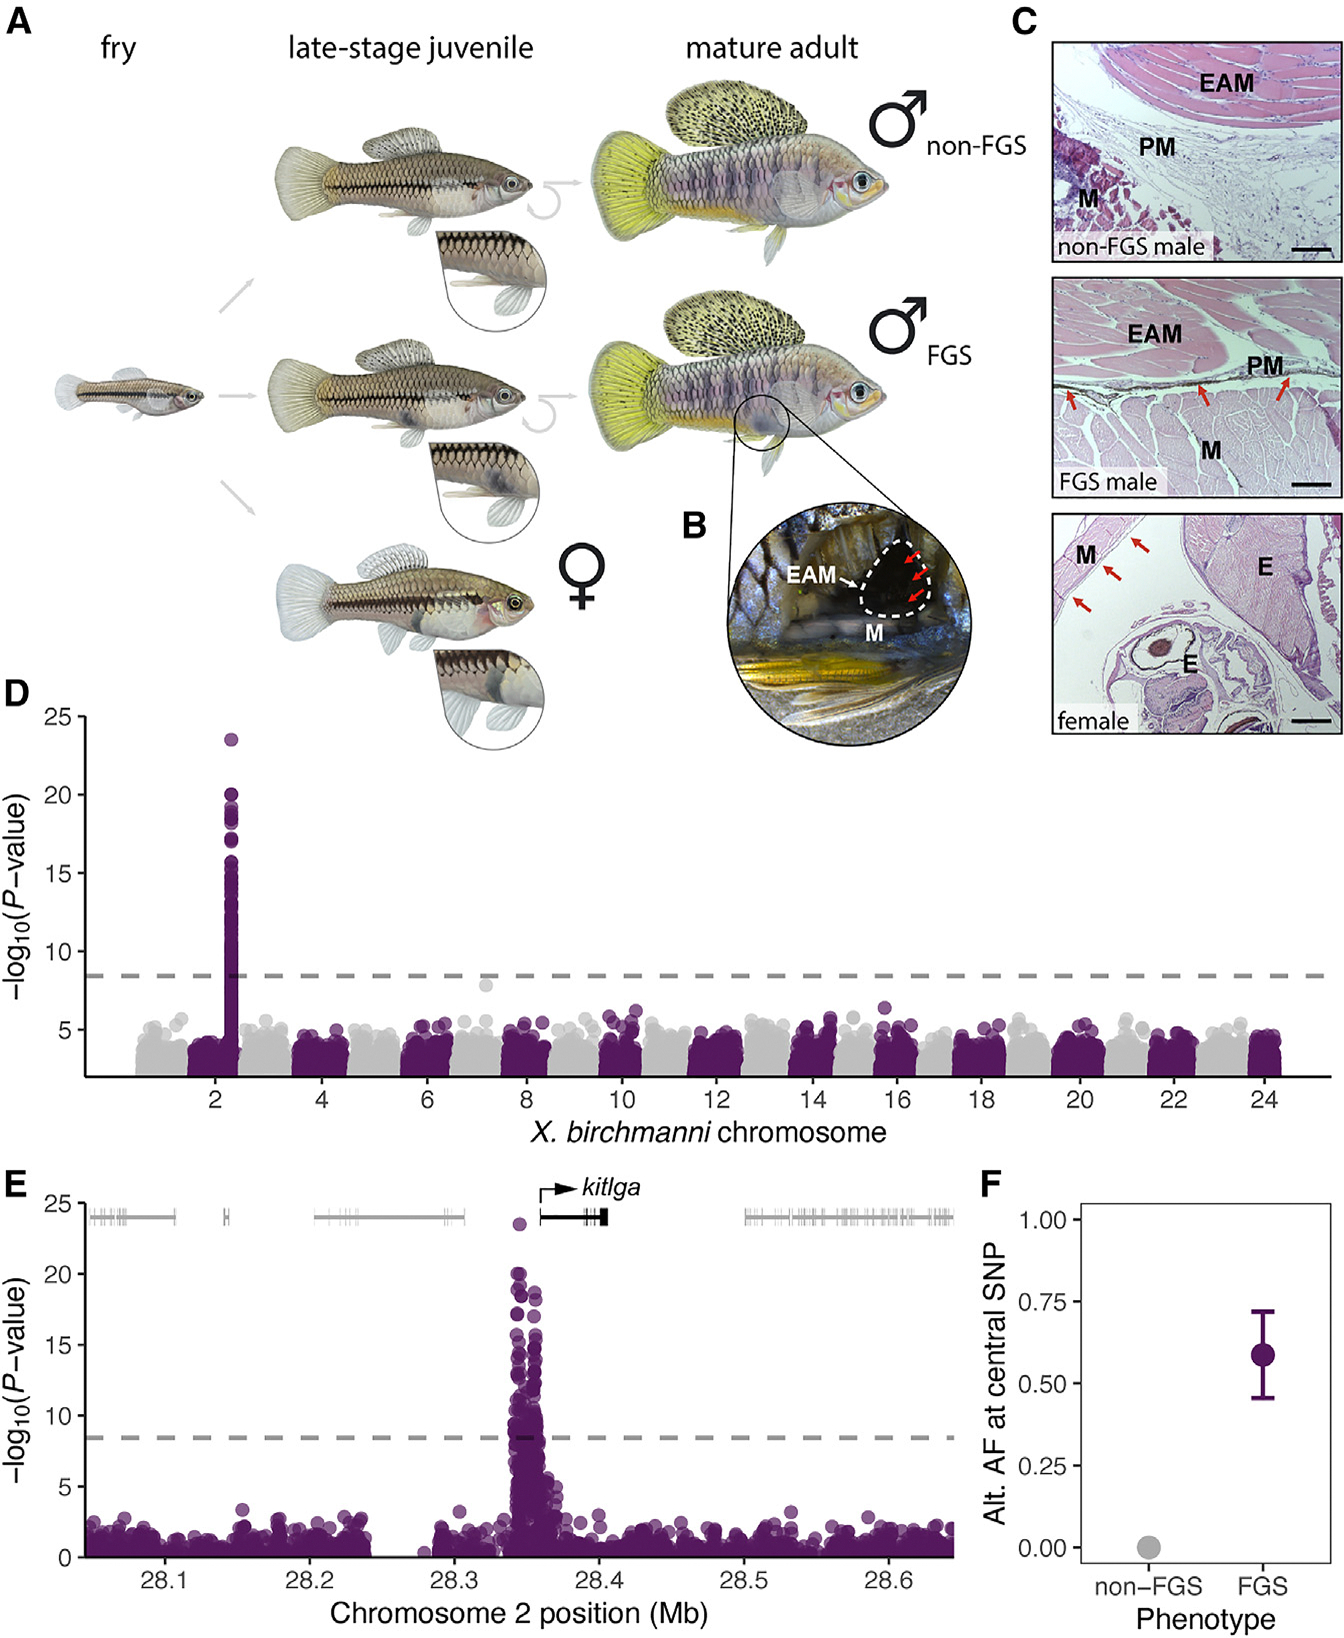
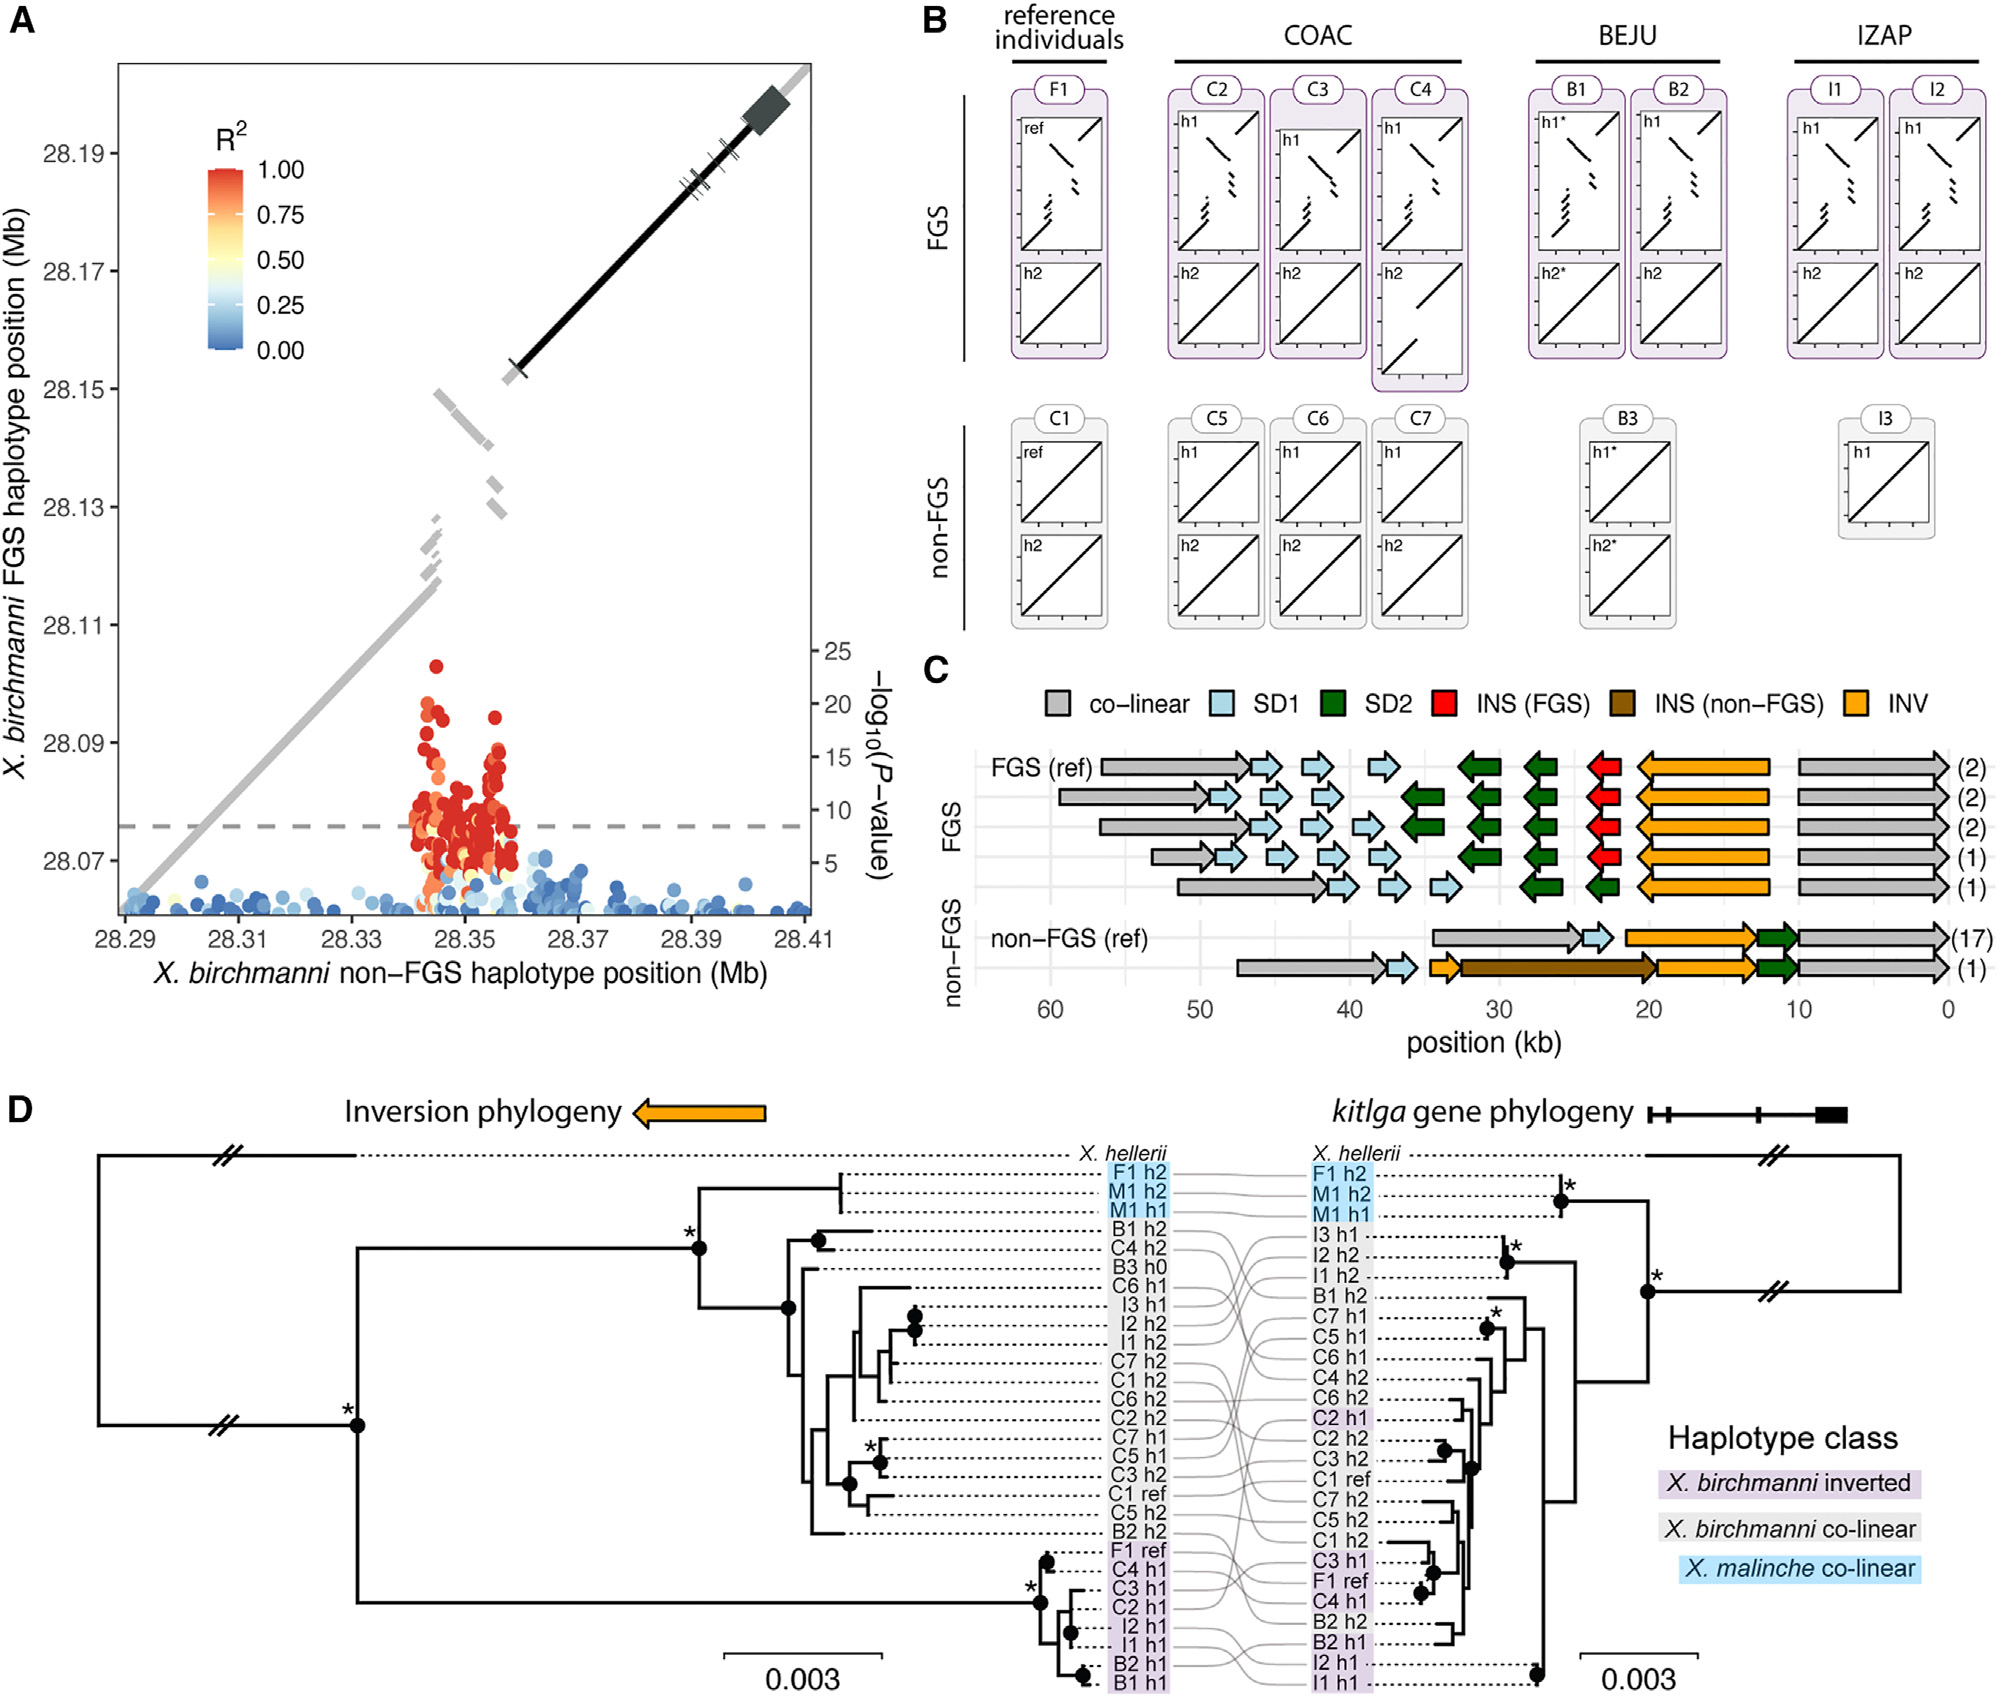
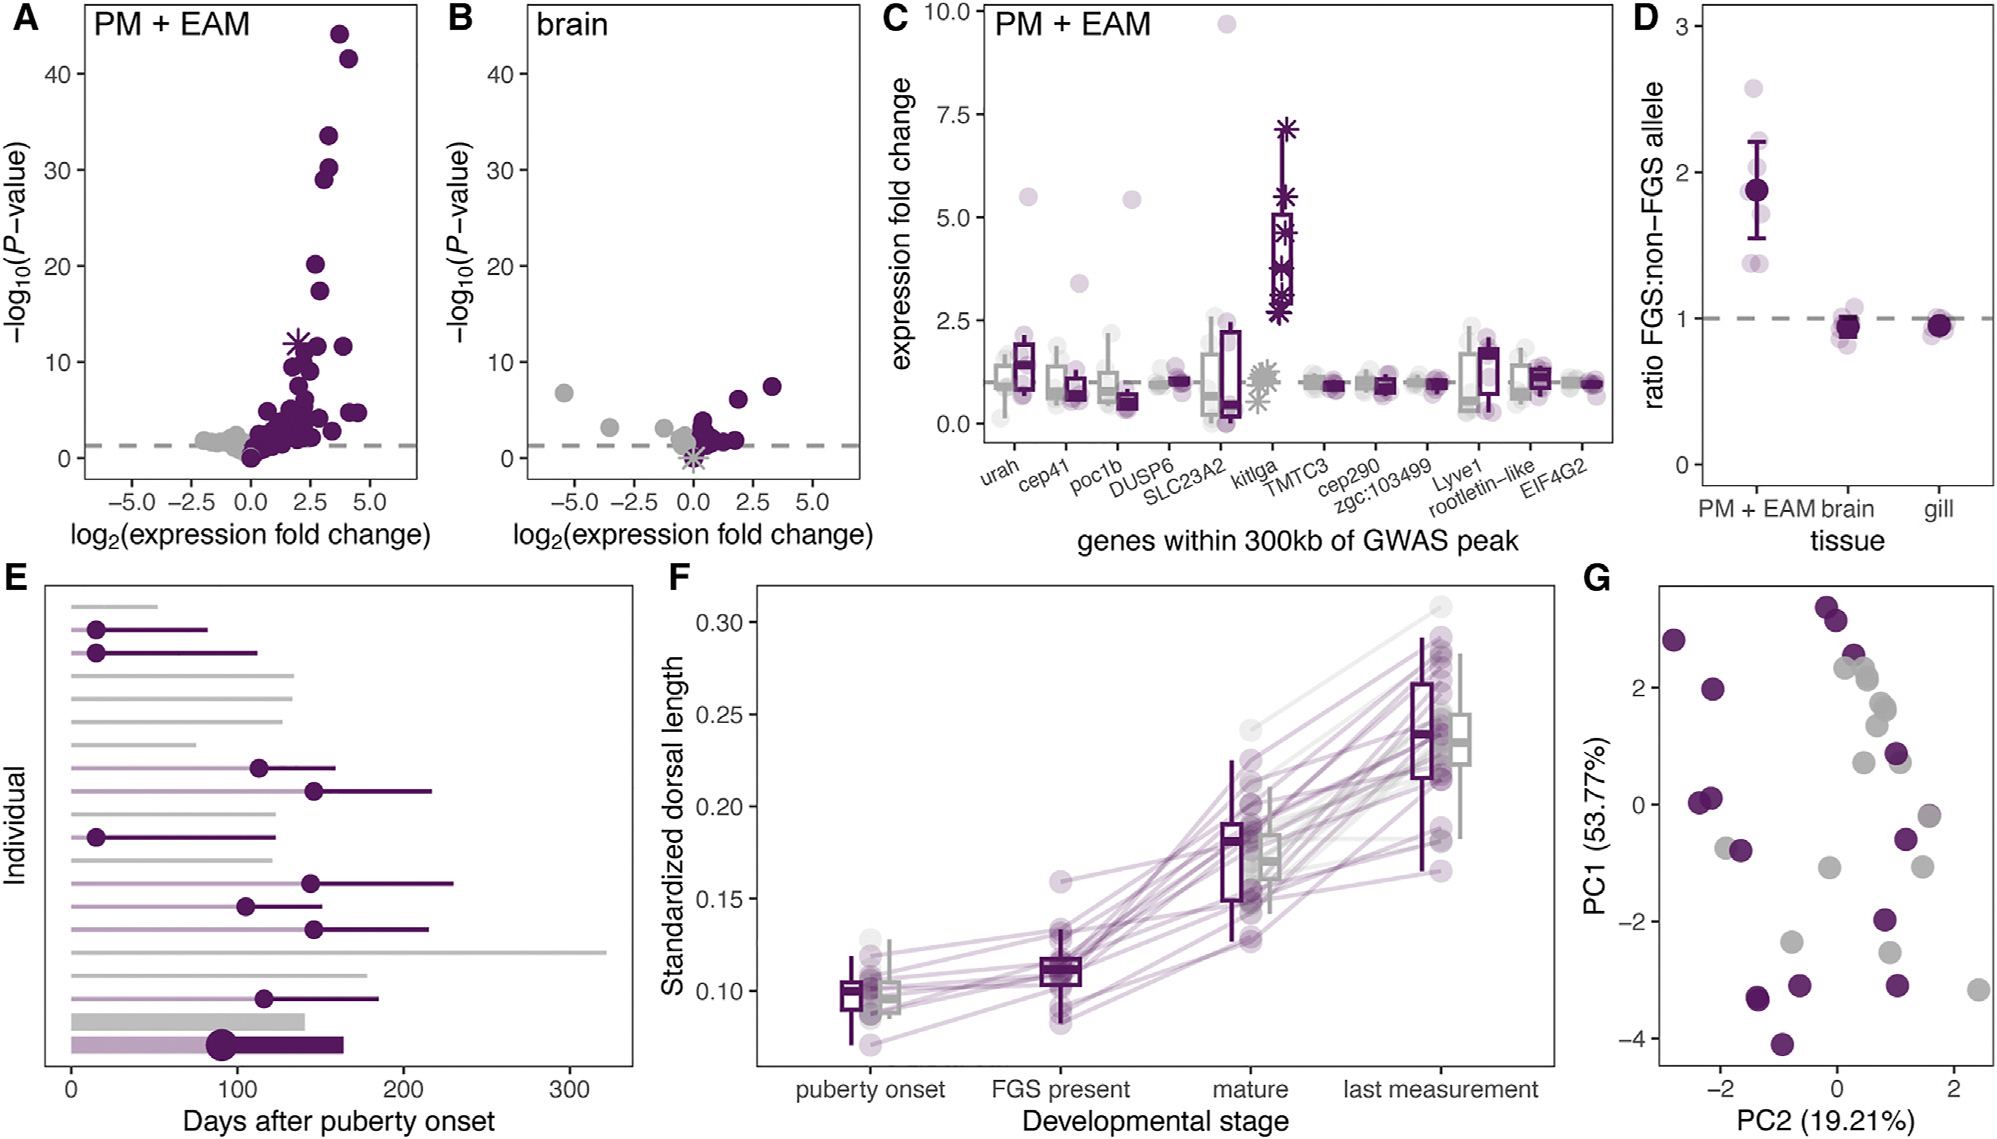
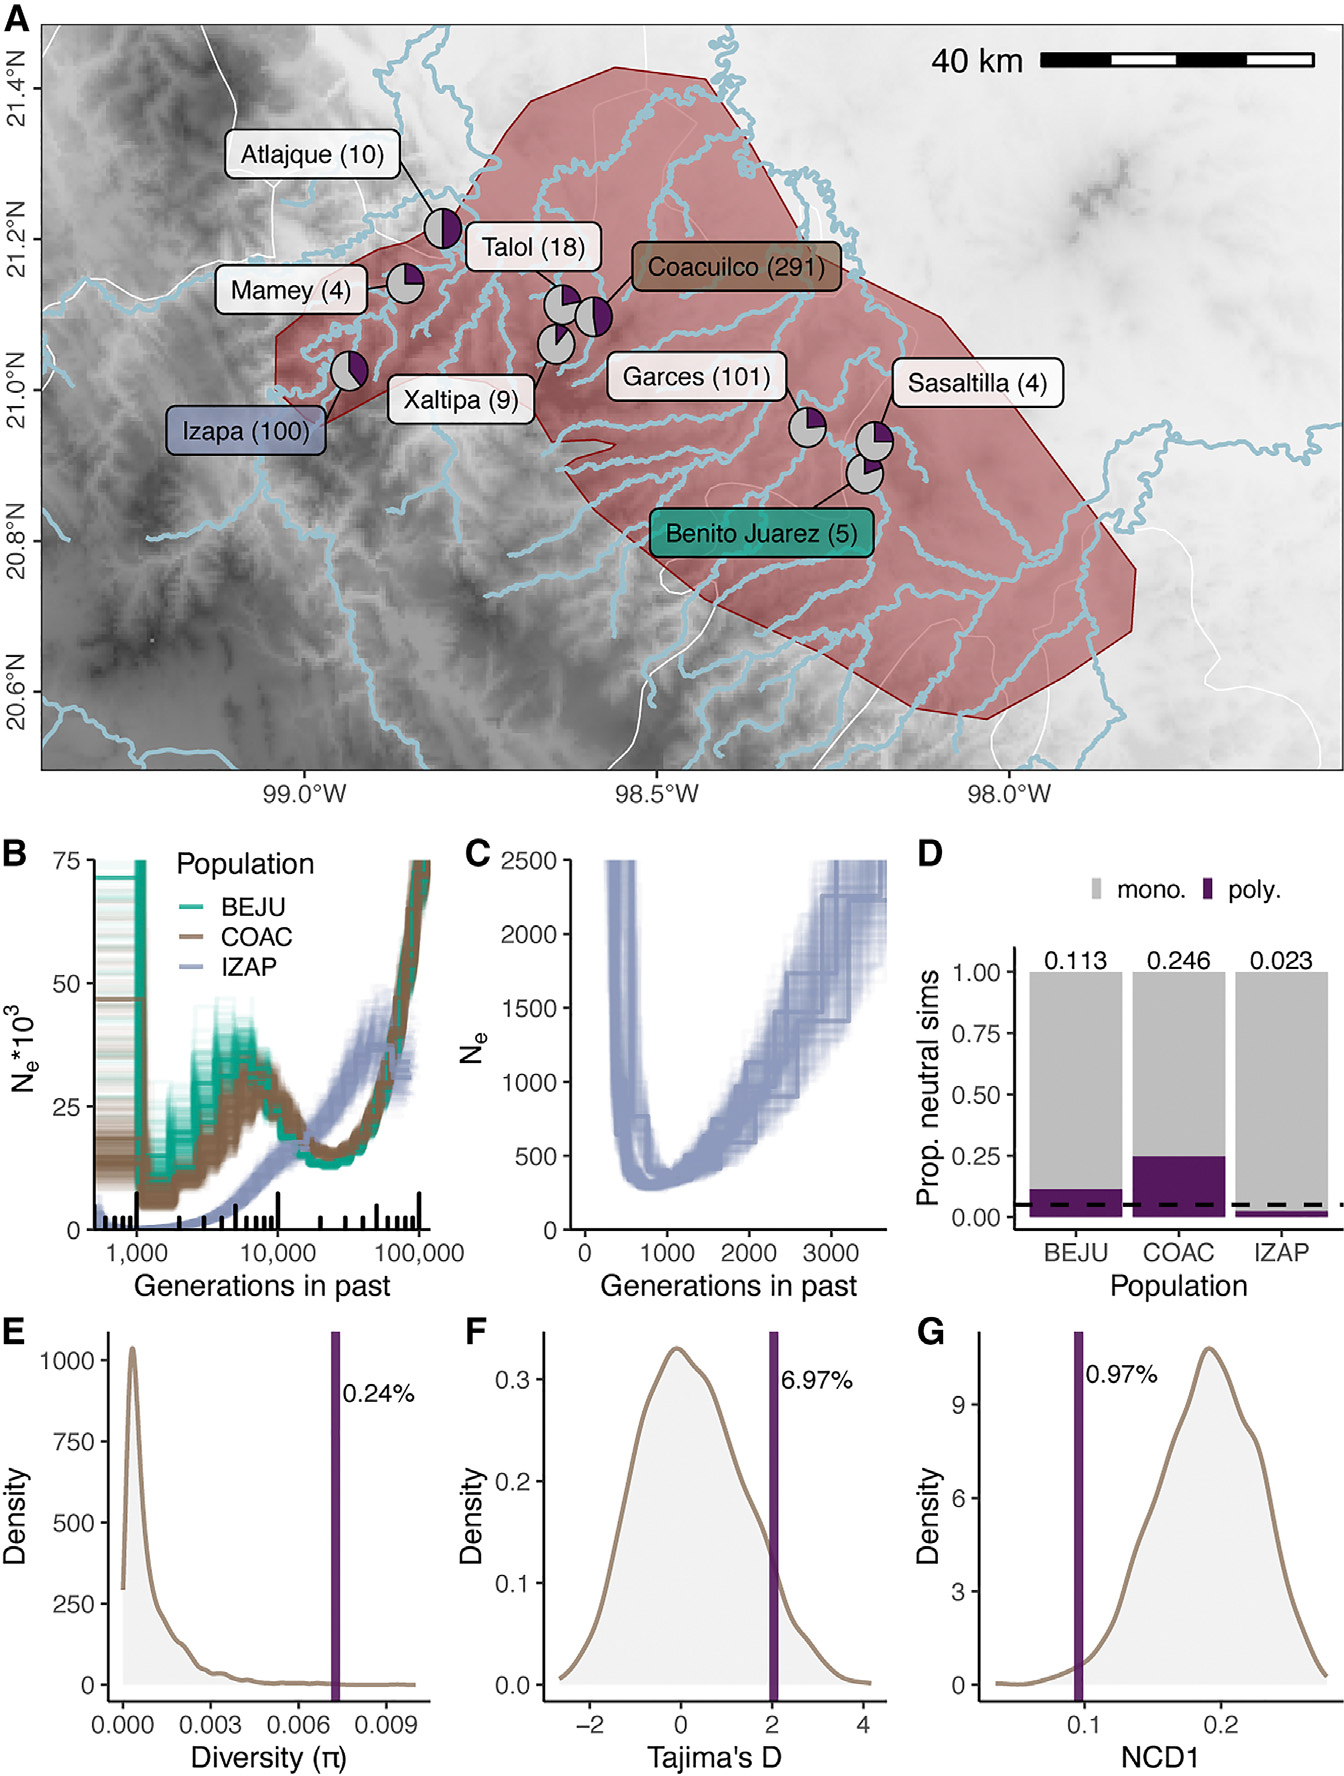
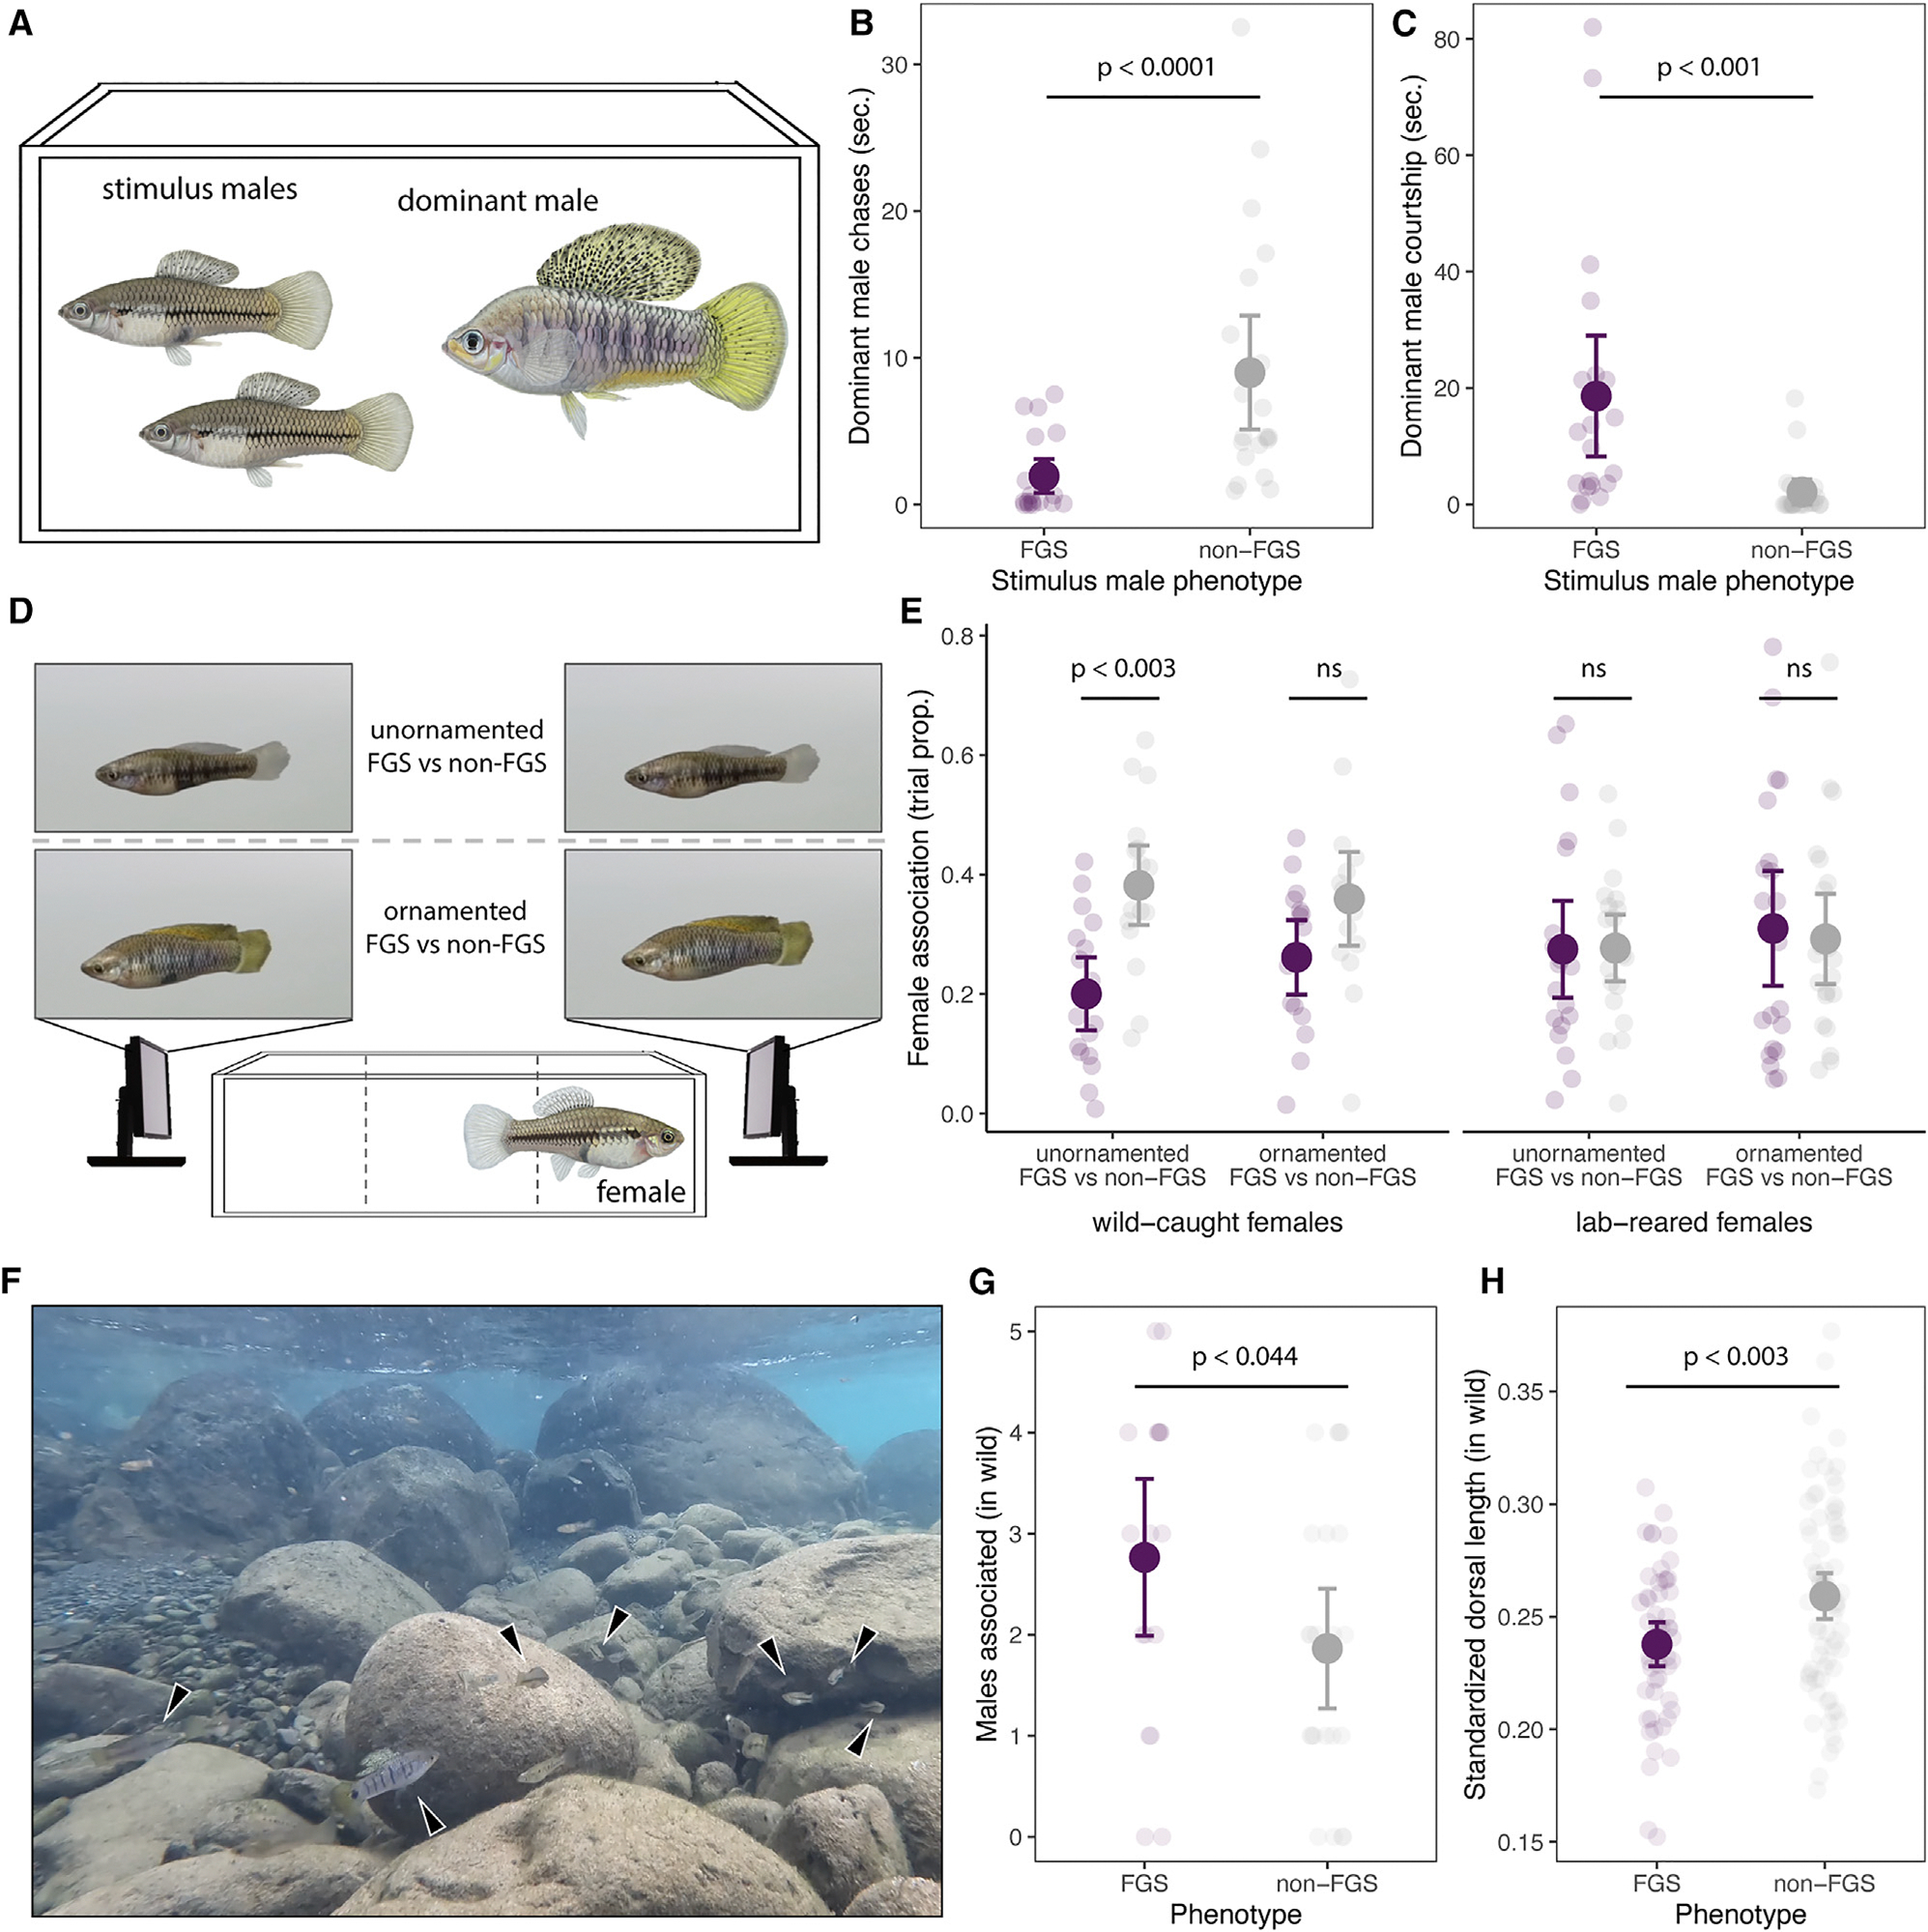
How phenotypic diversity originates and persists within populations are classic puzzles in evolutionary biology. While balanced polymorphisms segregate within many species, it remains rare for both the genetic basis and the selective forces to be known, leading to an incomplete understanding of many classes of traits under balancing selection. Here, we uncover the genetic architecture of a balanced sexual mimicry polymorphism and identify behavioral mechanisms that may be involved in its maintenance in the swordtail fish Xiphophorus birchmanni. We find that ∼40% of X. birchmanni males develop a "false gravid spot," a melanic pigmentation pattern that mimics the "pregnancy spot" associated with sexual maturity in female live-bearing fish. Using genome-wide association mapping, we detect a single intergenic region associated with variation in the false gravid spot phenotype, which is upstream of kitlga, a melanophore patterning gene. By performing long-read sequencing within and across populations, we identify complex structural rearrangements between alternate alleles at this locus. The false gravid spot haplotype drives increased allele-specific expression of kitlga, which provides a mechanistic explanation for the increased melanophore abundance that causes the spot. By studying social interactions in the laboratory and in nature, we find that males with the false gravid spot experience less aggression; however, they also receive increased attention from other males and are disdained by females. These behavioral interactions may contribute to the maintenance of this phenotypic polymorphism in natural populations. We speculate that structural variants affecting gene regulation may be an underappreciated driver of balanced polymorphisms across diverse species.

Keywords: Xiphophorus; balancing selection; kit ligand; polymorphism; sexual mimicry; structural variation.


Conflict of interest statement

Declaration of interests The authors declare no competing interests.

Figures

Figure 1.
Figure 1.. The false gravid spot is a pigmentation polymorphism in X. birchmanni with a simple genetic basis
(A) Fry (left) are morphologically indistinguishable until the onset of puberty. Females (bottom) develop a gravid spot, while some males develop a false gravid spot (FGS, middle) in this region or develop no pigmentation (non-FGS, top). The FGS remains visible throughout the adult male’s life after sexual maturity. Illustrations by Dorian Noel. (B) FGS derives from pigmentation of internal tissues surrounding the gonopodial suspensorium, which is visible through the body wall musculature and skin. (C) Histological sections reveal that X. birchmanni males without FGS (top) do not develop pigmentation, while males with the spot accumulate melanophores in the perimysium of the erector analis major. The gravid spot is due to expansion of the pigmented peritoneum (bottom). Labels: M, body wall musculature; EAM, erector analis major; PM, perimysium of EAM; E, embryo; red arrows, pigmented melanophore cells. Scale bars denote 50 μm for top and middle images and 200 μm for bottom image. See also Figure S1. (D) Manhattan plot shows a single autosomal region on chromosome 2 that is associated with the FGS. Dashed line shows the 5% false positive threshold. See also Figure S2. (E) Inset highlighting 17 kb genome-wide significant region, occurring 1.5 kb upstream of the kitlga gene. See also Figures S3 and S4. (F) Allele frequency (AF) of the non-reference allele at the central representative SNP from the GWAS region (position 28,349,032) in non-FGS and FGS males. Error bars denote ±2 binomial standard errors.
Figure 2.
Figure 2.. A complex structural variant is associated with the false gravid spot locus
(A) Combined plot showing GWAS peak overlayed with MUMmer4 alignment (gray lines) of false gravid (FGS) and non-false gravid (non-FGS) haplotypes. Color of points in GWAS denotes R2 with the center SNP (position 28,349,032). Region of high LD colocalizes with the complex structural variant. The kitlga gene is plotted to the upper-right of the structural variant, with exons noted with thicker segments. See also Figures S5 and S6 and Table S2. (B) Long-read sequencing reveals that this complex structural variant is perfectly associated with the FGS phenotype across populations. Alignments between each haplotype compared with the reference non-FGS sequence. Individuals with the FGS phenotype are indicated in purple outlines, and individuals without are noted in gray. Reference individuals include the F1 X. birchmanni × X. malinche hybrid with FGS and the chromosome-level assembly from Coacuilco without FGS. An additional 12 individuals were sequenced across three X. birchmanni populations (COAC, Coacuilco; BEJU, Benito Juarez; IZAP, Izapa). Haplotypes were extracted from diploid assemblies, unless noted with a star, in which case individual long reads spanning the region were used to infer haplotype structure. The non-FGS individual from Izapa (I3) was completely homozygous in this region, so a single haplotype is displayed. (C) Five structurally variable haplotype classes exist across eight FGS haplotypes sequenced, compared with two classes across 17 non-FGS haplotypes in X. birchmanni. Numbers on right denote number of times haplotype was observed. SD1, segmental duplication 1; SD2, segmental duplication 2; INS (FGS), insertion in FGS haplotype (piggyback 4 element); INS (non-FGS), insertion in non-FGS haplotype; INV, inversion. See also Figure S7 to connect haplotype labels to structural variant classes. (D) Local phylogeny of the inversion (left) versus kitlga gene sequence (exons and introns; right) in X. birchmanni and X. malinche, with X. hellerii as the outgroup. Sequence names same as (B) with lines connecting the same haplotype. The inverted region clusters by structural variant type and then by species, while the genic sequence clusters by species and not by structural variant. Nodes with over 80% bootstrap support are noted with black circles, and nodes with 100% support are labeled with an additional asterisk. Slashes indicate where branch lengths were shortened for visualization. See also Figure S8.
Figure 3.
Figure 3.. Gene expression and developmental timing of the false gravid spot phenotype
(A) RNA-seq analysis shows differential gene expression in individuals with and without false gravid spot (FGS) in the erector analis major tissue and its perimysium (EAM + PM). kitlga is shown with a star. Genes with increased expression in FGS individuals are shown in purple, and genes with increased expression in non-FGS individuals are shown in gray. See also Table S3. (B) Brain tissue shows limited differential gene expression between FGS and non-FGS individuals, including for kitlga. See also Table S3. (C) In EAM + PM tissue, kitlga is the only differentially expressed gene within 300 kb of the GWAS peak. Expression fold change of the 12 closest genes to the peak (ordered by genomic position), normalized by mean non-FGS individual expression, with data for non-FGS individuals in gray and FGS individuals. (D) Allele-specific expression in X. birchmanni × X. malinche hybrids with FGS suggests the expression differences in kitlga are under cis-regulatory control. Expression is normalized to the X. malinche (non-FGS) allele. Large points and whiskers denote mean ± 2 binomial standard errors, and small points represent individuals. See also Figure S9. (E) Developmental time between onset of puberty until sexual maturity in 17 X. birchmanni males in the laboratory. Individuals are ordered from top to bottom by birth date; FGS individuals are noted in purple, with the dot showing when the spot developed; and non-FGS individuals are in gray. Thick bars and dot at the bottom represent mean time to sexual maturity and FGS development timing for each group. See also Figure S10 and Table S5. (F) Dorsal fin length, standardized by body length, across fish from the developmental series shows that dorsal fin elongation tends to occur later during sexual maturity and continues to elongate after males are reproductively mature. (G) Principal-component analysis (PCA) of male phenotypes at sexual maturity shows FGS and non-FGS males raised in laboratory conditions do not systematically differ in their secondary sexual characteristics (morphometrics and pigmentation traits).
Figure 4.
Figure 4.. The false gravid spot is under balancing selection in the wild
(A) The false gravid spot (FGS) is present in all sampled populations across the X. birchmanni range (red polygon). Pie charts depict FGS phenotypic frequency in adult males, ranging from 0.11 to 0.50, with sample size in parentheses. Map shows elevation from 0 (white) to 3,000 m (black), with major rivers shown in blue and state boundaries shown in white. See also Figure S11. (B) PSMC plot showing inferred population histories over the last ~100,000 generations of three X. birchmanni populations, Benito Juarez (BEJU), Coacuilco (COAC), and Izapa (IZAP), with variants called from ONT data. Izapa experienced a distinct demographic history from Benito Juarez and Coacuilco, including a sustained bottleneck. (C) Recent population history at Izapa inferred from PSMC, showing a minimum Ne of 290 individuals around ~1,000 generations before the present. (D) Outcome of simulations of neutral polymorphisms under the demographic history inferred for each population from PSMC (simulating 63,000–73,000 generations). In the absence of selection, polymorphisms are maintained in only 2.3% of simulations (n = 10,000) matching the demographic history in Izapa. (E) Nucleotide diversity (π) within the inverted region in 23 individuals from Coacuilco compared with the distribution of all 8.8 kb windows from chromosome 2. The π value calculated in the inversion is in the top 0.24% chromosome-wide. (F) Tajima’s D within the inversion falls within the top 6.97% of values chromosome-wide. (G) The NCD1 value within the inversion is in the bottom 0.97% of values chromosome-wide.
Figure 5.
Figure 5.. Behavioral consequences of the false gravid spot
(A) Diagram of male-male interaction experimental design. Scored interactions were all initiated by the focal large-bodied, dominant male directed toward two smaller, unornamented males, with and without false gravid spot (FGS). (B) FGS males were chased for less time compared to non-FGS males (paired Wilcoxon test; p < 0.0001). Large points represent experiment means ±2 standard errors, with small points denoting mean value for each focal male. (C) In the same trials, FGS males were courted more than non-FGS males (paired Wilcoxon test; p < 0.001). (D) Diagram of female preference experimental design. Females were presented a choice between FGS and non-FGS males in two animation types, unornamented males and ornamented males. (E) Females collected in the wild spend a greater proportion of the trial with animations of unornamented males without the FGS (paired Wilcoxon test; p < 0.003), suggesting disdain for the FGS. A significant difference in preference was not detected in any other stimulus or in a cohort of females born in the lab. See also Figure S12. (F) Still image from a representative site during observations in the Río Coacuilco, with X. birchmanni noted with arrows. (G) In the wild, FGS males had more males in their immediate vicinity (1 m2; GLM likelihood ratio χ21 = 4.1, p < 0.044). See Figure S13 for how the FGS and other traits mediate additional behavioral interactions. (H) Wild X. birchmanni males with FGS have shorter dorsal fins than non-FGS males (Welch’s t test; p < 0.003). Dorsal length is represented as a fraction of body length. See also Figure S14.

Similar articles

Cited by

References

    1. Darwin C (1859). On the Origin of Species by Means of Natural Selection, or, Preservation of Favoured Races in the Struggle for Life (John Murray; ). - PMC - PubMed
    1. Ford EB (1945). Polymorphism. Biol. Rev. 20, 73–88. 10.1111/j.1469-185X.1945.tb00315.x. - DOI
    1. Hedrick PW, and Thomson G (1983). Evidence for balancing selection at HLA. Genetics 104, 449–456. 10.1093/genetics/104.3.449. - DOI - PMC - PubMed
    1. Hedrick PW (2007). Balancing selection. Curr. Biol. 17, R230–R231. 10.1016/j.cub.2007.01.012. - DOI - PubMed
    1. Lamichhaney S, Berglund J, Almén MS, Maqbool K, Grabherr M, Martinez-Barrio A, Promerová M, Rubin C-J, Wang C, Zamani N, et al. (2015). Evolution of Darwin’s finches and their beaks revealed by genome sequencing. Nature 518, 371–375. 10.1038/nature14181. - DOI - PubMed

LinkOut - more resources