. 2024 Sep 26;12(9):e008654.
doi: 10.1136/jitc-2023-008654.

Targeting epigenetic regulation and post-translational modification with 5-Aza-2' deoxycytidine and SUMO E1 inhibition augments T-cell receptor therapy

Affiliations

Targeting epigenetic regulation and post-translational modification with 5-Aza-2' deoxycytidine and SUMO E1 inhibition augments T-cell receptor therapy

Jessie S Kroonen et al. J Immunother Cancer. .

Abstract

Background: Cellular immunotherapy using modified T cells offers new avenues for cancer treatment. T-cell receptor (TCR) engineering of CD8 T cells enables these cells to recognize tumor-associated antigens and tumor-specific neoantigens. Improving TCR T-cell therapy through increased potency and in vivo persistence will be critical for clinical success.

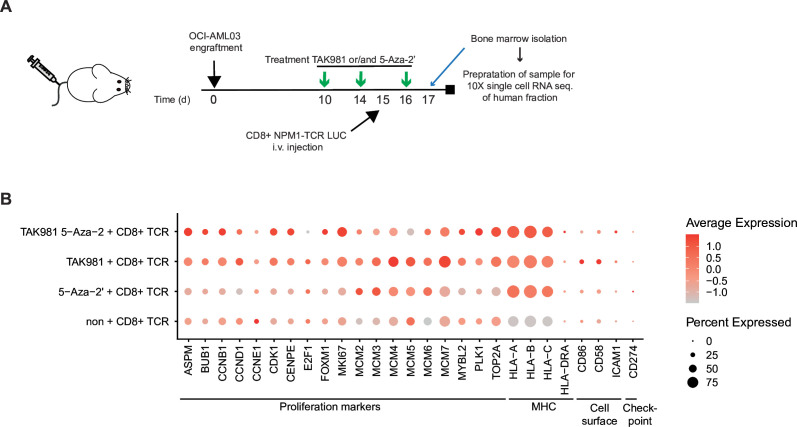
Methods: We evaluated a novel drug combination to enhance TCR therapy in mouse models for acute myeloid leukemia (AML) and multiple myeloma (MM).

Results: Combining TCR therapy with the SUMO E1 inhibitor TAK981 and the DNA methylation inhibitor 5-Aza-2' deoxycytidine resulted in strong antitumor activity in a persistent manner against two in vivo tumor models of established AML and MM. We uncovered that the drug combination caused strong T-cell proliferation, increased cytokine signaling in T cells, improved persistence of T cells, and reduced differentiation towards exhausted phenotype. Simultaneously the drug combination enhanced immunogenicity of the tumor by increasing HLA and co-stimulation and surprisingly reducing inhibitory ligand expression.

Conclusion: Combining T-cell therapy with TAK981 and 5-Aza-2' deoxycytidine may be an important step towards improved clinical outcome.

Keywords: Combination therapy; T cell; T cell Receptor - TCR.


Conflict of interest statement

Competing interests: LUMC has applied for a patent on the triple therapy with MHMH and ACOV as inventors.

Figures

Figure 1
Figure 1. TAK981 and 5-Aza-2’ synergistically reduce OCI-AML3 viability. (A) Mode of action of hypomethylation drug 5-Aza-2’-deoxycytidine. 5-Aza-2’ incorporates into the DNA and entraps DNA methyl transferase 1 (DNMT1). Trapped DNTM1 is SUMOylated and degraded by the proteasome. (B) OCI-AML3 cell viability is shown after 4 days of 5-Aza-2’ treatment (0.025–20 µM) or control DMSO 0.01% treatment. IC50 was calculated with GraphPad Prism V.9.3.1 (n=3). (C) OCI-AML3 cell viability after 4 days of TAK981 treatment (0.0001–0.1 µM) or control DMSO 0.01% treatment. IC50 was calculated with GraphPad Prism V.9.3.1 (n=3). (D) OCI-AML3 cell viability after 4 days of combination treatment with dose-response range of 5-Aza-2’ combined with 10 nM of TAK981. Excess overbliss calculations of single 5-Aza-2’ doses versus 5-Aza-2’ doses with 10 nM TAK981 are provided to show drug synergy.
Figure 2
Figure 2. NPM1-TCR CD8+T cell antitumor efficacy is enhanced by 5-Aza-2’ and TAK981 in vivo. (A) Timeline of in vivo experiment. Luciferase-expressing OCI-AML3 cells (1×10⁶) were injected intravenously into the tail vein of NSG mice and engrafted for 10 days. Tumor volume was measured by IVIS. At day 10 treatment was started. Two rounds of the drug treatment with TAK981 (25 mg/kg) and/or 5-Aza-2’ (2.5 mg/kg) were carried out. Subsequently, NPM1-TCR or CMV-TCR CD8+T cells (3×10⁶) were intravenously injected on day 15. Biweekly drug treatments were continued until day 50 post-tumor injection. (B) OCI-AML3 tumor outgrowth average per group (n=6/7), control group consisted of 20% (2-hydroxypropyl)-ß-cyclodextrin (HPBCD) buffer (n=3) and CD8+CMV TCR (n=3), which both fail to inhibit tumor outgrowth as shown in online supplemental figure 2E. Relative bioluminescent signal (BLI photons/sec/cm2/r) per mouse at day 10 is shown. (C) Survival curves for each group from B. The spaced line at day 50 indicates the end of the drug treatment. (D) Average OCI-AML3-Luc tumor outgrowth per group (n=6) ratio to bioluminescent (BLI photons/sec/cm2/r) signal per mouse at day 10. Graphs represent the time point when all mice were present in the experiment. A selection of groups from (B) containing at least NPM1-TCR as therapy are shown. One-way analysis of variance analysis was performed for tumor signals at day 35, in GraphPad Prism V.9.3.1. TCR, T-cell receptor.
Figure 3
Figure 3. SUMOylation inhibition in combination with hypomethylation activates the interferon pathway, cytokine production and cytolytic compound signaling in CD8+T cells. (A) CD8+T cells were isolated from three different healthy donors. CD8+ were treated 10 days post stimulation with 10 nM TAK981 and/or 25 nM 5-Aza-2’ or DMSO 0.01% as control overnight. mRNA expression levels of IFN-γ, IFN-β, IFN-α, STAT1, IFNAR1, IFIT1, IFITM3, ISG15, ISG56, IRF7, T-bet, TNF-α, granzyme B, perforin-1, IL-2, IL-4, IL-5 and IL-10 were measured using quantitative PCR. 18sRNA, SDHA and SRPR were used as housekeeping genes. Expression was plotted as a ratio to DMSO 0.01% control, individual per donor (n=3). *p<0.05, **p<0.01, ***p<0.001, two-way ANOVA compared with DMSO 0.01%, followed by Dunnett multiple comparison correction GraphPad Prism V.9.3.1. (B) Experimental co-culture set-up to measure the production of IFN-γ by CD8+T cell on co-culture with OCI-AML3 target cells. Either CD8+T cells or OCI-AML3 cell were pretreated with TAK981 and/or 5-Aza-2’ pre-overnight co-culture. (C) OCI-AML3 target cells were pretreated on days 4 and 1 with 10 nM TAK981 and/or 25 nM 5-Aza-2’. Subsequently, OCI-AML3 cells were co-cultured overnight with CD8+T cells. Supernatant was harvested and analyzed by IFN-γ ELISA. Five different donors were used for the generation of CD8+NPM1 TCR T cells. *p<0.05, two-way ANOVA compared with DMSO 0.01%, followed by Fisher’s LSD test, GraphPad Prism V.9.3.1. (D) CD8+T cells were pretreated on days 4 and 1 with 10 nM TAK981 and/or 25 nM 5-Aza-2’. Subsequently, CD8+T cells were co-cultured with OCI-AML3 cells overnight. Supernatant was harvested and analyzed by IFN-γ ELISA. Five different donors were used for the generation of CD8+NPM1 TCR T cells *p<0.05, two-way ANOVA compared with DMSO 0.01%, followed by Fisher’s least significant difference test, GraphPad Prism V.9.3.1. ANOVA, analysis of variance; IFN, interferon; mRNA, messenger RNA; TCR, T-cell receptor.
Figure 4
Figure 4. Combination therapy of 5-Aza-2’ and TAK981 potentiate CD8+T cell proliferation in vivo. (A) Time line of in vivo experiment. Luciferase expressing NPM1-TCR or CMV-TCR CD8+T cells (3×10⁶) were injected 18 days post OCI-AML3 (1×10⁶) engraftment. Two times dosing with TAK981 (25 mg/kg) and/or 5-Aza-2’ (2.5 mg/kg) prior to T-cell injection was performed and three times following T-cell injection, matching the dosing time to figure 3. Bioluminescence (photons/sec/cm2/r) was measured at indicated time points on days 3, 6 and 9 post T-cell injection. (B) Raw values of ventral BLI signal (photons/sec/cm2/r) for days 3, 6 and 9 are visualized per group. Each dot represents an individual mouse. Differences to CD8+NPM1 TCR Luc group were analyzed per time point via two-way analysis of variance (mixed model) followed by Tukey multiple comparisons. *p<0.05, **p<0.01 (day 3: n=10 per group, day 6: n=8 per group) (C) Visualization of luciferase transduced CD8+T in all mice imaged in figure 4B. Scaling for bioluminescence was kept the same for each time point (Living Image Software). Six mice in the NPM1-TCR/TAK981 group reached the humane endpoint. (D) Ratio of CD8+cells per total live cells (human and mouse) in bone marrow. (E) Ratio of OCI-AML3 cells per total live cells (human and mouse) in bone marrow. Samples were taken from mice depicted in figure 4B, large symbols for mice on day 6 match the ratio OCI-AML3+counts/total live count for day 7 and large symbols for mice on day 9 match the ratio OCI-AML3+counts/total live count for day 9. Day 9 samples containing CD8+CMV TCR T cells were not included due to lack of live cells (online supplemental figure 5). Gating strategy is shown in online supplemental figure 5A, B. i.v., intravenously; TCR, T-cell receptor.
Figure 5
Figure 5. SUMOylation inhibition enhances NPM1-TCR CD8+T cell activation and in combination with 5-Aza-2’ increases proliferation in vivo.(A) Timeline of in vivo experiment; NSG-mice were engrafted with OCI-AML3 cells for 14 days followed by treatment with 25 mg/kg TAK981 and/or 2.5 mg/kg 5-Aza-2’ or with a buffer control on the indicated days. NPM1-TCR CD8+T cells were injected on day 15 post OCI-AML3 engraftment. Harvesting of bone marrow occurred on days 2, 5 or 8 post inoculation with the NPM1-TCR CD8+Luc T cells and analyzed with spectral flow cytometry. n=4 per group for day 2, n=3 per group for day 5 and 8. (B) Ratio of CD8+count/total live (human and mouse) count in bone marrow. Samples were used for marker analysis (figure 5C) of CD8+NPM1 TCR Luc T cells and OCI-AML3 cells. (C) Bar-graphs represents the percentage of Ki67, IRF1, CD137, PD-1, CD25, HLA-DR, ICOS and LAG3 positive NPM1-TCR CD8+T cells from bone marrow as described in figure 5A. Differences between control (CD8+NPM1 TCR) and treated groups per day were calculated via two-way analysis of variance followed by Dunnett multiple comparison *p<0.05, **p<0.01, ***p<0.001, ****p<0.0001. i.v., intravenously; TCR, T-cell receptor.
Figure 6
Figure 6. SUMOylation inhibition and 5-Aza-2’ improve immunogenicity of tumor cells. (A) Timeline of in vivo experiment; NSG-mice were engrafted with OCI-AML3 cells for 10 days followed by treatment with 25 mg/kg TAK981 and/or 2.5 mg/kg 5-Aza-2’ or with a buffer control on the indicated days. Consequently, bone marrow was harvested on day 18 and analyzed with spectral flow cytometry. (B) Histogram plots show marker expression of HLA-ABC, CD86, CD58, CD54, Ki67 and PD-L1 on OCI-AML3 cells. Plots include the average MFI signal per group. Control (n=4), 5-Aza-2’(n=4), TAK981 (n=4), TAK981 and 5-Aza-2’ (n=2). Samples were removed from analysis if insufficient OCI-AML3 cells were present total count <1000. Gating strategy is shown in online supplemental figure 6. (C) Timeline of in vivo experiment; OCI-AML3 cells were engrafted for 10 days in NSG-mice. Mice were treated with 25 mg/kg TAK981 and/or 2.5 mg/kg 5-Aza-2’ or with a buffer control on indicated days. NPM1-TCR CD8+T cells were injected on day 15 post OCI-AML3 engraftment. OCI-AML3 cells were analyzed from bone marrow harvested on days 2, 5 or 8 post injection with the NPM1-TCR CD8+Luc T cells via spectral flow cytometry. (D) Histogram plots show marker expression of HLA-A2, Ki67 and programmed cell death 1 ligand 1 (PD-L1) on OCI-AML3 cells from mice also inoculated with NPM1-TCR CD8+T cells. Plots include the average Mean Fluorescence Intensity (MFI) signal per group. Samples were removed from analysis if insufficient OCI-AML3 cells were present in sample, indicating a total count of cells <300 for day 2 samples and <1000 for day 5 and 8 samples. Gating strategy is shown in online supplemental figure 6. i.v., intravenously; TCR, T-cell receptor.
Figure 7
Figure 7. Single-cell sequencing of OCI-AML3 tumor cells from OCI-AML3 xenograft model. (A) Timeline of in vivo experiment; OCI-AML3 cells were engrafted for 10 days in NSG-mice. Mice were treated with 25 mg/kg TAK981 and/or 2.5 mg/kg 5-Aza-2’ or with a buffer control on indicated days. NPM1-TCR CD8+T cells were injected on day 15 post OCI-AML3 engraftment. OCI-AML3 cells were harvested from bone marrow 2 days post injection with the NPM1-TCR CD8+Luc T cells and sent for single-cell sequencing. (B) Expression dotplot of single-cell sequencing data obtained from mouse bone marrow implanted with OCI-AML3 cells following treatments indicated in A. Genes for proliferation, MHC expression, cell surface and checkpoint are displayed. i.v., intravenously; MHC, major histocompatibility complex; RNA-seq, RNA sequencing; TCR, T-cell receptor.

References

    1. Shafer P, Kelly LM, Hoyos V. Cancer therapy with TCR-engineered T cells: current strategies, challenges, and prospects. Front Immunol. 2022;13:835762. doi: 10.3389/fimmu.2022.835762. - DOI - PMC - PubMed
    1. Sun Y, Li F, Sonnemann H, et al. Evolution of Cd8+ t cell receptor (Tcr) engineered therapies for the treatment of cancer. Cells. 2021;10:1–19.:2379. doi: 10.3390/cells10092379. - DOI - PMC - PubMed
    1. van der Lee DI, Reijmers RM, Honders MW, et al. Mutated nucleophosmin 1 as immunotherapy target in acute myeloid leukemia. J Clin Invest. 2019;129:774–85.:97482. doi: 10.1172/JCI97482. - DOI - PMC - PubMed
    1. van Amerongen RA, Hagedoorn RS, Remst DFG, et al. Wt1- specific TCRs directed against newly identified peptides install antitumor reactivity against acute myeloid leukemia andovarian carcinoma. J Immunother Cancer. 2022;10:e004409. doi: 10.1136/jitc-2021-004409. - DOI - PMC - PubMed
    1. de Rooij MAJ, Remst DFG, van der Steen DM, et al. A library of cancer testis specific T cell receptors for T cell receptor gene therapy. Mol Ther Oncolytics. 2023;28:1–14. doi: 10.1016/j.omto.2022.11.007. - DOI - PMC - PubMed