. 2024 Nov 6;44(45):e0154242024.
doi: 10.1523/JNEUROSCI.0154-24.2024.

EphB2 Signaling Is Implicated in Astrocyte-Mediated Parvalbumin Inhibitory Synapse Development

Affiliations

EphB2 Signaling Is Implicated in Astrocyte-Mediated Parvalbumin Inhibitory Synapse Development

Samantha N Sutley-Koury et al. J Neurosci. .

Abstract

Impaired inhibitory synapse development is suggested to drive neuronal hyperactivity in autism spectrum disorders (ASD) and epilepsy. We propose a novel mechanism by which astrocytes control the development of parvalbumin (PV)-specific inhibitory synapses in the hippocampus, implicating ephrin-B/EphB signaling. Here, we utilize genetic approaches to assess functional and structural connectivity between PV and pyramidal cells (PCs) through whole-cell patch-clamp electrophysiology, optogenetics, immunohistochemical analysis, and behaviors in male and female mice. While inhibitory synapse development is adversely affected by PV-specific expression of EphB2, a strong candidate ASD risk gene, astrocytic ephrin-B1 facilitates PV→PC connectivity through a mechanism involving EphB signaling in PV boutons. In contrast, the loss of astrocytic ephrin-B1 reduces PV→PC connectivity and inhibition, resulting in increased seizure susceptibility and an ASD-like phenotype. Our findings underscore the crucial role of astrocytes in regulating inhibitory circuit development and discover a new role of EphB2 receptors in PV-specific inhibitory synapse development.

Keywords: EphB receptor; astrocyte; hippocampus; inhibition; parvalbumin; synapse.


Conflict of interest statement

The authors declare no competing financial interests.

Figures

Figure 1.
Figure 1.
Astrocytic ephrin-B1 OE increases PV→PC connectivity. A, B, Graphics showing experimental timelines for astrocytic ephrin-B1 deletion (A) and OE (B). C, Confocal images showing immunolabeling of ephrin-B1 (green) and TdTomato (red) in control and KO astrocytes; scale bars, 50 μm (top panels) and 25 μm (bottom panels). D, Graph shows the quantification of ephrin-B1 mean fluorescence intensity in TdTomato-expressing control and KO astrocytes. Astrocytic ephrin-B1 KO significantly reduces ephrin-B1 immunoreactivity in astrocytes (8–12 images/4 mice per group; t test; ***p < 0.001; Extended Data Table 1-1). E, Graphs show the number of TdTomato-expressing astrocytes in the CA1 hippocampus and SP layer of control and KO mice. Deletion of astrocytic ephrin-B1 does not influence the number of TdTomato-expressing astrocytes in the CA1 hippocampus (61–62 images/4 mice per group; t test; p > 0.05; Extended Data Table 1-1). F, Confocal images showing immunolabeling of ephrin-B1 (green) and GFAP (red) in control and OE astrocytes; scale bars, 50 μm (top panels) and 25 μm (bottom panels). G, The graph shows the quantification of ephrin-B1 mean fluorescence intensity levels of GFAP immunoreactivity in OE astrocytes normalized to the contralateral, noninjected side of the same brain slice. OE significantly increases ephrin-B1 immunoreactivity in astrocytes (11 images/3 mice per group; t test; **p < 0.01; Extended Data Table 1-1). Note that OE images were collected with a lower laser intensity and gain than the WT group to prevent saturation of the ephrin-B1 signal in astrocytes, which resulted in lower ephrin-B1 signal in neurons than in the KO group and their corresponding controls. H, Graphs show the number of GFAP-immunoreactive processes in the SP and SO layers of CA1 hippocampus of noninjected and OE side (14–15 images/4–5 mice per group; t test; p > 0.05; Extended Data Table 1-1). I, Representative image of a biocytin-filled PC in the CA1 hippocampus, labeled with streptavidin (red) following whole-cell recording. Scale bar, 100 μm. J, Representative current traces of the oeIPSC recorded from PCs in hippocampal slices of OE and vehicle-injected mice (control) following the activation of PV interneurons expressing ChR2 with 400 nm LED light. Inset, The black line shows the optically evoked inhibitory currents recorded in a CA1 PC prior to application of gabazine. The red line shows the current response to optical stimulation after bath application of 10 μM gabazine. Bath application of gabazine successfully abolished oeIPCs, indicating that the currents were inhibitory. K, The IO curve shows the average oeIPSC amplitude in OE and control groups plotted against LED power. There is a significant effect of LED power and interaction between genotype and LED power (11–12 cells per group, 7–8 mice per group, two-way ANOVA, Extended Data Table 1-1). L, The graph shows the average peak amplitude of the last five stimulations in the IO curve. The ephrin-B1 OE group shows a significant increase in the peak oeIPSC amplitude (11–12 cells per group; 7–8 mice per group; t test; *p < 0.05; Extended Data Table 1-1). M, Representative traces of the oeIPSCs in control and OE groups, generated during stimulation with a 20 Hz train of 10 LED pulses. N, The graph shows the average oeIPSC amplitude in control and OE during each LED pulse within a 20 Hz train. There is a significant increase in the average oeIPSC amplitude in response to the first two stimuli in OE compared with the control group (8–9 cells per group; 7–8 mice per group; two-way ANOVA; *p < 0.05; ****p < 0.0001; Extended Data Table 1-1). O, The graph shows the average oeIPSCs normalized to the first stimulus in the 20 Hz train to assess short-term plasticity with no significant effect of genotype or interaction (8–9 cells per group, 7–8 mice per group, two-way ANOVA, Extended Data Table 1-1). P, Q, Confocal images of brain slices from control (P) and OE (Q) mice immunolabeled against VGAT (green) and PV (red); scale bar, 50 μm (left panels), 25 μm (middle panels), 10 μm (right panels). R, The graph shows the average number of VGAT/PV colocalized puncta in the OE group normalized to the contralateral noninjected side. The OE group shows a significant increase in VGAT/PV colocalized puncta in the SP layer of the CA1 hippocampus (10 images/5 mice per group; t test; *p < 0.05; **p < 0.01; ***p < 0.001; Extended Data Table 1-1). S, The graph shows the PV immunoreactivity levels within PV interneurons of OE mice. PV levels were not affected by OE of astrocytic ephrin-B1 (19–27 cells/3 mice per group; t test; p > 0.05; Extended Data Table 1-1). T, The graph shows density of PV-expressing cells in the CA1 hippocampus of OE mice compared with the contralateral noninjected side. OE does not significantly affect the density of PV-expressing cells in the CA1 hippocampus (17 images/4 mice per group; t test; p > 0.05; Extended Data Table 1-1). U, Drawing depicts differences in PV→PC connectivity between ephrin-B1 OE and control groups. All data are represented as mean ± SEM. Graphics created with Biorender.com.
Figure 2.
Figure 2.
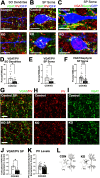
Deletion of astrocytic ephrin-B1 reduces PV perisomatic innervation of CA1 pyramidal neurons. A, B, Confocal images showing VGAT (green) and PV (red) immunostaining on SO dendrites (A) or somata (B) of CA1 excitatory pyramidal neurons labeled with GFP (blue) in control and KO mice. Scale bar, 10 μm. C, Confocal images showing VGAT (red) and gephyrin (green) immunostaining on somata of CA1 excitatory pyramidal neurons labeled with GFP (blue) in control and KO mice. Scale bar, 10 μm. D, E, Graphs represent the average colocalized VGAT/PV puncta on SO dendrites (D) or somata (E) of CA1 excitatory neurons in control and astrocytic ephrin-B1 KO mice. KO mice show a significantly reduced density of colocalized VGAT/PV puncta on SO dendrites and somata of excitatory neurons (13–18 images/4 mice per group; t test; *p < 0.05; Extended Data Table 2-1). F, The graph shows the average number of colocalized VGAT/gephyrin-positive puncta on CA1 excitatory neuronal soma. KO mice show a significant reduction in the density of VGAT-/gephyrin-positive puncta (30–31 cells/4 mice per group; Welch-corrected t test; ***p < 0.0001; Extended Data Table 2-1). G–I, Confocal images of SP layer of CA1 hippocampus immunolabeled against VGAT (green) and PV (red); scale bar, 25 μm. J, The graph shows the average number of colocalized VGAT/PV puncta in the KO group normalized to the control. The KO group shows a reduction in VGAT/PV colocalized puncta in the SP layer of the CA1 hippocampus (6 images/3 mice per group; t test; *p < 0.05; Extended Data Table 2-1). K, The graph shows the PV immunoreactivity levels within PV interneurons of KO and control mice (N). PV levels in PV interneurons were not affected by KO (23–24 cells/4 mice per group, t test, Extended Data Table 2-1). L, The drawing depicts the changes in PV-positive innervation of PC following deletion of astrocytic ephrin-B1. All data are represented as mean ± SEM. Graphics created with Biorender.com.
Figure 3.
Figure 3.
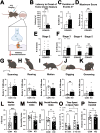
Deletion of astrocytic ephrin-B1 leads to increased seizure susceptibility, anxious and repetitive behaviors, as well as reduced sociability. A, The diagram shows seizure testing paradigm and the mechanism of action of PTZ. B, The graph shows the latency to the onset of tonic–clonic seizure in control and KO mice following injection of 30 mg/kg PTZ at P48+/−2D. Astrocytic ephrin-B1 deletion reduced the latency to the onset of tonic–clonic seizure following PTZ treatment, indicating that KO mice were more susceptible to PTZ-induced seizure (8–12 mice/group; t test; ***p < 0.001; Extended Data Table 3-1). C, D, The duration of events stage 3+ (C) and maximum seizure score achieved (D) as measured by racine seizure scale were increased following deletion of astrocytic ephrin-B1, indicating that deletion of astrocytic ephrin-B1 increased the severity of PTZ-induced seizures (8–12 mice/group; t test or Mann–Whitney test; *p < 0.05; **p < 0.01; Extended Data Table 3-1). E, F, Graphs show the number of seizure events of Stages 2–5 as measured by the Racine seizure scale. KO mice show increased numbers of events at Stages 4 and 5 compared with control mice (8–12 mice/group; Mann–Whitney test; *p < 0.05; **p < 0.01; Extended Data Table 3-1). G–K, Graphs show analysis of common home cage behaviors represented as the number of scanning, grooming, motion, digging, and grooming bouts in 10 min. KO mice displayed an increased number of digging bouts compared with control mice at P28 (J; 12 animals per group; t test; **p < 0.01; Extended Data Table 3-1). L–P, Graphs show the analysis of marble burying (L), social behaviors in three-chamber test (M, N), and anxiety-like behaviors in OF test (O, P; 11–16 mice/group; t test or two-way ANOVA; *p < 0.05; ***p < 0.001; Extended Data Table 3-1). Ephrin-B1 KO mice showed increased obsessive–compulsive behaviors, reduced sociability, and anxiety-like behaviors. All data are represented as mean ± SEM. Graphics created with Biorender.com.
Figure 4.
Figure 4.
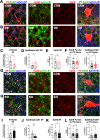
Astrocytic ephrin-B1 levels control localization of EphB in PV boutons but not in the soma of PV interneurons. A, B, G, H, Confocal images from astrocytic ephrin-B1 OE (B) and ephrin-B1 KO (H) and their corresponding controls (CON; A, G) showing PV, pan-EphB, and ephrin-B1 immunofluorescence labeling in the SP layer of CA1 hippocampus and on PV soma. Scale bar, 10 μm. C–F, I–L, Graphs represent the number of colocalized PV/EphB puncta in the SP (C, I), the number of colocalized EphB/Ephrin-B1 puncta in the SP (D, J), the total number of EphB puncta in the SP (E, K), or the number of EphB puncta and EphB/ephrin-B1 colocalization on PV soma (F, L) in OE mice normalized to the contralateral side of the same brain slice (CON; C–F) and KO mice normalized to tamoxifen-injected controls lacking ERT2-cre (CON; I–L). Although OE (E) or deletion (K) of astrocytic ephrin-B1 did not affect the total number of EphB puncta in the SP [7–8 images (OE), 11–16 images (KO)/3-4 mice per group; t test; p > 0.05; Extended Data Table 4-1], the colocalization of EphB with ephrin-B1 and PV boutons was differentially regulated by OE and KO. OE significantly increased EphB/Ephrin-B1 colocalization in the SP (D), while KO reduced EphB/Ephrin-B1 colocalization in the SP [J; 13–15 images (OE), 13–22 images (KO)/3–4 mice per group; t test; *p < 0.05; **p < 0.01; Extended Data Table 4-1]. In contrast, the number of PV-EphB2 colocalized puncta in the SP was significantly reduced in the OE group (C) but increased in KO group (I) compared with their respective controls [7–8 images (OE); 11–14 images (KO)/3–4 mice per group; t test; *p < 0.05; **p < 0.01; Extended Data Table 4-1]. The number of EphB puncta or EphB/ephrin-B1 colocalization on the soma of PV interneurons was unchanged in both OE mice (F) and KO mice (L; 10-25 PV cells/3–4 mice per group, t test, Extended Data Table 4-1). All data are represented as mean ± SEM. Graphics created with Biorender.com.
Figure 5.
Figure 5.
Deletion of EphB2 receptor from PV interneurons enhances PV→PC connectivity and reduces seizure susceptibility. A, Schematics of the generation of EphB2flox mice for conditional deletion of EphB2 using a Cre driver. Exons 2 and 3 were selected as a conditional KO region by inserting the loxP site upstream of Exon 2 and downstream of Exon 3. DNA gel shows the respective genotypes with the WT (209 bp), the heterozygous (HET), and the homozygous EphB2flox (266 bp) bands. B, Confocal images of PV (red) and EphB2 (green) immunolabeling in brain slices from control (top) and PV-EphB2 KO mice (bottom). Scale bar, 25 μm. C, The graph shows quantification of EphB2 immunofluorescence levels in PV interneurons of control and PV-EphB2 KO mice. Deletion of EphB2 from PV interneurons significantly reduced the EphB2 immunofluorescence intensity levels in PV interneurons [n = 3–4 mice; 50–57 cells per group; Welch's t test; ***p < 0.001; Extended Data Table 5-1). D, Representative current traces of the oeIPSCs recorded from excitatory CA1 PCs of mice lacking EphB2 in PV interneurons (PV-EphB2 KO) and control mice. E, IO curve shows the average oeIPSC amplitudes in PV-EphB2 KO and control mice plotted against LED power. Two-way ANOVA showed a significant effect of genotype, LED power, and interaction between genotype and LED power [18 cells, 7–9 mice per group; two-way ANOVA (sphericity assumed, Sidak's post hoc test); *p < 0.05; Extended Data Table 5-1]. F, The graph shows the average peak oeIPSC amplitude in PV-EphB2 KO and control mice with a significant increase in PV-EphB2 KO group (18 cells; 7–9 mice per group; t test; *p < 0.05; Extended Data Table 5-1). G, Representative traces of oeIPSCs from control and PV-EphB2 KO groups during a 20 Hz train of 10 LED pulses. H, The graph shows the average oeIPSC amplitude in control and PV-EphB2 KO cells during each LED pulse within a 20 Hz train. PV-EphB2 KO cells showed a significant increase in the average oeIPSC amplitude during the first stimulus. I, The graph shows the average oeIPSCs normalized to the first stimulus in the 20 Hz train to assess the plasticity with no significant effect of genotype or interaction (18 cells, 7–9 mice per group, two-way ANOVA, sphericity assumed, Sidak's post hoc test, Extended Data Table 5-1). J, The graph shows latency of the onset to tonic–clonic seizure in control and EphB2 KO mice. KO mice showed an increased latency to seizure (9–10 mice per group; Welch-corrected t test; *p < 0.05; Extended Data Table 5-1). K, The graph shows the duration of seizure events greater than three, which only occurred in control mice (9–10 mice per group; Welch-corrected t test; p > 0.05; Extended Data Table 5-1). L, The graph shows the number of animals with tonic–clonic seizures during the test. Four out of ten control mice displayed tonic–clonic seizures, while none of the nine KO mice exhibited tonic–clonic seizures. WT mice were six times more likely to exhibit tonic–clonic seizures than KO mice [odds ratio (OR), 6]. M, N, Graphs show the time spent in OF during the first and second 5 min of the 10 min test and overall distance traveled during the entire 10 min of the test in control and KO mice. M, EphB2 KO mice had more exploratory behaviors with higher overall distance traveled (N; 9–13 mice per group; t test; **p < 0.01; Extended Data Table 5-1). O, The graph shows marbles buried in the marble burying test, which was not significantly different between control and KO mice. All data are represented as mean ± SEM. Graphics created with Biorender.com.
Figure 6.
Figure 6.
Deletion of EphB2 receptors from PV interneurons enhances PV→PC structural connectivity and perisomatic innervation. A, B, Confocal images of brain slices from (A) control and (B) PV-EphB2 KO immunolabeled against VGAT (green) and PV (red); scale bar, 50 μm (left panels), 25 μm (middle panels), and 10 μm (right panels). C, The graph shows the average number of colocalized VGAT/PV puncta in the SP layer of the CA1 hippocampus of control, PV-EphB2+/−, and PV-EphB2−/− KO mice normalized to control. PV-EphB2−/− KO mice showed a significant increase in the number of VGAT/PV colocalized puncta compared with controls (19–46 images/5–13 mice per group; Brown–Forsythe and Welch ANOVA test; Dunnett's multiple-comparison test; *p < 0.05; Extended Data Table 6-1). D, The graph shows the average PV immunoreactivity in control, PV-EphB2+/−, and PV-EphB2−/− KO mice normalized to control. PV immunoreactivity was increased in mice lacking one or both copies of EphB2 (72–165 cells/group; 4–13 mice/group; Brown–Forsythe and Welch ANOVA test; Dunnett's multiple-comparison test; **p < 0.01; ****p < 0.0001; Extended Data Table 6-1). E, The graph shows average PV cell density in control and PV-EphB2−/− KO mice. There were no significant differences in the number of PV cells detectable by immunostaining (15 images/5 mice per group; t test; p > 0.05; Extended Data Table 6-1). F, The graphic shows the changes in PV→PC connectivity in PV-EphB2 KO mice. G, H, Electron microscope images of the CA1 SP layer of (G) control and (H) PV-EphB2−/− KO mice taken at 8,000×. Scale bar, 1 μm. I–L, Graphs show the density of perisomatic presynaptic sites (I), active zone density (J), the number of active zones per presynaptic bouton (K), and the density of glial processes (L). The density of perisomatic presynaptic sites and glial processes was not changed following EphB2 KO in PV cells (23 images/3 mice per group; t test; p > 0.05; Extended Data Table 6-1). However, the number of active zones was significantly increased in KO mice (23 images/3 mice per group; t test; *p < 0.05; **p < 0.01; Extended Data Table 6-1). M–P, Graphs show the average size of perisomatic presynaptic sites (M), presynaptic size distribution (N), average size of glial processes (O), and glial surface per neuronal soma (P) in control and KO mice. EphB2 KO mice showed an increased average size of presynaptic boutons (23 images/3 mice per group; t test; ****p < 0.0001; Extended Data Table 6-1) and a higher number of larger presynaptic sites (23 images/3 mice per group; 2-way ANOVA; Sidak multiple-comparison test; *p < 0.05; **p < 0.01; ***p < 0.001; Extended Data Table 6-1). EphB2 KO also showed a significantly larger size of glial processes and the area of glial surface per neuronal soma (23 images/3 mice per group; t test; ****p < 0.0001; Extended Data Table 6-1). All data are represented as mean ± SEM. Graphics created with Biorender.com.
Figure 7.
Figure 7.
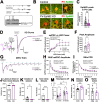
Astrocytic ephrin-B1 OE does not further enhance PV→PC connectivity in mice lacking EphB2 in PV interneurons. A, Representative current traces of oeIPSCs recorded from excitatory CA1 PCs of mice overexpressing astrocytic ephrin-B1 but lacking EphB2 in PV interneurons (PV-EphB2 KO+AAV-EfnB1) and vehicle-injected mice lacking EphB2 in PV interneurons (PV-EphB2 KO+AAV-TdT). B, The IO curve shows the average oeIPSC amplitude in PV-EphB2 KO+AAV-EfnB1 and in PV-EphB2 KO+AAV-TdT mice plotted against LED power. OE of astrocytic ephrin-B1 in mice lacking EphB2 in PV interneurons did not significantly change the oeIPSC amplitude compared with control mice [n = 10–12 cells, 5–6 mice per group, 2-way ANOVA (sphericity not assumed, Sidak post hoc test), Extended Data Table 7-1]. C, The graph shows the average peak amplitude achieved during generation of the IO curve. oeIPC amplitudes recorded in CA1 PCs of PV-EphB2 KO mice overexpressing astrocytic ephrin-B1 were not significantly different from those recorded in PCs of PV-EphB2 KO mice injected with control AAV-TdT (n = 11–12 cells, 5–6 mice per group, t test, Extended Data Table 7-1). D, Representative traces of the oeIPSCs from PV-EphB2 KO+AAV-EfnB1 and PV-EphB2 KO + AAV-TdT cells, generated during stimulation with a 20 Hz train of 10 LED pulses. E, The graph shows the average oeIPSC amplitude in PV-EphB2 KO+AAV-EfnB1 and PV-EphB2 KO+AAV-TdT cells during each LED pulse within a 20 Hz train. There was no significant genotype or interaction effect. F, The graph shows the average oeIPSCs normalized to the first stimulus in the 20 Hz train to assess the plasticity with no significant effect of genotype; however, there was a significant interaction effect (E, F, 9–10 cells, 5–6 mice per group, 2-way ANOVA, Extended Data Table 7-1). G, H, Confocal images of brain slices from (H) EphB2 KO+AAV-EfnB1 mice (KO+OE) and (G) the contralateral noninjected side (KO) of the same brain slice immunolabeled against VGAT (green) and PV (red); scale bar, 25 μm. (I) The graph shows the number of VGAT/PV colocalized puncta in the SP normalized to the contralateral side of the same brain slice. OE of astrocytic ephrin-B1 in mice lacking EphB2 in PV interneurons did not affect the number of VGAT/PV presynaptic sites (22 images/6 mice per group, t test, Extended Data Table 7-1). All data are represented as mean ± SEM. Graphics created with Biorender.com.
Figure 8.
Figure 8.
Astrocytes control PV→PC connectivity and inhibition in vivo through regulating EphB2 signaling in PV boutons: deletion of astrocytic ephrin-B1 impaired PV→PC structural connectivity and impaired inhibition in vivo, leading to increased seizure susceptibility, deficits in sociability, anxiety-like behaviors, and repetitive behaviors. Conversely, OE of astrocytic ephrin-B1 increased PV→PC structural and functional connectivity. Deletion of EphB2 receptor in PV cells also increased PV→PC structural and functional connectivity, resulting in reduced seizure susceptibility and increased exploratory behaviors, indicative of reduced anxiety. Deletion of astrocytic ephrin-B1 in mice lacking EphB2 in PV cells did not lead to further enhancement of PV→PC structural or functional connectivity, suggesting that astrocytic ephrin-B1 controls PV→PC connectivity through a mechanism involving EphB2 signaling in PV cells.

References

    1. Abrahams BS, Arking DE, Campbell DB, Mefford HC, Morrow EM, Weiss LA, Menashe I, Wadkins T, Banerjee-Basu S, Packer A (2013) SFARI gene 2.0: a community-driven knowledgebase for the autism spectrum disorders (ASDs). Mol Autism 4:36. 10.1186/2040-2392-4-36 - DOI - PMC - PubMed
    1. Ali Rodriguez R, Joya C, Hines RM (2018) Common ribs of inhibitory synaptic dysfunction in the umbrella of neurodevelopmental disorders. Front Mol Neurosci 11:132. 10.3389/fnmol.2018.00132 - DOI - PMC - PubMed
    1. Allen NJ, Eroglu C (2017) Cell biology of astrocyte-synapse interactions. Neuron 96:697–708. 10.1016/j.neuron.2017.09.056 - DOI - PMC - PubMed
    1. Angoa-Pérez M, Kane MJ, Briggs DI, Francescutti DM, Kuhn DM (2013) Marble burying and nestlet shredding as tests of repetitive, compulsive-like behaviors in mice. J Vis Exp 82:50978. - PMC - PubMed
    1. Association AP (2013) Diagnostic and statistical manual of mental disorders. Washington, DC: American Psychiatric Publishing.