. 2024 Dec;115(12):3902-3914.
doi: 10.1111/cas.16336. Epub 2024 Sep 26.

Loss of USP10 promotes hepatocellular carcinoma proliferation by regulating the serine synthesis pathway through inhibition of LKB1 activity

Affiliations

Loss of USP10 promotes hepatocellular carcinoma proliferation by regulating the serine synthesis pathway through inhibition of LKB1 activity

Chi Ma et al. Cancer Sci. 2024 Dec.

Abstract

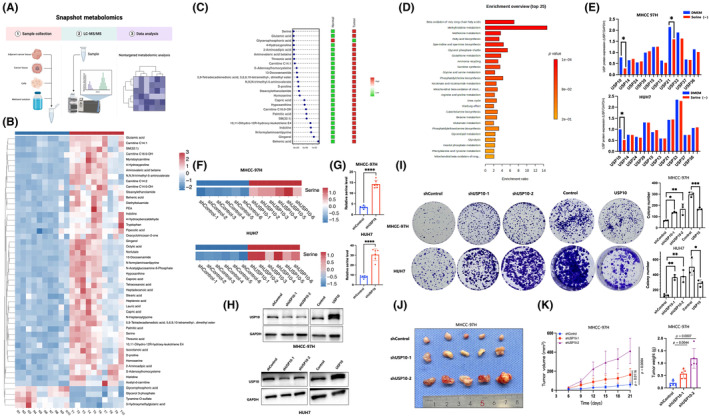
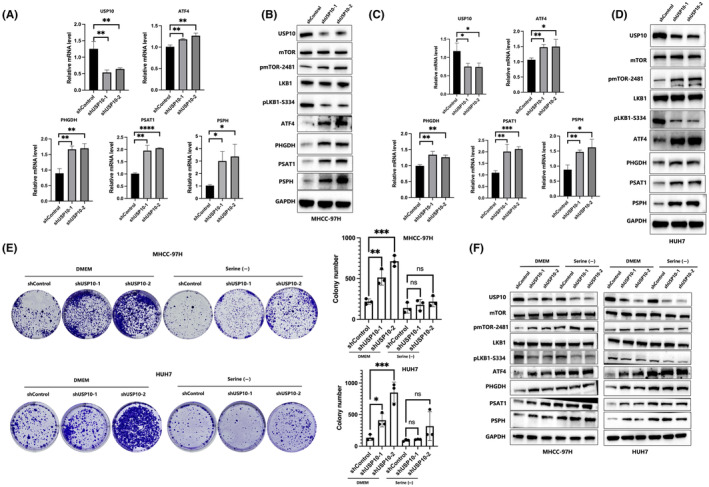
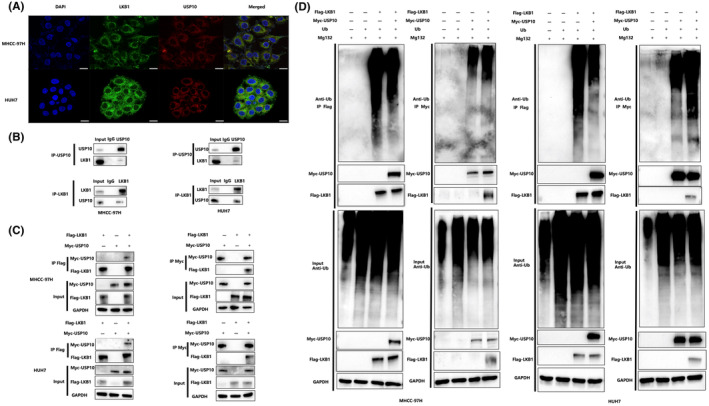
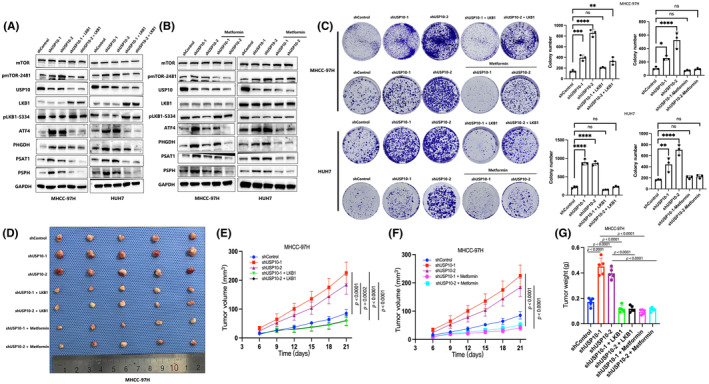
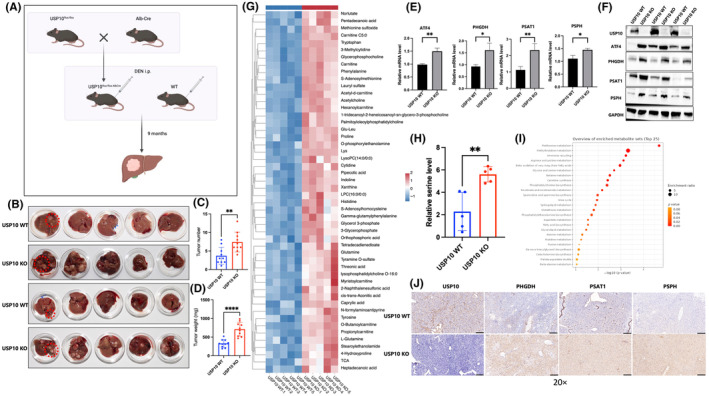
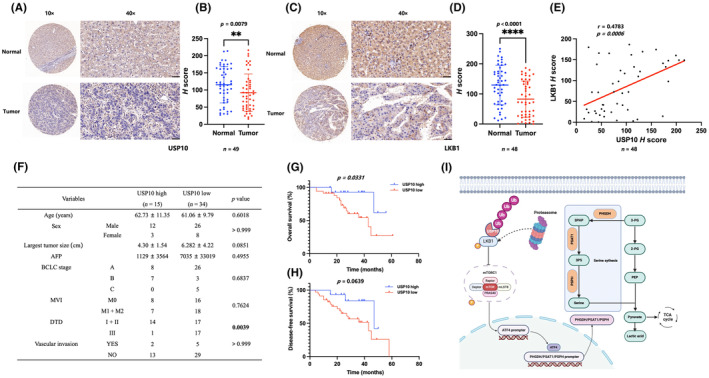
Metabolic dysregulation is emerging as a critical factor in tumorigenesis, and reprogramming of serine metabolism has been identified as an essential factor in the progression of hepatocellular carcinoma (HCC). Studies have shown that LKB1 deficiency can activate mTOR to upregulate the serine synthesis pathway (SSP) and promote tumor progression. Our team discovered that ubiquitin-specific protease 10 (USP10) can inhibit HCC proliferation through mTOR, but its relationship with SSP needs further investigation. The metabolite assays revealed a significant increase in serine content in HCC tissues. Through the LKB1/mTOR/activating transcription factor 4 (ATF4) axis, loss of USP10 may increase serine biosynthesis and promote the proliferation of HCC in vitro and in vivo. Furthermore, it was found that USP10 could activate LKB1 through deubiquitination. Analyzing clinical HCC tissues revealed a positive correlation between USP10 and LKB1. Additionally, those with high expression of USP10 in HCC tissues showed a better degree of tumor differentiation and longer overall survival time. Moreover, we found increased expression of both serine and its synthase in liver tumor tissues of USP10 liver-specific KO mice. Loss of USP10 inhibits the activity of LKB1, contributing to the stimulation of the mTOR/ATF4 axis and SSP and then promoting the proliferation of HCC. This work presents a novel approach for serine-targeted treatment in HCC.

Keywords: LKB1; USP10; hepatocellular carcinoma; metabolic reprogramming; serine synthesis pathway.


Conflict of interest statement

The authors declare no conflict of interest.

Figures

FIGURE 1
FIGURE 1
Increased serine expression in human hepatocellular carcinoma (HCC) tissues and ubiquitin‐specific protease 10 (USP10) deficiency promote HCC proliferation. (A) Brief flowchart of untargeted liquid chromatography–mass spectrometry (LC‐MS). (B) Heatmap analysis of the top 50 differential metabolites between 10 pairs of human HCC and paracancerous tissues based on untargeted LC‐MS analysis, all of which were postoperative samples and pathologically confirmed, with red indicating elevated and blue indicating decreased. (C) A dot‐bar graph showing the top 25 statistically different metabolites in HCC and paracancerous tissues according to p values (green, decrease; red, increase). (D) Enrichment analysis of 156 statistically differential metabolites. (E) Grayscale analysis using ImageJ software was undertaken to quantify the protein fold changes of USP/GAPDH. The results of three replicate experiments were assessed using a t‐test; *p < 0.05. (F) Using LC‐MS, we detected the serine content in MHCC‐97H shUSP10, HUH7 shUSP10, and shControl cells. The resulting heatmap displays the differences between the groups, with red indicating elevated levels and blue indicating decreased levels. (G) The histogram shows the mean serine content for both groups with SD. Statistical analysis was carried out using a t‐test; ****p < 0.0001. (H) Transfected USP10‐stable cell lines were constructed, and changes in protein expression were confirmed through western blot analysis. (I) Cloning experiments were repeated three times to determine the impact of USP10 on the proliferative ability of HCC cells, data are presented as mean ± SD. *p < 0.05, **p < 0.01, ***p < 0.001. (J) MHCC‐97H cells were subcutaneously implanted into nude mice in order to validate the impact of USP10 knockdown on the proliferative ability of HCC. (K) Tumor growth was monitored every 3 days, starting 6 days after tumor implantation, and the volume was calculated. After 21 days, the tumors were dissected and weighed. Values are expressed as mean ± SD and were analyzed using a t‐test. Figure 1A was created with BioRender. [Correction added on 14 November 2024, after first online publication. The figure legend has been corrected in this version.]
FIGURE 2
FIGURE 2
Ubiquitin‐specific protease 10 (USP10) affects the serine synthesis pathway through the LKB1/mTOR/ATF4 axis. (A, C) Quantitative RT‐PCR was used to verify changes in transcript levels of ATF4, PHGDH, PSAT1, and PSPH in MHCC‐97H and HUH7 cells after USP10 knockdown. The experiment was repeated three times, and the results are expressed as mean ± SD. Statistical analysis was undertaken using a t‐test; *p < 0.05, **p < 0.01, ***p < 0.001, ****p < 0.0001. (B, D) Western blot analysis was used to verify the protein expression of mTOR, pmTOR‐2481, LKB1, pLKB1‐S334, ATF4, PHGDH, PSAT1, and PSPH in MHCC‐97H and HUH7 cells after USP10 knockdown. (E) Clone formation assays were repeated three times and verified the impact of USP10 knockdown on the proliferation of hepatocellular carcinoma (HCC) cells after serine deletion. Data are presented as mean ± SD. *p < 0.05, **p < 0.01, ***p < 0.001. (F) The impact of USP10 knockdown following serine deletion on the protein expression changes of mTOR, pmTOR‐2481, LKB1, pLKB1‐S334, ATF4, PHGDH, PSAT1, and PSPH in HCC cells was verified by western blot analysis. ns, not significant.
FIGURE 3
FIGURE 3
Interaction between ubiquitin‐specific protease 10 (USP10) and LKB1. (A) Fluorescence confocal microscopy was used to localize USP10 (red) and LKB1 (green) in MHCC‐97H and HUH7 cells, with nuclei stained in blue. Scale bars, 50 μm. (B) Immunoprecipitation (IP) of cell lysates from MHCC‐97H and HUH7 was undertaken using IgG, USP10, or LKB1 Abs, followed by western blot analysis with USP10 and LKB1 Abs. (C) MHCC‐97H and HUH7 cells were transfected with Myc‐USP10 and Flag‐LKB1 plasmids individually or in combination. After 48 h, cell lysates were immunoprecipitated using magnetic beads labeled with Myc or Flag, followed by western blot analysis utilizing Myc, Flag, or GAPDH Abs. (D) In the MHCC‐97H and HUH7 cell lines, we transfected Myc‐USP10, Flag‐LKB1, and Ub plasmids individually or in combination for 48 h. We added MG132 (1 μL/mL) 6 h before cell lysis. The cells were then lysed and immunoprecipitated using magnetic beads labeled Myc or Flag. We incubated the beads with Abs against Ub, Myc, Flag, or GAPDH to detect ubiquitylation by western blot analysis.
FIGURE 4
FIGURE 4
Activation of LKB1 reverses the effect of ubiquitin‐specific protease 10 (USP10) deletion on the serine synthesis pathway in hepatocellular carcinoma (HCC). (A, B) Western blot analysis was undertaken to detect changes in protein expression of mTOR, pmTOR‐2481, LKB1, pLKB1‐S334, ATF4, PHGDH, PSAT1, and PSPH in MHCC‐97H and HUH7 cell lines after transfection with LKB1 plasmid or application of metformin following USP10 knockdown. (C) Clone formation assays were repeated three times to determine the impact of USP10 knockdown on HCC cell proliferation after applying LKB1 plasmid or metformin. Data are presented as mean ± SD. *p < 0.05, **p < 0.01, ***p < 0.001, ****p < 0.0001. (D) A tumor formation assay was carried out in nude mice to confirm the effect of USP10 knockdown on HCC cell proliferation after using LKB1 plasmid or metformin. (E–G) Tumor growth was assessed every 3 days starting from day 6 after tumor implantation, and tumor volume was subsequently estimated. After 7 days of implantation, metformin was injected i.p. (dissolved in sterile distilled water, 250 mg/kg, once every 2 days). Tumors were dissected on day 21 and weighed; mean ± SD values were statistically analyzed using a t‐test. ns, not significant.
FIGURE 5
FIGURE 5
Ubiquitin‐specific protease 10 (USP10) KO mice confirm that USP10 deletion upregulates the serine synthesis pathway. (A) Flowchart of orthotopic hepatoma model in USP10 liver‐specific KO mice. (B) Diethylnitrosamine (DEN) induced the mice, and the liver was retrieved after 9 months. (C, D) Bar graphs compare the number and weight of tumors in both groups. Values are expressed as mean ± SD and t‐tests were used to compare the groups. **p < 0.01, ****p < 0.0001. (E, F) Transcriptional and protein levels of ATF4, PHGDH, PSAT1, and PSPH were compared between liver tumors of USP10 KO and WT mice using quantitative RT‐PCR and western blot analysis. Statistical analyses were undertaken using a t‐test, and values were expressed as mean ± SD. *p < 0.05, **p < 0.01. (G) Heatmap analysis displays the top 50 metabolites with significant differences in liver tumors between USP10 KO and WT groups. Red denotes elevated, blue denotes decreased. (H) A liquid chromatography–mass spectrometry assay was undertaken to measure serine expression between the groups, and the differences are shown by bar graphs, **p < 0.01. (I) Enrichment analysis was undertaken on 135 metabolites with significant differences. (J) Immunohistochemical staining was carried out on liver cancer tissues between the groups to detect the content of USP10, PHGDH, PSAT1, and PSPH. Scale bars, 50 μm. Figure 5A was created with BioRender. [Correction added on 14 November 2024, after first online publication. The figure legend has been corrected in this version.]
FIGURE 6
FIGURE 6
Ubiquitin‐specific protease 10 (USP10) expression is decreased in hepatocellular carcinoma (HCC) tissues and is linked to an unfavorable prognosis. (A–D) Immunohistochemical staining was carried out on microarrays of HCC and paracancerous tissue to detect the content of USP10 and LKB1. Histograms display the differences in H‐scores between the two groups, with mean ± SD values. Statistical significance was indicated by t‐tests. **p < 0.01, ****p < 0.0001. Scale bars, 50 μm. (E) Correlation between USP10 and LKB1 protein expression was analyzed using the HCC tissue microarray H‐score, and Pearson's correlation coefficient (r) was calculated. (F) Clinical information for each group was statistically analyzed using t‐tests, χ2‐tests, or Fisher's exact probability method, with a significance level of p < 0.05. (G, H) The log‐rank test was used to compare overall survival and disease‐free survival between groups, with a significance level of p < 0.05. (I) A diagram illustrating the proposed mechanism. AFP, alpha‐fetoprotein; BCLC, Barcelona Clinic Liver Cancer; DTD, degree of tumor differentiation; MVI, microvascular invasion. Figure 6I was created with BioRender. [Correction added on 14 November 2024, after first online publication. The figure legend has been corrected in this version.]

Similar articles

Cited by

References

    1. Wen N, Cai Y, Li F, et al. The clinical management of hepatocellular carcinoma worldwide: a concise review and comparison of current guidelines: 2022 update. Biosci Trends. 2022;16(1):20‐30. doi:10.5582/bst.2022.01061 - DOI - PubMed
    1. Anstee QM, Reeves HL, Kotsiliti E, Govaere O, Heikenwalder M. From NASH to HCC: current concepts and future challenges. Nat Rev Gastroenterol Hepatol. 2019;16(7):411‐428. doi:10.1038/s41575-019-0145-7 - DOI - PubMed
    1. Du D, Liu C, Qin M, et al. Metabolic dysregulation and emerging therapeutical targets for hepatocellular carcinoma. Acta Pharm Sin B. 2022;12(2):558‐580. doi:10.1016/j.apsb.2021.09.019 - DOI - PMC - PubMed
    1. Ni Z, He J, Wu Y, et al. AKT‐mediated phosphorylation of ATG4B impairs mitochondrial activity and enhances the Warburg effect in hepatocellular carcinoma cells. Autophagy. 2018;14(4):685‐701. doi:10.1080/15548627.2017.1407887 - DOI - PMC - PubMed
    1. Vander Heiden MG, Cantley LC, Thompson CB. Understanding the Warburg effect: the metabolic requirements of cell proliferation. Science. 2009;324(5930):1029‐1033. doi:10.1126/science.1160809 - DOI - PMC - PubMed

MeSH terms