. 2024 Sep 25;9(1):257.
doi: 10.1038/s41392-024-01962-6.

Characterization of ferroptosis-triggered pyroptotic signaling in heart failure

Affiliations

Characterization of ferroptosis-triggered pyroptotic signaling in heart failure

Xukun Bi et al. Signal Transduct Target Ther. .

Abstract

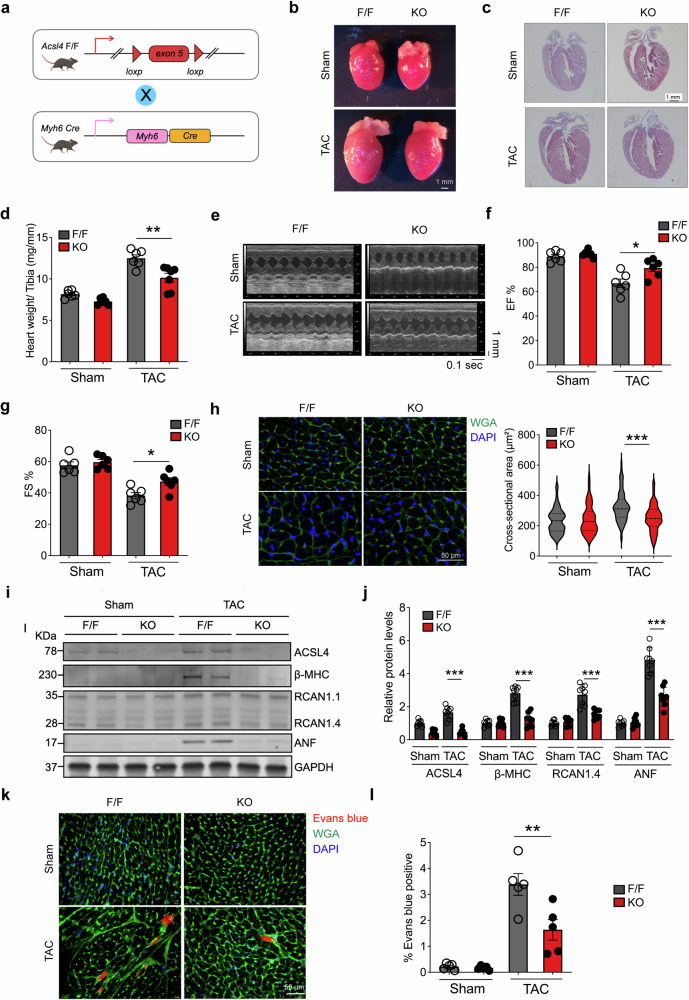
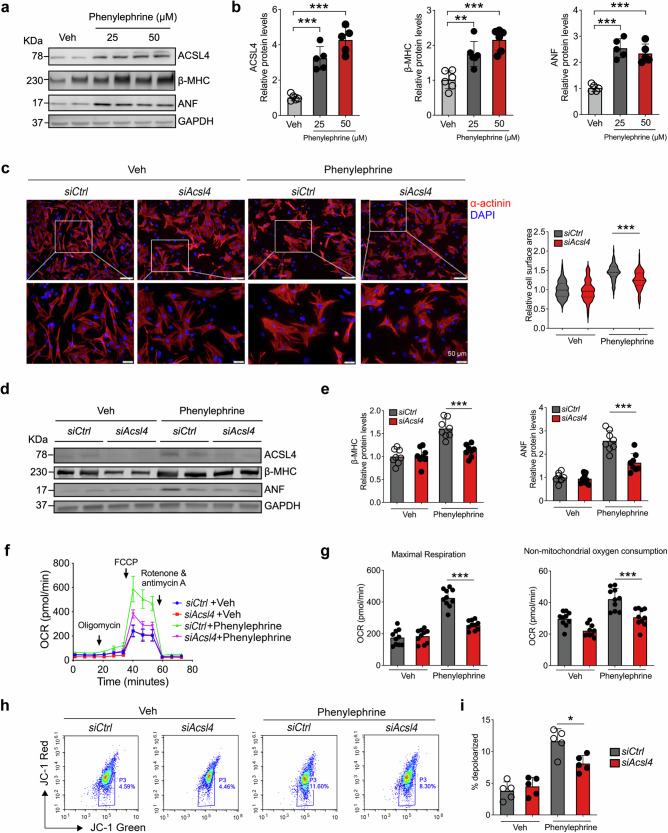
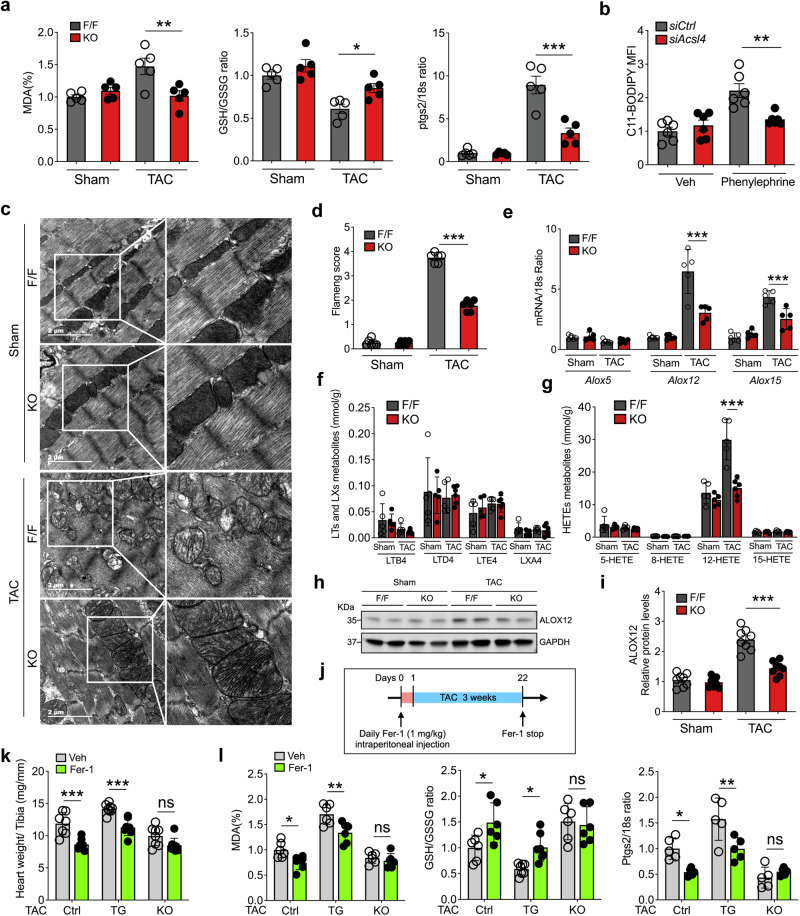
Pressure overload-induced cardiac hypertrophy is a common cause of heart failure (HF), and emerging evidence suggests that excessive oxidized lipids have a detrimental effect on cardiomyocytes. However, the key regulator of lipid toxicity in cardiomyocytes during this pathological process remains unknown. Here, we used lipidomics profiling and RNA-seq analysis and found that phosphatidylethanolamines (PEs) and Acsl4 expression are significantly increased in mice with transverse aortic constriction (TAC)-induced HF compared to sham-operated mice. In addition, we found that overexpressing Acsl4 in cardiomyocytes exacerbates pressure overload‒induced cardiac dysfunction via ferroptosis. Notably, both pharmacological inhibition and genetic deletion of Acsl4 significantly reduced left ventricular chamber size and improved cardiac function in mice with TAC-induced HF. Moreover, silencing Acsl4 expression in cultured neonatal rat ventricular myocytes was sufficient to inhibit hypertrophic stimulus‒induced cell growth. Mechanistically, we found that Acsl4-dependent ferroptosis activates the pyroptotic signaling pathway, which leads to increased production of the proinflammatory cytokine IL-1β, and neutralizing IL-1β improved cardiac function in Acsl4 transgenic mice following TAC. These results indicate that ACSL4 plays an essential role in the heart during pressure overload‒induced cardiac remodeling via ferroptosis-induced pyroptotic signaling. Together, these findings provide compelling evidence that targeting the ACSL4-ferroptosis-pyroptotic signaling cascade may provide a promising therapeutic strategy for preventing heart failure.


Conflict of interest statement

The authors declare no competing interests.

Figures

Fig. 1
Fig. 1
TAC-induced cardiac hypertrophy leads to an upregulation of Acsl4. a Diagram depicting the strategy for lipidomics profiling and RNA-seq analysis 3 weeks after performing transverse aortic constriction (TAC) or sham surgery. Also depicted is cardiac outcome, with TAC-induced cardiac hypertrophy progressing to heart failure (Created with BioRender.com). b Partial least squares discriminant analysis (PLS-DA) scores plotted for the lipidomics data for left ventricular tissue in sham-operated and TAC-operated mice (n = 5 mice/group). c Distribution of the indicated classes of metabolites detected in cardiac tissues using targeted lipidomics profiling. d Summary of the relative change in the levels of the indicated lipid classes measured in TAC-operated mice relative to sham-operated mice; upregulated and downregulated lipid species are indicated in red and blue, respectively. Note the break in the y-axis. e Heatmap summarizing the fold change in the relative abundance of the indicated phosphatidylethanolamines (PEs) metabolites in sham-operated and TAC-operated mice (n = 5 mice/group). f Schematic diagram (top) depicting the metabolic pathways mediated by ACSL family members, and heatmaps of fragments per kilobase per million mapped fragments (FPKM, bottom left) and log2 fold change (FC, bottom right) for the indicated Acsl genes based on the RNA-seq data. Western blot analysis (g) and quantification (h) of the indicated proteins in the heart tissue of sham-operated and TAC-operated mice (n = 10 mice/group). i Sections of adult mouse ventricular cardiomyocytes obtained from sham-operated and TAC-operated mice were immunostained for ACSL4 (red); the nuclei were counterstained with DAPI (blue). Scale bar, 20 μm. Shown at the right is the mean fluorescence intensity (MFI) of ACSL4 immunostaining normalized to DAPI intensity measured in the indicated groups (n = 5 mice/group). In this and subsequent figures, unless indicated otherwise summary data are presented as the mean ± SEM. *P < 0.05, ***P < 0.001, and ns, not significant (unpaired Student’s t-test)
Fig. 2
Fig. 2
Cardiomyocyte-specific Acsl4 transgenic mice have increased cardiac pathology in response to TAC-induced pressure overload. a Strategy for generating Acsl4 TG mice overexpressing Acsl4 selectively in cardiomyocytes. Myh6-Cre and/or loxP-stop-loxP-Acsl4 mice were used as a control (Ctrl) group. b Images of whole hearts obtained from sham-operated and TAC-operated Ctrl and TG mice. Scale bar, 1 mm. c Heart sections were prepared from sham-operated and TAC-operated Ctrl and TG mice and stained with Masson’s trichrome to measure cardiac fibrosis; scale bar, 1 mm. d Summary of the heart weight/tibia length ratio measured in sham-operated and TAC-operated Ctrl and TG mice (n = 6 mice/group). M-mode echocardiography images (e) and summary of ejection fraction (f; n = 6 mice/group) and fractional shortening (g; n = 6 mice/group) measured in the indicated mice. h Heart sections were prepared from the indicated mice and stained with wheat germ agglutinin (WGA, green) in order to calculate cardiomyocyte cross-sectional area; the nuclei were counterstained with DAPI (blue). Scale bar, 50 μm. Shown at the right is a violin plot summarizing the relative cardiac cell cross-sectional area measured in the indicated mice (n = 81–92 cardiomyocytes from 6 mice/group). Western blot analysis (i) and quantification (j) of ACSL4 and the cardiac hypertrophy markers β-MHC (β-myosin heavy chain), RCAN1.4, and ANF (atrial natriuretic factor) measured in hearts isolated from sham-operated and TAC-operated Ctrl and TG mice (n = 5 mice/group). **P < 0.01 and ***P < 0.001 (two-way ANOVA followed by Tukey’s multiple comparisons test)
Fig. 3
Fig. 3
Pharmacologically inhibiting Acsl4 and knocking out Acsl4 selectively in cardiomyocytes protect against TAC-induced heart failure. a Strategy for generating cardiomyocyte-specific Acsl4 knockout (Acsl4 KO) mice. Acsl4flox/flox (Acsl4 F/F) mice were used as the control group. b Images of whole hearts obtained from sham-operated and TAC-operated Acsl4 F/F and Acsl4 KO mice; scale bar, 1 mm. c Heart sections were prepared from sham-operated and TAC-operated Acsl4 F/F and Acsl4 KO mice and stained with Masson’s trichrome; scale bar, 1 mm. d Summary of the heart weight/tibia length ratio in sham-operated and TAC-operated Acsl4 F/F and Acsl4 KO mice (n = 6 mice/group). M-mode echocardiography images (e) and summary of ejection fraction (f; n = 6 mice/group) and fractional shortening (g; n = 6 mice/group) measured in the indicated mice. h Heart sections were prepared from the indicated mice and stained with WGA (green) to calculate cardiomyocyte cross-sectional area; the nuclei were counterstained with DAPI (blue). Scale bar, 50 μm. Shown at the right is a violin plot summarizing the relative cardiac cell cross-sectional area measured in the indicated mice (n = 85–112 cardiomyocytes from 6 mice/group). Western blot analysis (i) and quantification (j) of ACSL4, β-MHC, RCAN1.4, and ANF measured in hearts isolated from the indicated mice (n = 8 mice/group). k Sham-operated and TAC-operated Acsl4 F/F and Acsl4 KO mice received an i.p. injection of Evans blue dye, and heart sections were subsequently prepared and stained with WGA (green); Evans blue‒positive cardiomyocytes are indicated in red, and the nuclei were counterstained with DAPI (blue). Scale bar, 50 μm. Summary of Evans blue‒positive cells in heart sections obtained from the indicated mice treated as shown in (l); (n = 5 mice/group). *P < 0.05, **P < 0.01, and ***P < 0.001 (two-way ANOVA followed by Tukey’s multiple comparisons test)
Fig. 4
Fig. 4
Acsl4 is required for the hypertrophic growth of neonatal rat ventricular myocytes. Western blot analysis (a) and quantification (b) of the protein levels of ACSL4 and the hypertrophy markers β-MHC and ANF measured in cultured neonatal rat ventricular myocytes (NRVMs) treated with vehicle, 25 μM phenylephrine, or 50 μM phenylephrine for 24 h (n = 5 biological replicates/group). c Representative fluorescence images of NRVMs immunostained for α-actinin; where indicated, the cells were transfected with a control siRNA (siCtrl) or an Acsl4-targeted siRNA (siAcsl4) after 24 h in the presence of vehicle or 50 μM phenylephrine; scale bars, 50 μm. Shown at the right is a violin plot summarizing the relative cross-sectional area of NRVMs treated as indicated (n = 90–94 cardiomyocytes quantified from 5 biological replicates/group). Western blot analysis (d) and quantification (e) of ACSL4, β-MHC, and ANF measured in NRVMs treated as indicated (n = 8 biological replicates/group). Time course of oxygen consumption rate (f) and summary of maximal respiration (g, left) and non-mitochondrial oxygen consumption rate (g, right) measured using Seahorse analysis in NRVMs treated as indicated (n = 10 biological replicates/group). Flow cytometry analysis using JC-1 to measure mitochondrial membrane depolarization (h) and summary of the percentage of cells with depolarized mitochondrial membranes (i) in the indicated groups (n = 5 biological replicates/group). *P < 0.05, **P < 0.01, and ***P < 0.001 (one-way or two-way ANOVA followed by Tukey’s multiple comparisons test)
Fig. 5
Fig. 5
Acsl4-dependent ferroptosis exacerbates TAC-induced cardiac hypertrophy. a Summary of the relative change in the ferroptosis markers MDA (malondialdehyde), the GSH/GSSG (reduced glutathione/oxidized glutathione) ratio, and Ptgs2 (prostaglandin-endoperoxide synthase 2) mRNA measured in sham-operated and TAC-operated Acsl4 F/F and Acsl4 KO mice, normalized to the sham-operated Acsl4 F/F group (n = 5 mice/group). b Flow cytometry analysis using C11-BODIPY to measure lipid peroxidation in vehicle- or phenylephrine-treated NRVMs transfected with siCtrl or siAcsl4. Shown is the summary of C11-BODIPY mean fluorescence intensity (MFI) measured in the indicated cells (n = 6 biological replicates/group). Representative transmission electron microscopy images (c) and corresponding relative mitochondrial Flameng scores (d) measured in left ventricular tissues obtained from sham-operated and TAC-operated Acsl4 F/F and Acsl4 KO mice; scale bars, 2 μm. e Summary of Alox5, Alox12, and Alox15 mRNA measured in sham-operated and TAC-operated Acsl4 F/F and Acsl4 KO mice, normalized to 18S rRNA (n = 5 mice/group). Summary of the indicated oxylipins (f) and HETEs (g) measured in heart tissues isolated from sham-operated and TAC-operated Acsl4 F/F and Acsl4 KO mice (n = 5–6 mice/group). Western blot analysis (h) and quantification (i) of ALOX12 protein measured in heart tissues isolated from sham-operated and TAC-operated Acsl4 F/F and Acsl4 KO mice (n = 8 mice/group). j Diagram depicting the strategy for treating mice with daily injections of the ferroptosis inhibitor ferrostatin-1 (Fer-1, 1 mg/kg/day) or vehicle one day before and for three weeks after TAC surgery. k Summary of the heart weight/tibia length ratio measured in vehicle-treated and Fer-1‒treated TAC-operated control, Acsl4 TG, and Acsl4 KO mice (n = 7–8 mice/group). l Summary of the relative change in the ferroptosis markers MDA, the GSH/GSSG ratio, and Ptgs2 mRNA measured in vehicle-treated and Fer-1‒treated TAC-operated control, Acsl4 TG, and Acsl4 KO mice, normalized to the respective vehicle-treated TAC-operated control group (n = 5–6 mice/group). *P < 0.05, **P < 0.01, ***P < 0.001, and ns, not significant (two-way ANOVA followed by Tukey’s multiple comparisons test)
Fig. 6
Fig. 6
The pyroptotic pathway is activated following Acsl4-induced ferroptosis. a Heatmap summarizing the differentially expressed genes in left ventricular tissues obtained from sham-operated and TAC-operated Acsl4 F/F and Acsl4 KO mice (n = 3 mice/group). b KEGG analysis of RNA-seq data showing the top 10 enriched pathways in cardiac tissues obtained from TAC-operated Acsl4 F/F and Acsl4 KO mice. c Plot of the log2 fold change in TAC-operated Acsl4 KO mice versus TAC-operated Acsl4 F/F mice (on the y-axis) plotted against the log2 fold change in TAC-operated Acsl4 F/F mice versus sham-operated Acsl4 F/F mice (on the x-axis). Both Il1b and Nlrp3 were upregulated in the TAC-operated Acsl4 F/F mice (i.e., to the right of the y-axis), but downregulated in the TAC-operated Acsl4 KO mice (i.e., below the x-axis). d Schematic diagram depicting activation of the pyroptotic signaling pathway by 12-HETE, leading to the production of mature IL-1β from pro-IL-1β and the production of cleaved GSDMD from GSDMD (Gasdermin D). Western blot analysis (e) and quantification (f) of the pyroptotic signaling markers NLRP3 (NLR family pyrin domain containing 3), ASC (apoptosis-associated speck-like protein containing a CARD), the cleaved CASPASE-1/pro-CASPASE-1 ratio, the cleaved GSDMD/GSDMD ratio, and the pro-IL-1β/IL-1β ratio measured in left ventricular tissues obtained from sham-operated and TAC-operated Acsl4 F/F and Acsl4 KO mice (n = 5 mice/group). Western blot analysis (g) and quantification (h) of NLRP3, ASC, the cleaved CASPASE-1/pro-CASPASE-1 ratio, the cleaved GSDMD/GSDMD ratio, and the pro-IL-1β/IL-1β ratio measured in left ventricular tissues obtained from vehicle-treated TAC-operated wild-type (WT) mice, 12-HETE‒treated TAC-operated WT mice and 12-HETE + Fer-1‒treated TAC-operated WT mice (n = 5 mice/group). i Left ventricular tissues were obtained from vehicle-treated and 12-HETE‒treated TAC-operated WT and Nlrp3 KO mice and stained with WGA (green); Evans blue‒positive cardiomyocytes are indicated in red, and the nuclei were counterstained with DAPI (blue). Scale bar, 50 μm. j Summary of Evans blue–positive cells in the indicated mice (n = 5 mice/group). k Summary of the heart weight/tibia length ratio measured in vehicle-treated and 12-HETE‒treated TAC-operated WT and Nlrp3 KO mice (n = 5–6 mice/group). *P < 0.05, **P < 0.01, ***P < 0.001, and ns, not significant (one-way or two-way ANOVA followed by Tukey’s multiple comparisons test)

References

    1. Heidenreich, P. A. et al. 2022 AHA/ACC/HFSA guideline for the management of heart failure: a report of the American College of Cardiology/American Heart Association Joint Committee on Clinical Practice Guidelines. Circulation145, e895–e1032 (2022). - PubMed
    1. Tsao, C. W. et al. Heart Disease and Stroke Statistics-2022 update: a report from the American Heart Association. Circulation145, e153–e639 (2022). - PubMed
    1. McDonagh, T. A. et al. 2021 ESC Guidelines for the diagnosis and treatment of acute and chronic heart failure. Eur. Heart J.42, 3599–3726 (2021). - PubMed
    1. Chatham, J. C. & Young, M. E. Metabolic remodeling in the hypertrophic heart: fuel for thought. Circ. Res111, 666–668 (2012). - PMC - PubMed
    1. Bertero, E. & Maack, C. Metabolic remodelling in heart failure. Nat. Rev. Cardiol.15, 457–470 (2018). - PubMed

Publication types