. 2024 Nov;43(22):5381-5420.
doi: 10.1038/s44318-024-00240-z. Epub 2024 Sep 26.

CEP192 localises mitotic Aurora-A activity by priming its interaction with TPX2

Affiliations

CEP192 localises mitotic Aurora-A activity by priming its interaction with TPX2

James Holder et al. EMBO J. 2024 Nov.

Abstract

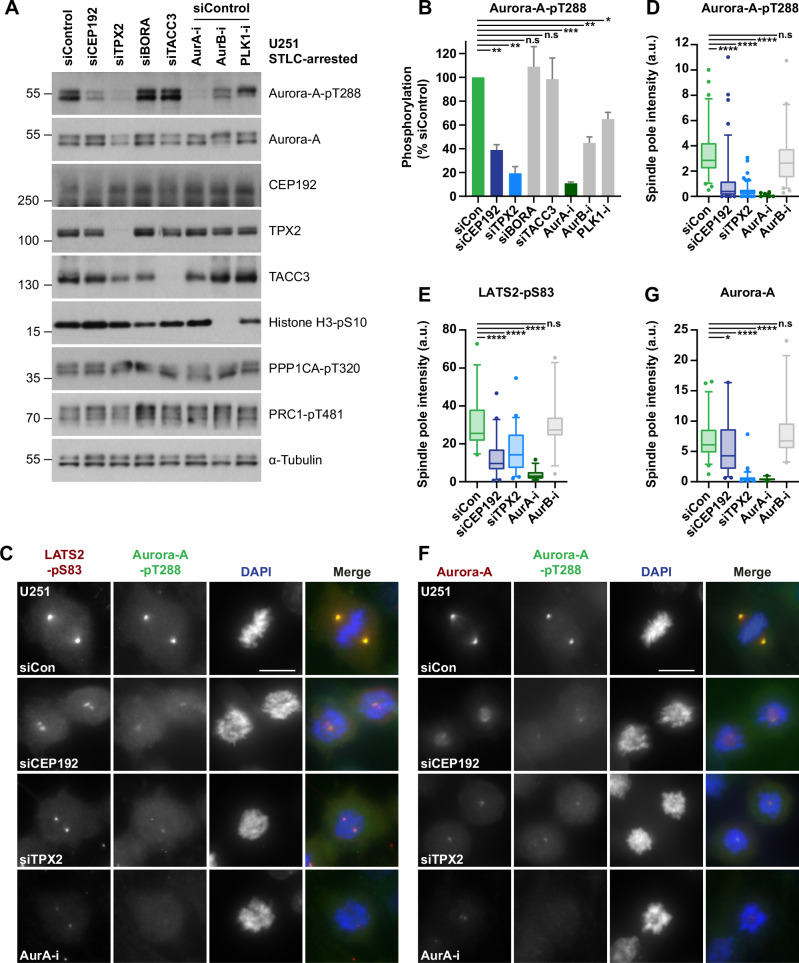
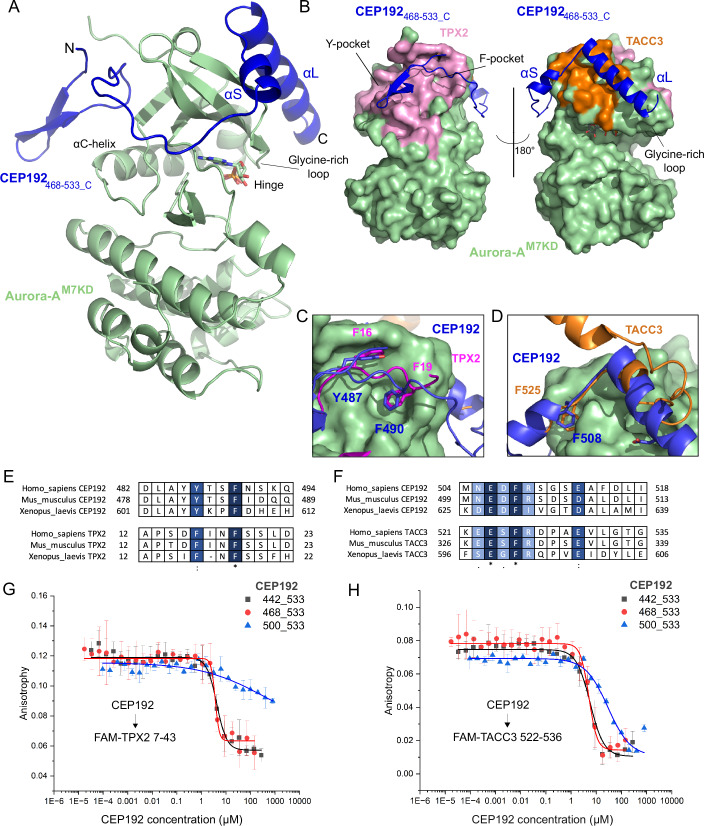
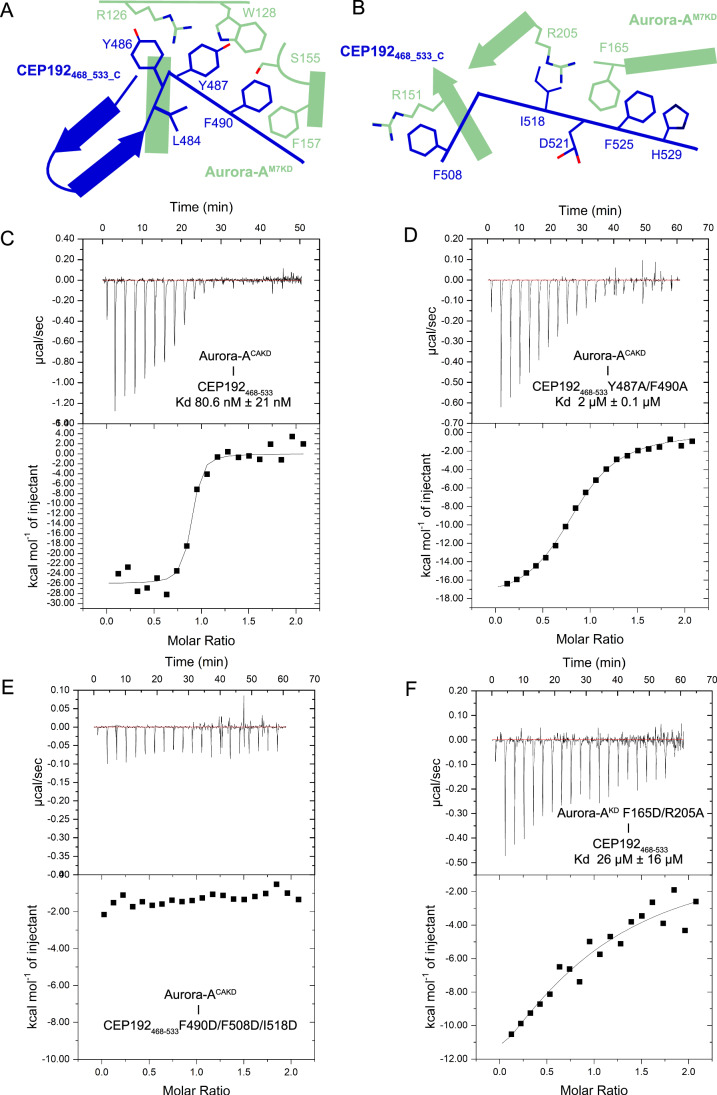
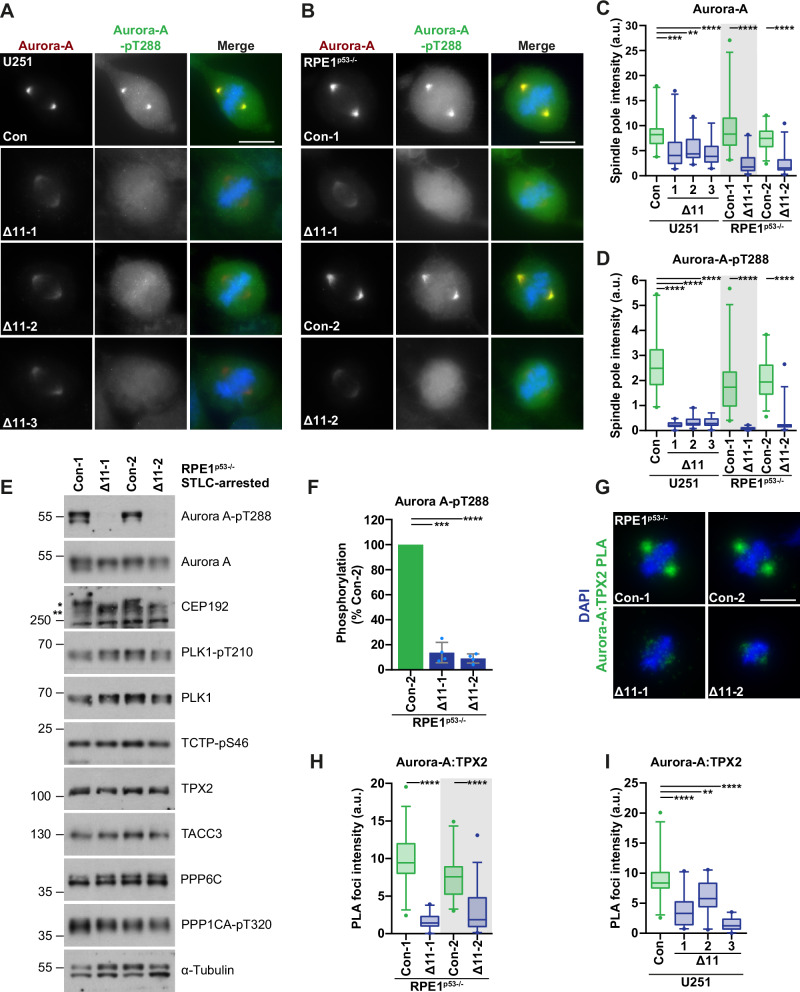
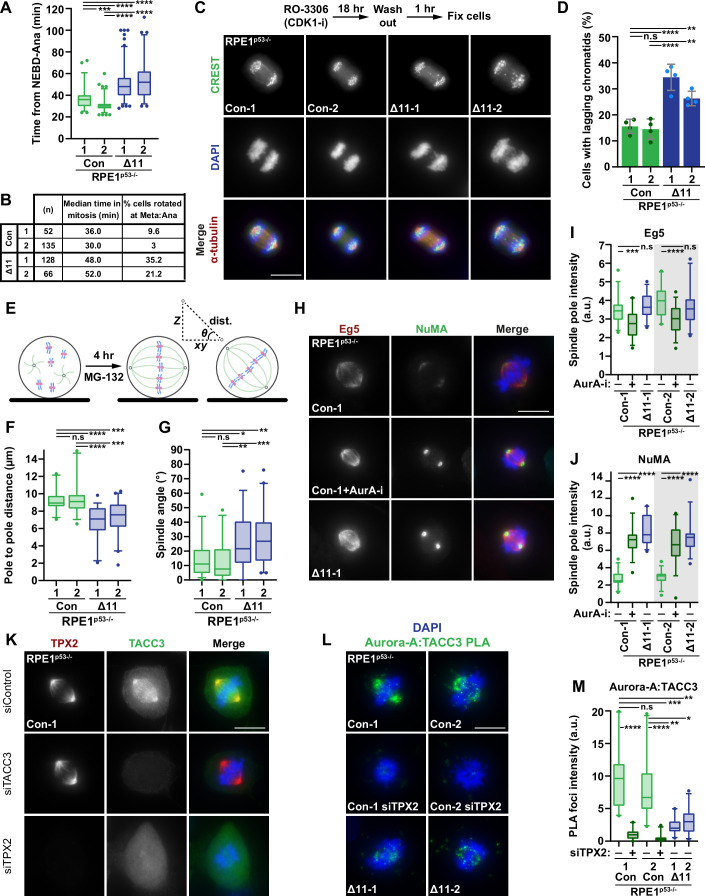
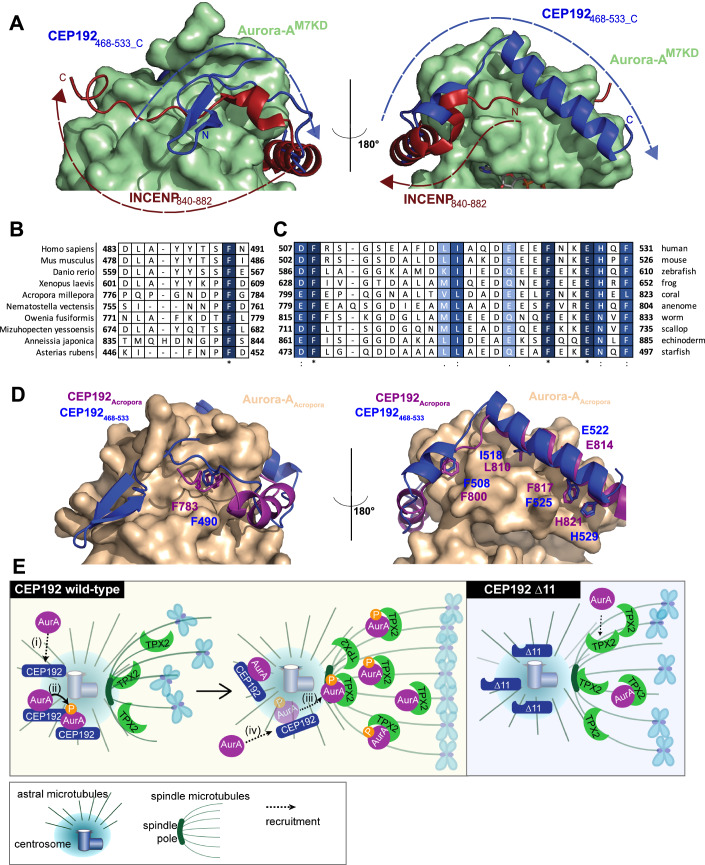
Aurora-A is an essential cell-cycle kinase with critical roles in mitotic entry and spindle dynamics. These functions require binding partners such as CEP192 and TPX2, which modulate both kinase activity and localisation of Aurora-A. Here we investigate the structure and role of the centrosomal Aurora-A:CEP192 complex in the wider molecular network. We find that CEP192 wraps around Aurora-A, occupies the binding sites for mitotic spindle-associated partners, and thus competes with them. Comparison of two different Aurora-A conformations reveals how CEP192 modifies kinase activity through the site used for TPX2-mediated activation. Deleting the Aurora-A-binding interface in CEP192 prevents centrosomal accumulation of Aurora-A, curtails its activation-loop phosphorylation, and reduces spindle-bound TPX2:Aurora-A complexes, resulting in error-prone mitosis. Thus, by supplying the pool of phosphorylated Aurora-A necessary for TPX2 binding, CEP192:Aurora-A complexes regulate spindle function. We propose an evolutionarily conserved spatial hierarchy, which protects genome integrity through fine-tuning and correctly localising Aurora-A activity.

Keywords: Aurora-A; Centrosome; Kinase; Mitosis; Mitotic Spindle.


Conflict of interest statement

Disclosure and competing interests statement The authors declare no competing interests.

Figures

Figure 1
Figure 1. Activation-loop phosphorylation of Aurora-A in mitosis requires both CEP192 and TPX2.
(A) Western blot analysis of U251 cells treated with the indicated siRNA (48 h total) and arrested in mitosis with STLC (20 h), prior to the addition of a proteasome inhibitor, MG-132 (20 min). Cells were then additionally treated with either DMSO control or one of Aurora-A, Aurora-B or PLK1-inhibitors for 30 min prior to lysis. (B) Densitometric quantification of Aurora-A-pT288 signal from (A). Grey bars indicate mean ± S.D (n = 3 biological replicates). Exact p values (L-R): 0.0051, 0.0049, 0.651, 0.9399, 0.0002, 0.0087, 0.0255. (C) Immunofluorescence images of U251 cells treated with the indicated siRNA (48 h) and either DMSO control or Aurora-A or -B inhibitor (30 min) prior to methanol fixation. Antibodies against LATS2-pS83 and Aurora-A-pT288 are red and green in merged images, respectively, with DNA stained with DAPI (blue). (D, E) Box plots of (D) Aurora-A-pT288 (n = 6) or (E) LATS2-pS83 (n = 3) spindle pole signal intensity in U251 cells, with representative images shown in (C) (≥10 cells/ biological replicate). Exact p values from (D) (L-R): <0.0001, <0.0001, <0.0001, 0.1721. Exact p values from (E) (L-R): <0.0001, <0.0001, <0.0001, 0.9631. (F) Immunofluorescence images of U251 cells treated as in (C) prior to methanol fixation. Antibodies against Aurora-A and Aurora-A-pT288 are red and green in merged images, respectively, with DNA stained with DAPI (blue). (G) Box plot of Aurora-A spindle pole signal intensity in U251 cells, with representative images shown in (F) (n = 3, ≥10 cells/biological replicate). Exact p values from (L-R): 0.0274, <0.0001, <0.0001, 0.2671. Data information Two adjacent mitotic cells are shown in (C) siCEP192 and (F) siCEP192 and siTPX2. Box plots in (D, E and G) indicate the median and interquartile ranges (25th–75th percentile) with coloured whiskers representing 5th–95th percentile ranges. p values are denoted as follows: ****p < 0.0001, ***p < 0.001, **p < 0.01, *p < 0.05, n.s not significant (B Welch’s t-test, D, E, G Mann–Whitney test). Scale bars in (C) and (F) represent 10 µm. Source data are available online for this figure.
Figure 2
Figure 2. Human CEP192 468–533 wraps around the N-lobe of Aurora-A kinase.
(A) Cartoon representation of the crystal structure of CEP192468-533_C (dark blue), bound to Aurora-AM7KD_A (light green). (B) Comparison of the structure of CEP192468-533 bound to Aurora-AM7KD with the surfaces that interact with other known binders in mitosis highlighted. Residues required for interacting with TPX2 are shown in pink (from PDB:1OL5), and TACC3 are shown in orange (from PDB:5ODT). CEP192 binding overlaps with that of TPX2 and TACC3. (C) Magnified view of CEP192468-533 compared with TPX21-43 bound to Aurora-A (PDB:1OL5). The residues Phe16 and Phe19 from TPX2 (pink) overlap with CEP192 (dark blue) Tyr487 and Phe490 to bind into the F-pocket. (D) Magnified view of CEP192468-533 compared with TACC3518-563 bound to Aurora-A (PDB:5ODT). Phe508 of CEP192 (dark blue) binds into the same pocket on the N-lobe that is utilised by Phe525 in TACC3 (orange). (E) Sequence alignment shows the conservation of the structurally equivalent residues between orthologues of CEP192 and TPX2. Higher conservation is shown with darker shading. (F) Sequence alignment shows the conservation of the structurally equivalent residues between orthologues of CEP192 and TACC3. Higher conservation is shown with darker shading. (G) Fluorescence anisotropy-based competition assay with various CEP192 protein constructs (442–533 (black, IC50 4.2 μM ± 0.42 μM), 468–533 (red, IC50 3.7 μM ± 0.4 μM), 501–533 (blue, IC50 not calculated)) binding to unphosphorylated Aurora-ACAKD in competition with FAM-TPX2 7-43. (H) Fluorescence anisotropy-based competition assay with various CEP192 protein constructs (442–533 (black, IC50 5.7 μM ± 1 μM), 468–533 (red, IC50 5 μM ± 0.5 μM), 501–533 (blue, IC50 29 μM ± 3 μM)) binding to Aurora-A kinase domain in competition with FAM-TACC3 522-536. Displayed data points and IC50 values represent the average anisotropy for each reaction, with the standard deviation for the mean shown as error bars (n = 3 independent experimental samples). Data information: In (G) and (H), displayed data points and IC50 values represent the average anisotropy for each reaction with the standard deviation for the mean shown as error bars (n = 3 independent experimental samples). Source data are available online for this figure.
Figure 3
Figure 3. CEP192 interacts with Aurora-A using two sites.
(A) Schematic diagram of the CEP192 interaction at the F-pocket site on Aurora-A kinase domain. CEP192 is shown in blue, with Aurora-A in green. (B) Schematic diagram of the CEP192 interaction at the TACC3 site above the glycine-rich loop of Aurora-A kinase domain. CEP192468-533 is shown in blue, with Aurora-AM7KD in green. (C) Isothermal titration calorimetry of Aurora-ACAKD into CEP192468-533. The measured Kd was 80.6 ± 21 nM with a molar ratio of 0.85. (D) Isothermal titration calorimetry of Aurora-ACAKD into CEP192468-533 Y487A/F490A. The measured Kd was 2 ± 0.1 μM, with a molar ratio of 0.84. (E) Isothermal titration calorimetry of Aurora-ACAKD into CEP192468-533 F490D/F508D/I518D. The Kd was not determined. (F) Isothermal titration calorimetry of Aurora-AKD F165D/R205A into CEP192468-533. The measured Kd was 26 ± 16 μM, with a molar ratio of 0.87. Source data are available online for this figure.
Figure 4
Figure 4. CEP192 inhibits Aurora-A kinase activity by binding to the site that competes with TPX2.
(A) ADP-Glo assay to assess the effect of CEP192-WT and mutants binding to Aurora-A on the ATPase activity of phosphorylated Aurora-ACAKD with kemptide as substrate. The calculated IC/EC50 values are summarised in the table. (B) Cartoon representation of the R-Spine assemblies in the two complexes of Aurora-AM7KD bound to CEP192 468–533 or 506–527 in the ASU, compared to the R-Spine in Aurora-A bound to TPX2 (PDB: 1OL5) and fused to CEP192 506–527 (PDB: 8GUW). The R-spine is not assembled when CEP192 468–533 forms extensive interactions with Aurora-A, but is assembled when CEP192 is truncated (CEP192 505–527 bound in chain F, or 506–527 fused to Aurora-A in 8GUW) or in the presence of TPX2. (C) Cartoon representation of the comparison of Aurora-AM7KD bound to CEP192468-533 (green/bright blue) and Aurora-A/TPX2 (light blue/magenta) crystal structures in the vicinity of the kinase ɑC-β4 region. Leu484 from CEP192 (shown in blue) superimposes with Pro13 from TPX2 (shown in magenta), but penetrates deeper into the ɑC-β4 surface. A relative rotation of the ɑC-helix is needed to accommodate Leu484, including a 2.0 Å shift in the position of Ser186 in Aurora-A. Data information: Displayed data points in (A) and EC50 values represent the average luminescence for each reaction condition with standard deviations of the mean as error bars (n = 3 independent experiment samples). Source data are available online for this figure.
Figure 5
Figure 5. Targeted deletion of the Aurora-A binding interface of CEP192 in cells.
(A) Crystal structure of the interaction between Aurora-A (green) and CEP192 (grey/blue). Residues contained within CEP192 exon 11 are highlighted in blue. (B) Schematic detailing the domain architecture of CEP192 and the CRISPR/Cas9 approach used to remove exon 11 and generate CEP192(Δ11) mutants. (C) Immunofluorescence images of methanol fixed control (Con) or Δ11 RPE1p53−/− cells. Antibodies against TPX2 and CEP192 are red and green in merged images, respectively, with DNA stained with DAPI (blue). (D) Box plot of CEP192 centrosomal signal intensity in multiple RPE1 and RPE1-derived (i.e. Con and Δ11) cell lines (n = 2, 10 cells/biological replicate). RPE1 indicates the parental p53+/+ line. Con-3 is an additional RPE1p53-/- control cell line generated previously within the lab. Exact p values (L-R): 0.6731, 0.0042, 0.9486, 0.8134, 0.841. (E) Box plot of TPX2 spindle pole signal intensity in RPE1p53−/− cells, with representative images shown in (C) (n = 2, 10 cells/biological replicate). Exact p values (L-R): 0.2836, 0.982. (F) Proximity ligation assay (PLA) between Aurora-A and CEP192 specific antibodies in control and Δ11 RPE1p53−/− cells. PLA signal is green in merged images with DNA stained with DAPI (blue). (G) Scatter plot of the Aurora-A:CEP192 PLA signal intensity in mitotic cells from (F) (n = 2, 15 cells/biological replicate). Exact p values (L-R): <0.0001, <0.0001. (H) Proximity ligation assay (PLA) between Aurora-A and CEP192 specific antibodies in control and Δ11 U251 cells. PLA signal is green in merged images with DNA stained with DAPI (blue). (I) Scatter plot of the Aurora-A:CEP192 PLA signal intensity in mitotic cells from (H) (n = 2, ≥10 cells/biological replicate). Exact p values (L-R): <0.0001, <0.0001, <0.0001. (J) Table summarising cell cycle profiles, of propidium iodide-stained cells, obtained by flow cytometry (n = 3 biological replicates, mean ± S.D). Representative histograms can be found in figure Appendix Fig. S6F–H. Data information In (G) and (I), filled and hollow circles indicate PLA signal either being focused at the spindle pole or scattered throughout the cytoplasm, respectively. Box plots in (DE) indicate the median and interquartile ranges (25th–75th percentile) with coloured whiskers representing 5th–95th percentile ranges. Grey bars in (G) and (I) indicate mean ± S.D. Grey shading in (E, G, J) denotes independently completed biological replicates. p values are denoted as follows: ****p < 0.0001, **p < 0.01, n.s not significant (Mann–Whitney test). Scale bars in (C, F, H) represent 10 µm. Source data are available online for this figure.
Figure 6
Figure 6. Binding of Aurora-A to CEP192 is essential for its autophosphorylation and spindle recruitment.
(A, B) Immunofluorescence images of methanol fixed control and Δ11 (A) U251 and (B) RPE1p53−/− cells. Antibodies against Aurora-A and Aurora-A-pT288 are red and green in merged images, respectively, with DNA stained with DAPI (blue). (C, D) Box plots of (C) Aurora-A and (D) Aurora-A-pT288 spindle pole signal intensity in U251 and RPE1p53−/− cells, with representative images shown in (A, B) (n = 2, ≥10 cells/ biological replicate). Exact p values from (C) (L-R): 0.0005, 0.001, <0.0001, <0.0001, <0.0001. Exact p values from (D) (L-R): <0.0001, <0.0001, <0.0001, <0.0001, <0.0001. (E) Western blot of control and Δ11 RPE1p53-/- cells synchronised in mitosis with 10 µM STLC (20 h). Antibodies against Aurora-A binding partners and several mitotic regulators are shown. α-tubulin serves as a loading control, while the mitotic phosphorylation PPP1CA-pT320 demonstrates equivalent mitotic arrest between samples. A band-shift between CEP192-WT and Δ11 proteins can be observed, these forms are marked with * and **, respectively. (F) Densitometric quantification of Aurora-A-pT288 signal from (E). Grey bars indicate mean ± S.D (n = 4 biological replicates). Exact p values (L-R): 0.0002, <0.0001. (G) Proximity ligation assay (PLA) between Aurora-A and TPX2 specific antibodies in control and Δ11 RPE1p53−/− cells. PLA signal is green in merged images with DNA stained with DAPI (blue). (H) Box plot of the Aurora-A:TPX2 PLA signal intensity in mitotic RPE1p53−/− cells with representative images shown in (G) (n = 2, ≥15 cells/biological replicate). Exact p values (L-R): <0.0001, <0.0001. (I) Box plot of the Aurora-A:TPX2 PLA signal intensity in mitotic U251 cells, with representative images shown in Appendix Fig. S7E (n = 2, ≥10 cells/ biological replicate). Exact p values (L-R): <0.0001, 0.0048, <0.0001. Data information Box plots in (C, D and H, I) indicate the median and interquartile ranges (25th–75th percentile) with coloured whiskers representing 5th–95th percentile ranges. Grey shading in (C, D, H) denotes independently completed biological replicates. p values are denoted as follows: ****p < 0.0001, ***p < 0.001, **p < 0.01 (C, D and H, I Mann–Whitney test, F Welch’s t-test). Scale bars in (A, B, G) represent 10 µm. Source data are available online for this figure.
Figure 7
Figure 7. Loss of the CEP192:Aurora-A interaction leads to mitotic spindle defects and chromosome segregation errors.
(A) Box plot of the time from NEBD-Ana (nuclear envelope breakdown to anaphase onset) in SiR-Hoechst-labelled control and Δ11 RPE1p53−/− cells from (>50 mitotic events per condition, collected during one imaging session). Exact p values (bottom-top): <0.0001, <0.0001, 0.0004, <0.0001, <0.0001. (B) Table indicating the number of mitotic events imaged (n), the median time in mitosis and the % of cells rotated at the metaphase to anaphase transition for each condition in (A). (C) Immunofluorescence images of PTEMF-fixed control and Δ11 RPE1p53−/− cells in anaphase. Antibodies against α-tubulin and CREST are red and green in merged images, respectively, with DNA stained with DAPI (blue). Cells were treated with 6 µM RO-3306 (18 h) to synchronise in late-G2 and then released into mitosis. Cells were then incubated for 60 min to enrich for anaphase cells and fixed. (D) Bar graph indicating the percentage of control and Δ11 RPE1p53−/− cells, from (C), containing lagging chromatids in anaphase. Grey bars indicate mean ± S.D (n = 4 biological replicates). Exact p values (bottom-top): <0.0001, 0.0038, 0.9973, <0.0001, 0.0078. (E) Schematic depicting metaphase arrest using MG-132 proteasome inhibition and how pole-to-pole distance and spindle angle were subsequently calculated. (F, G) Box plots of the (F) pole-to-pole distance and (G) spindle angle in RPE1p53−/− cells treated with a proteasome inhibitor, MG-132 (4 h), to enrich for metaphase cells (n = 2, ≥15 cells/biological replicate). Exact p values from (F) (bottom-top): <0.0001, 0.0001, >0.9999, <0.0001, 0.0002. Exact p values from (G) (bottom-top): 0.0024, 0.0002, >0.9999, 0.0297, 0.0036. (H) Immunofluorescence images of control-1 and Δ11-1 RPE1p53−/− cells treated with either DMSO control or Aurora-A inhibitor (30 min) prior to methanol fixation. Antibodies against Eg5 and NuMA are red and green in merged images, respectively, with DNA stained with DAPI (blue). Representative images of control-2 and Δ11-2 RPE1p53−/− cells can be found in EV4G. (I, J) Box plots of the (I) Eg5 spindle and (J) NuMA spindle pole signal intensity in RPE1p53−/− cells, with representative images shown in (H) and EV4G (n = 2, ≥15 cells/biological replicate). Exact p values from (I) (L-R): 0.0004, 0.1439, <0.0001, 0.0578. Exact p values from (J) (L-R): <0.0001, <0.0001, <0.0001, <0.0001. (K) Immunofluorescence images of methanol fixed control and Δ11 RPE1p53−/− cells treated with the indicated siRNA (48 h). Antibodies against TPX2 and TACC3 are red and green in merged images, respectively, with DNA stained with DAPI (blue). (L) Proximity ligation assay (PLA) between Aurora-A and TACC3 specific antibodies in either control or Δ11 RPE1p53−/− cells, treated with the indicated siRNA (48 h). PLA signal is green in merged images with DNA stained with DAPI (blue). (M) Box plot of the Aurora-A:TACC3 PLA signal intensity in mitotic RPE1p53−/− cells from (L) (n = 2, ≥10 cells/biological replicate). Exact p values (bottom-top): <0.0001, <0.0001, 0.0026, 0.022, >0.9999, 0.0001, 0.0013. Data information Box plots in (A, F, G, I, J, M) indicate the median and interquartile ranges (25th–75th percentile) with coloured whiskers representing 5th–95th percentile ranges. Grey shading in (I, J) denotes independently completed biological replicates. p values are denoted as follows: ****p < 0.0001, ***p < 0.001, **p < 0.01, *p < 0.05, n.s not significant (A, F, G, M Kruskal–Wallis test, D ANOVA, I, J Mann–Whitney test). Scale bars in (C, H, K, L) represent 10 µm. Source data are available online for this figure.
Figure 8
Figure 8. The interaction between CEP192 and Aurora-A is highly conserved.
(A) Comparison of CEP192468-533 bound to Aurora-AM7KD with human INCENP bound to Aurora-B. PDB 4AF3 was overlaid with the co-crystal structure of CEP192468-533 (dark blue) bound to AuroraM7KD (pale green). The main chain of INCENP (dark red) runs in the opposite direction around the N-lobe of the kinase domain. (B) Sequence alignment of CEP192 orthologues from divergent species identified from a BLAST search, in the region that binds the F-pocket on Aurora-A. The darker the residue, the higher degree of conservation. (C) Sequence alignment of CEP192 orthologues from divergent species identified from a BLAST search, in the region that binds the TACC3-binding site. The darker the residue, the higher degree of conservation. (D) Cartoon representation of the AlphaFold2 model of the Acropora millepora Aurora-A kinase domain (XP_029186576.2 115-381, wheat, Aurora-AAcropora) and potential CEP192 orthologue (XP_044175215.1 781–838, purple, CEP192Acropora). The human CEP192468-533 is shown in dark blue for comparison. (E) Cartoon depicting the hub-and-spoke model of Aurora-A activation during mitosis. (i) In wild-type cells, Aurora-A is recruited to the centrosome through a bi-modal interaction with CEP192, where (ii) a high local-concentration of Aurora-A promotes autophosphorylation of the Aurora-A activation loop. (iii) Aurora-A phosphorylation increases the affinity of the Aurora-A:TPX2 interaction, facilitating the recruitment of Aurora-A to spindle microtubules and, therefore, proper spindle function and orientation. (iv) CEP192 can now interact with and activate further molecules of Aurora-A at the centrosome, ensuring optimal spatiotemporal control of Aurora-A activity during mitosis. In Δ11 cells, Aurora-A is neither recruited to the centrosome nor autophosphorylated. This prevents efficient formation of the Aurora-A:TPX2 complex at the spindle pole, where the reduced Aurora-A activity results in spindle abnormalities.
Figure EV1
Figure EV1. Aurora-A colocalizes with CEP192 in the absence of TPX2 or Aurora-A activity.
(A) Western blot analysis of Aurora-A and its binding partners in a panel of asynchronous cell lines. (B) Western blot analysis of asynchronous U251 cells treated with the indicated siRNA (48 h). Antibodies against the mitotic phosphorylations PPP1CA-pT320, PRC1-pT481 and Histone H3-pS10 highlight the enrichment of mitotic cells following depletion of certain Aurora-A co-activators. (C) Western blot analysis of RPE1 cells treated with the indicated siRNA (48 h total) and arrested in mitosis with STLC (20 h). (D) Densitometric quantification of Aurora-A-pT288 signal from (C). Grey bars indicate mean ± S.D (n = 3 biological replicates). Exact p values (L-R): 0.0016, 0.0003. (E) Immunofluorescence images of U251 cells treated with siRNA as in (B), prior to 30 min incubation with DMSO control or Aurora-A inhibitor and then methanol fixation. Antibodies against Aurora-A and CEP192 are red and green in merged images, respectively, with DNA stained with DAPI (blue). Data information In (D), p values are denoted as follows: ***p < 0.001, **p < 0.01, (Welch’s t-test). The scale bar in (E) represents 10 µm. Source data are available online for this figure.
Figure EV2
Figure EV2. CEP192 binds Aurora-A kinase domain with an extensive and high-affinity interaction.
(A) 1H-15N HSQC recorded on Homo sapiens CEP192 442–533 in the absence (red) and presence (blue) of Aurora-A 122–403 C290A C393A. A significant number of CEP192 peaks disappeared in the presence of Aurora-A, and following assignment, these residues were mapped between 470 to 533. (B) Isothermal titration calorimetry experiment showing titration of CEP192 442–533 into Aurora-A kinase domain (122–403 C290A C393A D274N). The measured Kd was 72 nM, with a molar ratio of 0.67 from two experimental repeats. (C) Mapping of the HDX-MS data from CEP192 442–533 in the presence of Aurora-A 122–403 C290A C393A onto an AlphaFold2 model of human CEP192 442–533. The dark blue shows regions with a greater than 10% difference in uptake, with lighter blue for differences in uptake between 5 and 10%. Regions where there was no change are shown in grey, with the region in black where no peptides were identified. (D) Mapping of the HDX-MS experiment as (C), mapped onto the surface of human Aurora-ACAKD (PDB: 4CEG, shown in light green). The darker the red, the greater the difference in uptake when CEP192 468–533 is present. (E) Summary of the results of the interaction mapping data from NMR and HDX-MS on CEP192 442–533. The residues in the 1H-15N-HSQC with the highest peak loss are shown in the top section in blue, with dark blue indicating peaks that completely disappeared and light blue indicating peaks that decreased and shifted significantly. The protected residues in the CEP192 HDX-MS are shown in the bottom section in blue, with peptides where uptake differed by over 10% shown in dark blue and uptake differences between 5 and 10% shown in light blue. The region in black shows where no peptides were identified. Source data are available online for this figure.
Figure EV3
Figure EV3. Contents of the asymmetric unit of the crystal structure of Aurora-AM7KD bound to CEP192468-533 and the inhibitory monobody (Mb2).
(A) Cartoon representation of the asymmetric unit of the crystal structure of Aurora-AM7KD bound to CEP19468-533 and the inhibitory monobody. There are two copies of Aurora-AM7KD (Chain A in light green, Chain D in light pink), 2 copies of the inhibitory monobody (Chains B and E in cyan) and 2 copies of CEP192468-533 (Chains C and F in blue and dark blue). Only part of the CEP192 was visible in chain F (residues 506–526). (B) Overlay of the cartoon representations of the two Aurora-AM7KD copies in the asymmetric unit. Chain A is shown in light green, with chain D in light pink. There are no significant differences between the two copies in the asymmetric unit. (C) Cartoon representation of the complex between CEP192468-533_C (dark blue) and Aurora-AM7KD_A (light green) with a symmetry-related copy Mb2 (teal). The interface was analysed on PDBePISA, giving an interface score of 0.00 suggesting that this is merely a crystal contact and not a biologically relevant interface. (D) Representation of the electron density around CEP192468-533 (dark blue) when bound to Aurora-AM7KD (light green). The mesh represents a 2mFo-DFc map contoured at 1.2σ. (E) A second view of the electron density around CEP192468-533 (dark blue) when bound to Aurora-AM7KD (light green) to show the αS/αL region. The mesh represents a 2mFo-DFc map contoured at 1.2σ. Data information: Regions modelled for the different chains were 124–275 and 289–389 (chain A, Aurora-AM7KD); 3–93 (chain B, Mb2); 468–531 (chain C, CEP192468_533); 126–277 and 290–388 (chain D, Aurora-AM7KD); 3–93 (chain E, Mb2); 506–527 (chain F, CEP192468_533).
Figure EV4
Figure EV4. The Aurora-A:CEP192 complex is required to establish proper mitotic spindle length and orientation.
(A) Bar chart showing the percentage of Histone H3-pS10 positive cells in multiple RPE1 and RPE1-derived cell lines (n = 5 biological replicates). Exact p values from (bottom-top): 0.4834, 0.6124, <0.0001, <0.0001, 0.0026, 0.0264, 0.6927. (B) Box plot of monopolar spindle diameter in control and Δ11-1 RPE1p53−/− cells treated with either DMSO control or Aurora-A inhibitor for 30 min prior to methanol fixation (n = 3, >15 cells/biological replicate). Exact p values from (bottom-top): 0.001, >0.9999, <0.0001, 0.0048, <0.0001. (C) Schematic detailing how monopolar spindle diameter, plotted in (B), was calculated based on each DAPI-stained DNA signal area (blue). (D) Bar chart showing the number of CETN3 and CEP152 foci in multiple STLC-arrested RPE1 and RPE1-derived cell lines (n = 3, ≥50 cells/biological replicate). (E) Representative immunofluorescence images of control and Δ11 RPE1p53−/− cells from (D). Antibodies against CETN3 and CEP152 are red and green in merged images, respectively, with DNA stained with DAPI (blue). Enlarged inserts centred on centriolar foci have sides 2 µm in length. (F) Representative images of control and Δ11 RPE1p53−/− progressing through anaphase, siR-Hoechst and brightfield (BF) channels are shown for each image. The black line indicates the metaphase-anaphase transition (Meta-Ana). Numbers in white indicate time relative to Meta-Ana, while numbers in blue indicate the time from NEBD-Ana (nuclear envelope breakdown to anaphase onset) for that cell (see also Fig. 7A-B). For Δ11-1 rotated, note how one of the daughter cells moves out of focus, indicating an out-of-plane division. (G, H) Immunofluorescence images of methanol fixed control and Δ11 (G) RPE1p53−/− and (H) U251 cells. Antibodies against Eg5 and NuMA are red and green in merged images, respectively, with DNA stained with DAPI (blue). Quantification of (G) is found in Fig. 7I, J. (I) Box plot of NuMA spindle pole signal intensity in U251 cells, with representative images shown in (H) (n = 2, ≥10 cells/biological replicate). Exact p values (L-R): <0.0001, <0.0001, <0.0001. Data information In (A) and (D) RPE1 indicates the parental p53+/+ line from which other clones were derived. Con-3 is an additional RPE1p53−/− control cell line generated previously within the lab. Grey bars in (A) and (D) indicate mean ± S.D. Box plots in (B) and (I) indicate the median and interquartile ranges (25th–75th percentile) with coloured whiskers representing 5th–95th percentile ranges. p values are denoted as follows: ****p < 0.0001, ***p < 0.001, **p < 0.01, *p < 0.05, n.s not significant (A ANOVA, B, I Mann–Whitney test). Scale bars in (C) and (E–H) represent 10 µm. Source data are available online for this figure.
Figure EV5
Figure EV5. Loss of the interaction between Aurora-A and CEP192 impairs TACC3 spindle recruitment.
(A) Immunofluorescence images of control and Δ11 RPE1p53−/− cells treated with either DMSO control or Aurora-A inhibitor (30 min) prior to methanol fixation. Antibodies against γ-tubulin and TACC3 are red and green in merged images, respectively, with DNA stained with DAPI (blue). (B) Box plot TACC3 spindle signal intensity in RPE1p53−/− cells, with representative images shown in (A) (n = 2, ≥15 cells/biological replicate). Exact p values (L-R): <0.0001. <0.0001, <0.0001, <0.0001. (C) Proximity ligation assay (PLA) between Aurora-A and TACC3 specific antibodies in control and Δ11 RPE1p53−/− cells. PLA signal is green in merged images with DNA stained with DAPI (blue). (D) Box plot of Aurora-A:TACC3 PLA signal intensity in mitotic RPE1p53−/− cells, with representative images shown in (B) (n = 2, ≥15 cells/biological replicate). Exact p values (L-R): <0.0001, <0.0001. (E) Immunofluorescence images of control and Δ11 RPE1p53−/− cells treated as in (A). Antibodies against LATS2-pS83 and PCNT are red and green in merged images, respectively, with DNA stained with DAPI (blue). (F) Box plot of LATS2-pS83 spindle pole signal intensity in RPE1p53−/− cells, with representative images shown in (E) (n = 2, ≥15 cells/biological replicate). Exact p values (L-R): <0.0001, 0.6749. (G) Box plots of γ-tubulin centrosomal signal intensity in multiple RPE1 and RPE1-derived cell lines (n = 2, 10 cells/biological replicate). RPE1 indicates the parental p53+/+ line from which other clones were derived. Con-3 is an additional RPE1p53−/− control cell line generated previously within the lab. Exact p values (L-R): 0.1865, 0.0022, 0.4935, 0.3363, 0.6783. (H) Box plot of γ-tubulin centrosomal signal intensity in RPE1p53−/− cells treated as in (A), with representative images also shown in (A) (n = 2, ≥15 cells/biological replicate). Exact p values (L-R): 0.0017, 0.3941, <0.0001, <0.0001. (I) Box plot of PCNT centrosomal signal intensity in RPE1p53-/- cells treated as in (A), with representative images shown in (E) (n = 2, ≥15 cells/biological replicate). Exact p values (L-R): 0.7364, 0.0919. Data information Box plots in (B, D) and (FI) indicate the median and interquartile ranges (25th–75th percentile) with coloured whiskers representing 5th–95th percentile ranges. Grey shading in (B, D, H) denotes independently completed biological replicates. p values are denoted as follows: ****p < 0.0001, **p < 0.01, n.s not significant (Mann–Whitney test). Scale bars in (A, C, E) represent 10 µm. Source data are available online for this figure.

References

    1. Abdul Azeez KR, Chatterjee S, Yu C, Golub TR, Sobott F, Elkins JM (2019) Structural mechanism of synergistic activation of Aurora kinase B/C by phosphorylated INCENP. Nat Commun 10:3166 - PMC - PubMed
    1. Alvarez-Rodrigo I, Steinacker TL, Saurya S, Conduit PT, Baumbach J, Novak ZA, Aydogan MG, Wainman A, Raff JW (2019) Evidence that a positive feedback loop drives centrosome maturation in fly embryos. Elife 8:e50130 - PMC - PubMed
    1. Bayliss R, Sardon T, Vernos I, Conti E (2003) Structural basis of Aurora-A activation by TPX2 at the mitotic spindle. Mol Cell 12:851–862 - PubMed
    1. Bird AW, Hyman AA (2008) Building a spindle of the correct length in human cells requires the interaction between TPX2 and Aurora A. J Cell Biol 182:289–300 - PMC - PubMed
    1. Booth DG, Hood FE, Prior IA, Royle SJ (2011) A TACC3/ch-TOG/clathrin complex stabilises kinetochore fibres by inter-microtubule bridging. EMBO J 30:906–919 - PMC - PubMed

MeSH terms