. 2024 Sep 26;24(1):1027.
doi: 10.1186/s12879-024-09847-3.

Using priorities between human and livestock bacterial antimicrobial resistance (AMR) to identify data gaps in livestock AMR surveillance

Affiliations

Using priorities between human and livestock bacterial antimicrobial resistance (AMR) to identify data gaps in livestock AMR surveillance

Narmada Venkateswaran et al. BMC Infect Dis. .

Abstract

Background: Bacterial antimicrobial resistance (AMR) is a global threat to both humans and livestock. Despite this, there is limited global consensus on data-informed, priority areas for intervention in both sectors. We compare current livestock AMR data collection efforts with other variables pertinent to human and livestock AMR to identify critical data gaps and mutual priorities.

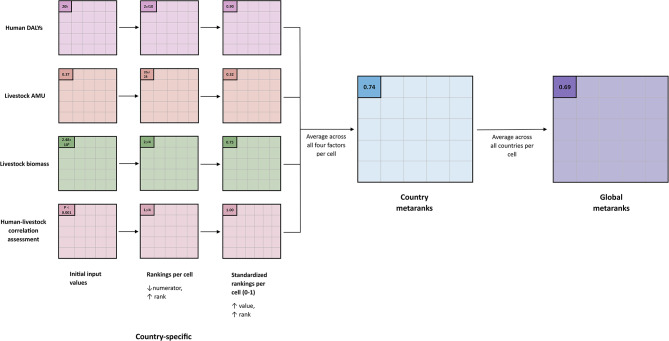
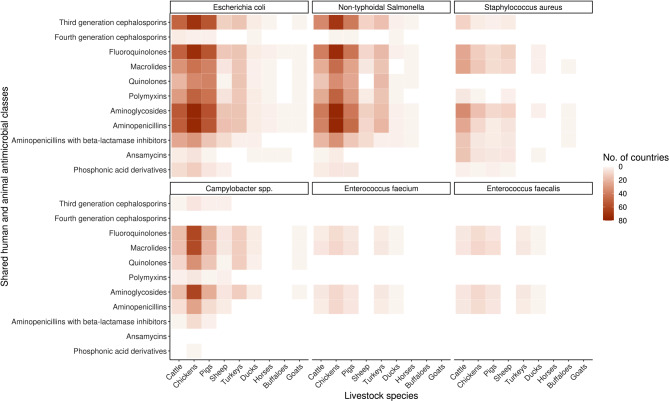
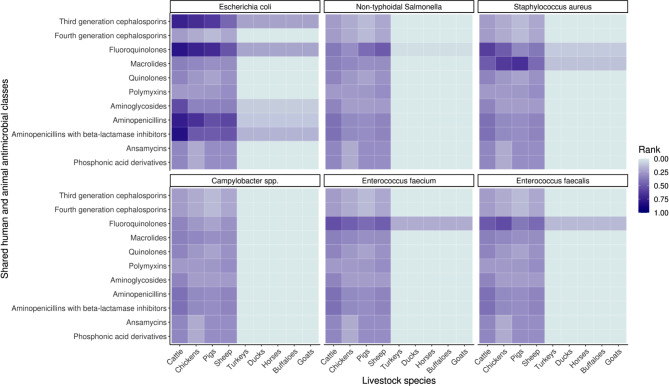
Methods: We globally synthesized livestock AMR data from open-source surveillance reports and point prevalence surveys stratified for six pathogens (Escherichia coli, Staphylococcus aureus, non-typhoidal Salmonella, Campylobacter spp., Enterococcus faecalis, Enterococcus faecium) and eleven antimicrobial classes important in human and veterinary use, published between 2000 and 2020. We also included all livestock species represented in the data: cattle, chickens, pigs, sheep, turkeys, ducks, horses, buffaloes, and goats. We compared this data with intended priorities calculated from: disability-adjusted life years (DALYs), livestock antimicrobial usage (AMU), livestock biomass, and a global correlation exercise between livestock and human proportion of resistant isolates.

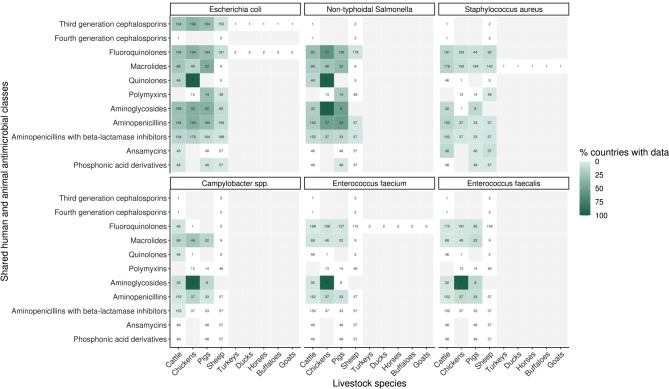
Results: Resistance to fluoroquinolones and macrolides in Staphylococcus aureus were identified as priorities in many countries but, less than 10% of these reported livestock AMR data. Resistance data for Escherichia coli specific to cattle, chickens, and pigs, which we prioritized, were also well collected. AMR data collection on non-typhoidal Salmonella and other livestock species were often not prioritized. Of 232 categories prioritized by at least one country, data were only collected for 48% (n = 112).

Conclusions: The lack of livestock AMR data globally for broad resistance in Staphylococcus aureus could underplay their zoonotic threat. Countries can bolster livestock AMR data collection, reporting, and intervention setting for Staphylococcus aureus as done for Escherichia coli. This framework can provide guidance on areas to strengthen AMR surveillance and decision-making for humans and livestock, and if done routinely, can adapt to resistance trends and priorities.

Keywords: Antimicrobial resistance; Data gaps; Livestock; Surveillance.


Conflict of interest statement

The authors declare no competing interests.

Figures

Fig. 1
Fig. 1
Diagram displaying the creation of the composite indicator (referenced here as metaranks) based on human disability adjusted life-years (DALYs) attributable to AMR, livestock AMU (mg/kg), livestock biomass (population correction units), and a global correlation assessment between livestock and human proportion of resistant isolates (represented as significance levels of Spearman correlation estimates) by antimicrobial class, pathogen, and livestock species (also represented here as a cell). Values displayed, from initial input values, to ranks, and final composite indicators, are taken from the example of fluoroquinolones, E. coli and pigs, with country-specific examples referencing the Philippines
Fig. 2
Fig. 2
Livestock AMR data coverage for all countries extracted (n = 109) aggregated by livestock species, antimicrobial classes and pathogen species. Antimicrobials are ordered top to bottom by shared human and animal relevance. Dark brown shows the most number of countries that have AMR data for the specific antimicrobial class, pathogen, and livestock species. Lighter brown and peach indicate less number of countries with AMR data for the specific antimicrobial class, pathogen, and livestock species, and white shows there are no countries from data extracted that have AMR data for the specific antimicrobial class, pathogen, and livestock species
Fig. 3
Fig. 3
Global metaranks (n = 194) accounting for livestock antimicrobial usage (AMU), livestock biomass (population correction units), human DALYs attributable to AMR, and significance levels of correlations between human and livestock proportion of resistance. Global metaranks were calculated for a particular livestock species, antimicrobial classes and pathogen species combination. Antimicrobials are ordered top to bottom by shared human and animal relevance. Dark purple shows the highest metaranks calculated for the specific antimicrobial class, pathogen, and livestock species. Lighter purple and blue indicate a lower metarank for the specific antimicrobial class, pathogen, and livestock species
Fig. 4
Fig. 4
Global percentage of countries (n = 194) with data for a particular livestock species, antimicrobial classes and pathogen species combination if it was prioritized. Antimicrobials are ordered top to bottom by shared human and animal relevance. White and lighter colors relay a low percentage of countries with data, and darker colors indicate a higher percentage of countries with data. Cells for which no countries have prioritized the category are grey, and have no numbers stated. Numbers in each cell correspond to the number of countries that have prioritized that particular category
Fig. 5
Fig. 5
Map showing the percentage of priorities that have recorded livestock AMR data for a particular category of antimicrobial class, pathogen, and livestock species per country. Darker colors (more blue-grey) show a higher percentage of countries with livestock AMR data for prioritized categories, lighter colors (lighter blue and yellow) shows a lower percentage. White represents countries without livestock AMR data for prioritized categories, and locations without any prioritized categories are colored light grey

References

    1. Antimicrobial Resistance Collaborators. Global burden of bacterial antimicrobial resistance in 2019: a systematic analysis. Lancet. 2022;399(10325):629–55. - PMC - PubMed
    1. Laxminarayan R, Matsoso P, Pant S, Brower C, Røttingen JA, Klugman K, et al. Access to effective antimicrobials: a worldwide challenge. Lancet. 2016;387(10014):168–75. - PubMed
    1. Woolhouse M, Ward M, Van Bunnik B, Farrar J. Antimicrobial resistance in humans, livestock and the wider environment. Philos Trans R Soc Lond B Biol Sci. 2015;370(1670):20140083. - PMC - PubMed
    1. Singer AC, Shaw H, Rhodes V, Hart A. Review of Antimicrobial Resistance in the Environment and its relevance to environmental regulators. Front Microbiol. 2016;7:1728. - PMC - PubMed
    1. Silbergeld EK, Graham J, Price LB. Industrial food animal production, antimicrobial resistance, and human health. Annu Rev Public Health. 2008;29:151–69. - PubMed

Substances

LinkOut - more resources