. 2024 Sep 26;22(1):454.
doi: 10.1186/s12964-024-01793-6.

A SRC-slug-TGFβ2 signaling axis drives poor outcomes in triple-negative breast cancers

Affiliations

A SRC-slug-TGFβ2 signaling axis drives poor outcomes in triple-negative breast cancers

Charlotte Zoe Angel et al. Cell Commun Signal. .

Abstract

Background: Treatment options for the Triple-Negative Breast Cancer (TNBC) subtype remain limited and the outcome for patients with advanced TNBC is very poor. The standard of care is chemotherapy, but approximately 50% of tumors develop resistance.

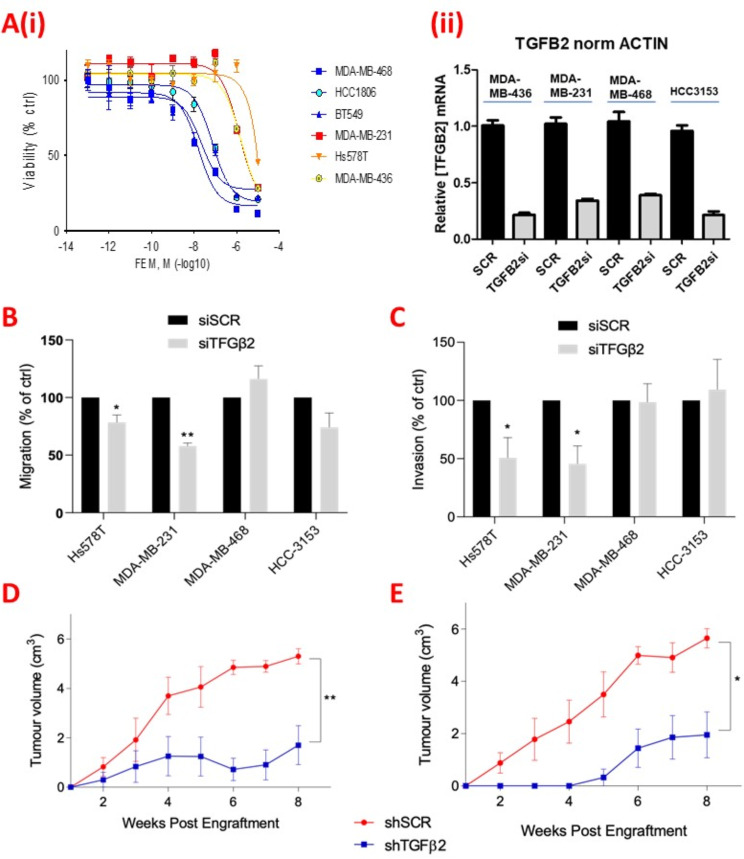
Methods: We performed gene expression profiling of 58 TNBC tumor samples by microarray, comparing chemosensitive with chemoresistant tumors, which revealed that one of the top upregulated genes was TGFβ2. A connectivity mapping bioinformatics analysis predicted that the SRC inhibitor Dasatinib was a potential pharmacological inhibitor of chemoresistant TNBCs. Claudin-low TNBC cell lines were selected to represent poor-outcome, chemoresistant TNBC, for in vitro experiments and in vivo models.

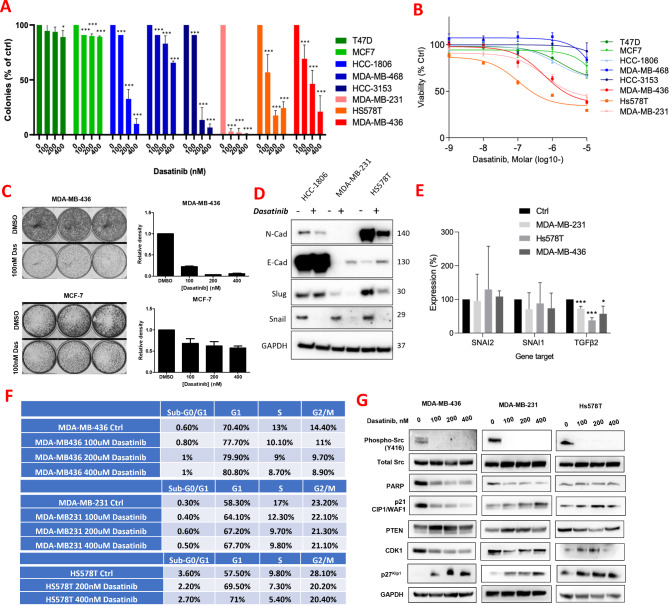
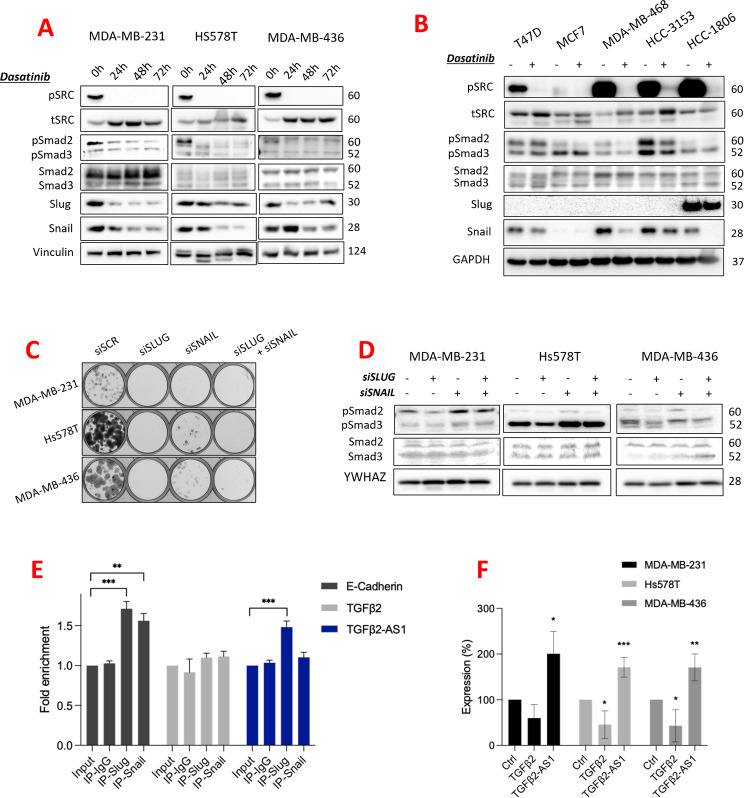
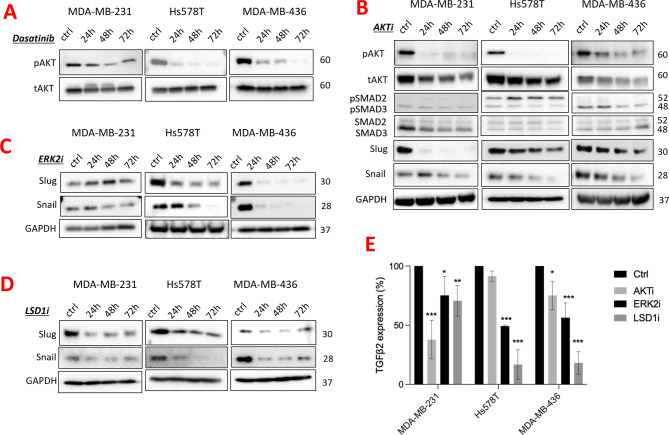
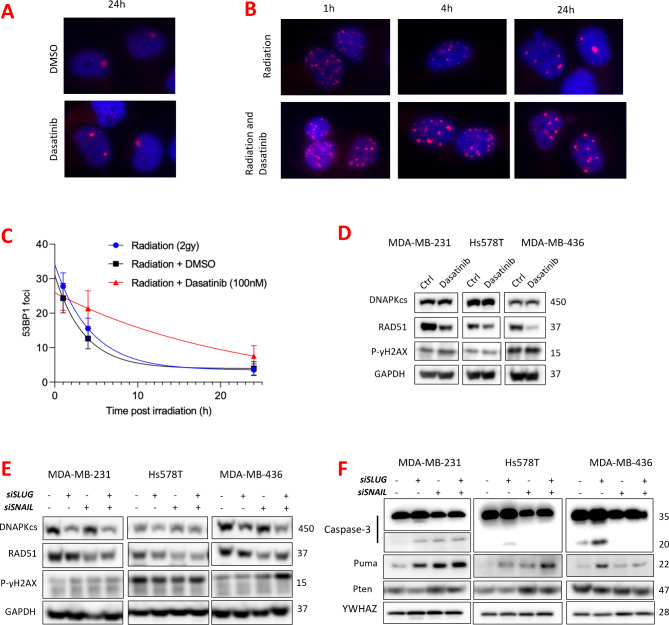
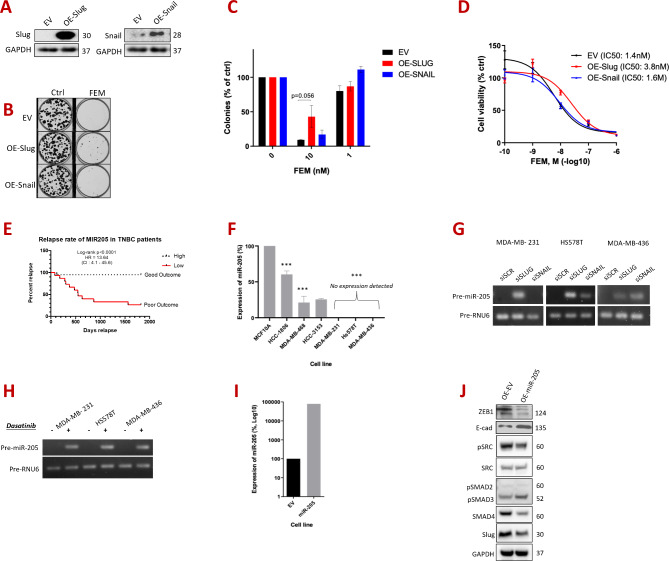
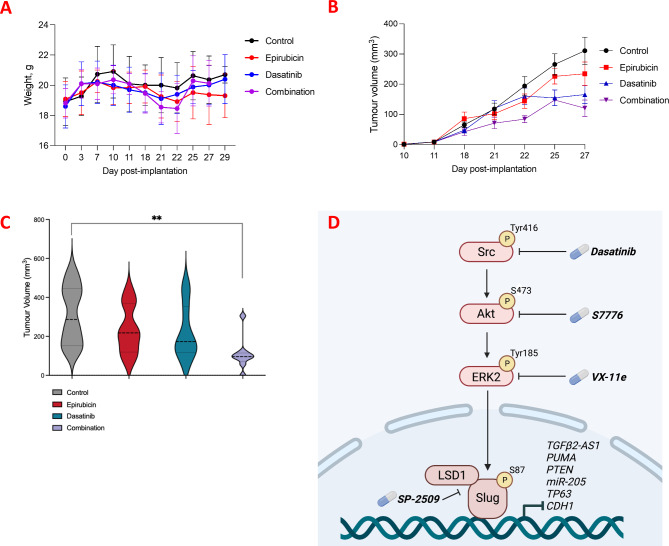
Results: In vitro, we identified a signaling axis linking SRC, AKT and ERK2, which in turn upregulated the stability of the transcription factors, Slug and Snail. Slug was shown to repress TGFβ2-antisense 1 to promote TGFβ2 signaling, upregulating cell survival via apoptosis and DNA-damage responses. Additionally, an orthotopic allograft in vivo model demonstrated that the SRC inhibitor Dasatinib reduced tumor growth as a single agent, and enhanced responses to the TNBC mainstay drug, Epirubicin.

Conclusion: Targeting the SRC-Slug-TGFβ2 axis may therefore lead to better treatment options and improve patient outcomes in this highly aggressive subpopulation of TNBCs.

Plain language summary

In our study, we focused on a particular subtype of aggressive breast cancer called Triple-Negative Breast Cancer (TNBC). We investigated a complex series of events that contribute to poor outcomes in this disease and uncovered a crucial signaling cascade driving tumor growth and progression.At the core of this signaling cascade are three key proteins: SRC, AKT, and ERK2. Together, they form a pathway that activates a transcription factor called Slug. Transcription factors act like molecular switches, controlling the expression of genes. Once Slug is activated, it strongly suppresses genes that would normally restrict cell growth and cell spread.One of the genes downregulated by Slug is TGFB2-AS1. This product of the TGFB2-AS1 gene normally controls levels of its target protein called TGF-beta2 (TGFB2), a protein which has roles in cell growth, cell migration and differentiation. Slug downregulation of TGFB2-AS1 results in higher TGFB2 levels, and this in turn contributes to the uncontrolled growth and spread of cancer cells. TGFB2, and other proteins in this pathway (SRC, AKT, ERK2, and a Slug interactor called LSD1) all maintain the stability of Slug, meaning that Slug levels remain high and drive the aggressive features of this subtype of breast cancer.Overall, our research sheds light on the intricate molecular mechanisms driving aggressive TNBC. It also identifies potential targets for future therapies, aimed at disrupting this harmful signaling pathway and potentially improving patient outcomes for this disease.


Conflict of interest statement

The authors declare no competing interests.

Figures

Fig. 1
Fig. 1
TGFβ2 is upregulated in poor-outcome TNBC. (A) (i) Line graph showing dose responses (as measured by an MTT viability assay) of claudin-low cell lines (MDA-MB-231, Hs578T and MDA-MB-436) and other TNBC subtypes (HCC1806, BT20, HCC70) to a FEM chemotherapy cocktail. (ii) Bar graph showing TGFβ2 qPCR values following knockdown of TGFβ2 by siRNA (TGFβ2si), relative to scrambled control siRNA (SCR) in claudin-low cell lines (Hs578T and MDA-MB-231) and basal-like cell lines (MDA-MB-468 and HCC-3153). Beta-Actin mRNA was used for normalisation, with TGFβ2si values expressed as a fraction of SCR control. (B) Bar graph demonstrating cell migration rates (measured using a ‘wound scratch assay’) following knockdown of TGFβ2 by siRNA (siTGFβ2), relative to scrambled control siRNA (siSCR) in claudin-low cell lines (Hs578T and MDA-MB-231) and basal-like cell lines (MDA-MB-468 and HCC-3153). Graph depicts scratch coverage by siTGFβ2-treated cells as a percentage of siSCR-treated cells, 72 h post-transfection (mean + SD of three independent experiments, analyzed by t-test, where *p < 0.05, **p < 0.005, ***p < 0.001). (C) Bar graph demonstrating cell invasion through matrigel of claudin-low (Hs578T and MDA-MB-231) and basal-like (MDA-MB-468 and HCC-3153) TNBC cell lines treated with siTGFβ2 relative to siSCR. Graph depicts the rates which crystal violet stained siTGFβ2-treated cells invade across a matrigel layer, as a percentage relative to siSCR-treated cells, 72 h post-transfection (mean + SD of three independent experiments, analyzed by t-test, where *p < 0.05, **p < 0.005, ***p < 0.001). (D) Line graph demonstrating mean tumor volume of in vivo xenograft TNBC tumors derived from MDA-MB-231 cells with constitutive expression of shRNA against TGFβ2 (shTGFβ2), compared with scrambled control shRNA (shSCR) (n = 6 per group, mean + SD of tumor volume, analyzed by t-test, where *p < 0.05, **p < 0.005, ***p < 0.001). (E) Line graph demonstrating mean tumor volume of in vivo xenograft TNBC tumors derived from Hs578T cells with constitutive expression of shRNA against TGFβ2 (shTGFβ2) compared with scrambled control shRNA (shSCR) (n = 6 per group, mean + SD of tumor volume, analyzed by t-test, where *p < 0.05, **p < 0.005, ***p < 0.001)
Fig. 2
Fig. 2
The SRC inhibitor Dasatinib is a potential drug treatment for poor-outcome TNBC. (A) Bar graph demonstrating the number of crystal violet stained colonies observed in clonogenic assays, with multiple doses of Dasatinib (x-axis) in TNBC cell lines (HCC-1806, MDA-MB-468, HCC-3153, MDA-MB-231, Hs578T, MDA-MB-436) and hormone receptor positive cell lines (MCF7 and T47D), with clonogenicities expressed as a percentage of control treatment (DMSO). Graph depicts mean + SD of three independent experiments, analyzed by t-test, where *p < 0.05, **p < 0.005, ***p < 0.001. B Line graph depicting the dose response analysis of Dasatinib (as measured by MTT viability assay) in TNBC cell lines (HCC-1806, MDA-MB-468, HCC-3153, MDA-MB-231, Hs578T, MDA-MB-436) and hormone receptor positive cell lines (MCF7 and T47D), relative to the control treatment (DMSO). (C) Clonogenic assays showing the relative sensitivities to Dasatinib of a claudin-low cell line (MDA-MB-436) compared to a luminal breast cancer cell line (MCF7). Cells were seeded at low density and then exposed to the indicated concentrations of Dasatinib for up to 7 days. (D) Western blot analysis of the levels of EMT-associated markers following Dasatinib treatment (at the IC50 for 72 h) in TNBC cell lines HCC-1806, MDA-MB-231 and Hs578T. Membranes were immunoblotted for the epithelial marker E-cadherin (E-cad), and the mesenchymal markers N-cadherin (N-cad), Slug and Snail, with levels measured compared to the control treatment (DMSO). GAPDH was used as a loading control, with respective molecular weights in KDa shown on the right side of each panel. (E) Bar graph demonstrating RT-qPCR quantification of SNAI2, SNAI1, and TGFβ2 following Dasatinib treatment in three claudin-low cell lines (MDA-MB-231, Hs578T, MDA-MB-436), for 48 h at the respective IC50 concentrations. Expression is presented as a percentage relative to the control (DMSO) and normalized relative to mean of HPRT and SDHA housekeeping genes. SNAI2 gene encodes Slug, SNAI1 encodes Snail. Graph represents mean + SD of three independent experiments. *p < 0.05, **p < 0.005, ***p < 0.001. (F) Table showing the % relative cell cycle phases (as assayed by flow cytometry) of MDA-MB-436, MDA-MB-231 and Hs578T claudin-low cell lines following treatments with the indicated Dasatinib concentrations for 72 h. (G) Western blot analysis of several potential phenotypic markers following treatments with the indicated Dasatinib concentrations for 72 h. GAPDH immunoblotting was used as a loading control
Fig. 3
Fig. 3
Slug is essential in TNBC and regulates TGFb2 via TGFb2-AS1 expression. (A) Western blot analysis of claudin-low cell lines (MDA-MB-231, Hs578T, MDA-MB-436) treated with Dasatinib, at IC50 for up to 72 h. Membranes were immunoblotted for Slug and Snail transcription factors, phosphorylated SRC(Tyr416), total SRC, phosphorylated Smad2(Ser465/467) (pSMAD2) and phosphorylated Smad3(Ser423/425) (pSMAD3), total Smad2/3, with levels measured relative to the control treatment (DMSO). Vinculin was used as a loading control with respective molecular weights in KDa shown on the right side of each panel. (B) Western blot analysis of hormone receptor positive cell lines (MCF7 and T47D) and basal-like TNBC cell lines (MDA-MB-468, HCC-3153 and HCC-1806) treated with Dasatinib at the IC50 for 72 h, relative to the control treatment (DMSO). Membranes were immunoblotted for pSMAD2/3, total SMAD2/3, Slug and Snail. GAPDH was used as a loading control with respective molecular weights in KDa shown on the right side of each panel. (C) Images of crystal violet stained clonogenic assays 9 days after knockdown of Slug and Snail by siRNA (siSLUG and siSNAIL) in claudin-low cells (MDA-MB-231, Hs578T, MDA-MB-436), compared to the scrambled control siRNA (siSCR). (D) Western blot analysis of claudin-low cell lines (MDA-MB-231, Hs578T, MDA-MB-436) following siRNA knockdown of SLUG and SNAIL (siSLUG and siSNAIL). Membranes were immunoblotted for Slug, Snail, phosphorylated SMAD2/3 and total SMAD2/3. YWHAZ is included as a loading control, with respective molecular weights in KDa shown on the right side of each panel. (E) Bar graph demonstrating ChIP-PCR data using primers specific to TGFβ2-AS1 and TGFβ2, following pulldown of Slug, Snail, or control antibody (IgG). An E-Cadherin promoter region was included as positive control for Slug and Snail ChIPs. The graph depicts fold enrichment, normalized to expression in the Input sample, and represents the mean + SD of three independent experiments. *p < 0.05, **p < 0.005, ***p < 0.001. (F) Bar graph demonstrating RT-qPCR quantification of TGFβ2 and TGFβ2-AS1 in claudin-low cell lines (MDA-MB-231, Hs578T, MDA-MB-436) following knockdown of SNAI2 (siSLUG) relative to the control (siSCR). Expression was normalized relative to mean of HPRT and SDHA housekeeping genes. The graph represents mean + SD of three independent experiments. *p < 0.05, **p < 0.005, ***p < 0.001
Fig. 4
Fig. 4
Regulation of Slug and Snail in claudin-low TNBC. (A) Western blot analysis of claudin-low cell lines (MDA-MB-231, Hs578T, MDA-MB-436) following Dasatinib treatment (at IC50), with membranes immunoblotted for phosphorylated AKT (Ser473) and total AKT. Respective molecular weights in KDa are shown on the right side of each panel. (B) Western blot analysis of claudin-low cell lines (MDA-MB-231, Hs578T, MDA-MB-436) treated with a pan-AKT inhibitor, S7776 (at IC50 for up to 72 h) compared to the control (DMSO). Membranes were immunoblotted for pAKT(Ser473), AKT, phosphorylated SMAD2/3, total SMAD2/3, Slug, and Snail. GAPDH was used as a loading control with respective molecular weights in KDa shown on right side of each panel. (C) Western blot analysis showing reduced protein levels of Slug and Snail in claudin-low cell lines (MDA-MB-231, Hs578T, MDA-MB-436) treated with ERK2 inhibitor (VX-11), relative to the control (DMSO). Membranes were immunoblotted for Slug and Snail. GAPDH was used as a loading control with respective molecular weights in KDa shown on the right side of each panel. (D) Western blot analysis of claudin-low cell lines (MDA-MB-231, Hs578T, MDA-MB-436) treated with an LSD1 inhibitor (SP-2509), relative to the control (DMSO). Membranes were immunoblotted for Slug and Snail. GAPDH was used as a loading control with respective molecular weights in KDa shown on the right side of each panel. (E) Bar graph demonstrating RT-qPCR quantification of claudin-low cell lines (MDA-MB-231, Hs578T, MDA-MB-436) treated with inhibitors of AKT, ERK2 and LSD1 at the IC50, quantifying expression of TGFβ2, SNAI2 and SNAI1, and presented as a percentage relative to the control (DMSO). Expression is normalized to the mean of HPRT and SDHA housekeeping genes. Graph represents mean + SD of three independent experiments. *p < 0.05, **p < 0.005, ***p < 0.001
Fig. 5
Fig. 5
Characterizing the role of Slug in claudin-low TNBC biology. (A) Immunofluorescence-based detection of DNA double strand break repair foci in MDA-MB-436 cells after 24 h of Dasatinib treatment, compared with the control condition (DMSO). Blue stain represents DAPI-stained nuclei, red stain depicts 53BP1 foci. (B) Immunofluorescence-based detection of DNA double strand break repair foci in MDA-MB-436 cells treated for 24 h with Dasatinib at the IC50 and then subjected to ionising radiation (2gy). Left-hand panels demonstrate double-strand break foci 1 h following radiation, and then 4 h and 24 h post irradiation. The combination of Dasatinib and radiation is compared with the control condition (radiation and DMSO). Blue stain represents DAPI-stained nuclei, red stain depicts 53BP1 foci. (C) Line graph demonstrating the repair kinetics of the radiation-induced 53BP1 foci following ionising radiation (2gy), with cells pre-treated with Dasatinib (at IC50 for 48 h), relative to control (DMSO). Points represent the mean number of foci per cell of three independent experiments and the respective standard error. Data were corrected for the baseline mean foci value and fitted to an exponential decay equation. *p < 0.05, **p < 0.005, ***p < 0.001. (D) Western blot analysis of claudin-low cells (MDA-MB-231, Hs578T, MDA-MB-436) treated with Dasatinib at the IC50 compared to the control (DMSO). Membranes were immunoblotted for DNAPKcs, RAD51 and phosphorylated γH2AX (Ser139). GAPDH was used as a loading control with respective molecular weights in KDa shown on the right side of each panel. (E) Western blot of claudin-low cells with knockdown of Slug (siSLUG) and Snail (siSNAIL) compared to the control (siSCR). Membranes were immunoblotted for phosphorylated γH2AX (ser139), RAD51, and DNAPKcs. GAPDH was used as a loading control with respective molecular weights in KDa shown on the right side of each panel. (F) Western blot analysis of claudin-low cells (MDA-MB-231, Hs578T, MDA-MB-436) with siRNA knockdown of Slug (siSLUG) and Snail (siSNAIL) compared to the control (siSCR). Membranes were immunoblotted for Caspase-3, phosphorylated SMAD2/3, total SMAD2/3, Puma and Pten. YWHAZ was used as a loading control with respective molecular weights in KDa shown on the right side of each panel
Fig. 6
Fig. 6
Exploration of the role of Slug and Snail in modulating chemoresistance in claudin-low TNBC. (A) Western blot analysis of basal-like TNBC cell line (MDA-MB-468) with ectopic overexpression of Slug and Snail, compared to an empty vector (EV) control overexpression. Membranes were immunoblotted for Slug and Snail, with GAPDH included as a loading control and with respective molecular weights in KDa shown on the right side of each panel. (B) Images of clonogenic assays of MDA-MB-468 cells with overexpression of EV, Slug or Snail, 9 days following treatment with either FEM chemotherapy, or control treatment (DMSO). (C) Bar graph depicting the clonogenicity values of cells from panel B (namely, MDA-MB-468 with overexpression of EV, Slug or Snail), 9 days following treatment with FEM or control (DMSO). (D) Line graph depicting the dose response analysis of FEM (measured by MTT viability assay) in MDA-MB-468 with overexpression of EV, Slug, or Snail. (E) Bar graph demonstrating RT-qPCR quantification of pre-miR-205 in basal-like TNBC cell lines (MDA-MB-468, HCC-1806 and HCC-3153) and claudin-low cell lines (MDA-MB-231, Hs578T, MDA-MB-436), relative to non-transformed (MCF10A). Expression normalized to the mean of GAPDH and HPRT housekeeping genes. Graph represents mean + SD of three independent experiments. *p < 0.05, **p < 0.005, ***p < 0.001. (F) Kaplan-Meier plot representing survival in TNBC patients stratified by miR-205expression (KM Plotter).(G) Semi-quantitative PCR of pre-miR-205 expression in claudin-low cells (MDA-MB-231, Hs578T, MDA-MB-436) with knockdown of Slug (siSLUG) and Snail (siSNAIL). Expression was quantified relative to pre-miR-RNU6. (H) Semi-quantitative PCR of pre-miR-205 expression in claudin-low cells (MDA-MB-231, Hs578T, MDA-MB-436) treated with Dasatinib (at the IC50 for 72 h). Expression was quantified relative to pre-miR-RNU6. (I) Bar graph illustrating RT-qPCR quantification of pre-miR-205 (miR-205) in Hs578T cells with exogenous overexpression of pre-miR-205, relative to the control Hs578T cells overexpressing the empty vector (EV). Expression is normalized to mean of SDHA and HPRT housekeeping genes. Both cell lines were generated as mixed populations. (J) Western blot analysis of Hs578T cells with exogenous overexpression of pre-miR-205 compared with EV-overexpressing Hs578T. Membranes were immunoblotted for ZEB1, E-cadherin (E-cad), pSRC, SRC, pSMAD2/3, SMAD4, and Slug. GAPDH was included as a loading control, with respective molecular weights in KDa shown on the right side of the panel
Fig. 7
Fig. 7
In vivo exploration of Dasatinib in allograft orthotopic model of claudin-low TNBC. (A) Line graph depicting mouse weights in grams throughout the duration of the study by treatment group (Epirubicin, Dasatinib, and a combination of Epirubicin and Dasatinib, all expressed relative to the Control, DMSO), and shown as mean + SD. N = 6 per group. (B) Line graph depiction of tumor volumes (mm3) throughout the duration of the study by treatment group (Epirubicin, Dasatinib, and a combination of Epirubicin and Dasatinib, relative to the Control, DMSO), and shown as mean + SD. N = 6 per group. (C) Box and violin plot of tumor volumes (mm3) by treatment group (DMSO control, Epirubicin, Dasatinib, and a combination of Epirubicin and Dasatinib) at the end of the study (day 29 post-implantation). *p < 0.05, **p < 0.005, ***p < 0.001. (D) Diagrammatic depiction of the hypothesized pathway driving poor-outcome TNBC, where SRC signals via AKT and ERK2 to stabilise the Slug/Snail transcription factor complex (including LSD1), which in turn represses expression of TGFβ2-AS1 and other tumor suppressors (such as PTEN, PUMA, etc.). Some suggested points of intervention with inhibitory drugs are shown

References

    1. Bragado P, Estrada Y, Parikh F, Krause S, Capobianco C, Farina HG, Schewe DM, Aguirre-Ghiso JA. TGF-beta2 dictates disseminated tumour cell fate in target organs through TGF-beta-RIII and p38alpha/beta signalling. Nat Cell Biol. 2013;15(11):1351–61. - PMC - PubMed
    1. Chen EY, Tan CM, Kou Y, Duan Q, Wang Z, Meirelles GV, Clark NR, Ma’ayan A. Enrichr: interactive and collaborative HTML5 gene list enrichment analysis tool. BMC Bioinformatics. 2013;14:128. - PMC - PubMed
    1. Chen H, Zhu G, Li Y, Padia RN, Dong Z, Pan ZK, Liu K, Huang S. Extracellular signal-regulated kinase signaling pathway regulates breast cancer cell migration by maintaining slug expression. Cancer Res. 2009;69(24):9228–35. - PMC - PubMed
    1. Corrales-Sanchez V, Noblejas-Lopez MDM, Nieto-Jimenez C, Perez-Pena J, Montero JC, Burgos M, Galan-Moya EM, Pandiella A, Ocana A. Pharmacological screening and transcriptomic functional analyses identify a synergistic interaction between dasatinib and olaparib in triple-negative breast cancer. J Cell Mol Med. 2020;24(5):3117–27. - PMC - PubMed
    1. Dhasarathy A, Phadke D, Mav D, Shah RR, Wade PA. The transcription factors snail and slug activate the transforming growth factor-beta signaling pathway in breast cancer. PLoS ONE. 2011;6(10):e26514. - PMC - PubMed

MeSH terms

LinkOut - more resources