. 2024 Oct 16;146(41):28282-28295.
doi: 10.1021/jacs.4c08869. Epub 2024 Sep 27.

Inhibitor Development for α-Synuclein Fibril's Disordered Region to Alleviate Parkinson's Disease Pathology

Affiliations

Inhibitor Development for α-Synuclein Fibril's Disordered Region to Alleviate Parkinson's Disease Pathology

Shenqing Zhang et al. J Am Chem Soc. .

Abstract

The amyloid fibrils of α-synuclein (α-syn) are crucial in the pathology of Parkinson's disease (PD), with the intrinsically disordered region (IDR) of its C-terminal playing a key role in interacting with receptors like LAG3 and RAGE, facilitating pathological neuronal spread and inflammation. In this study, we identified Givinostat (GS) as an effective inhibitor that disrupts the interaction of α-syn fibrils with receptors such as LAG3 and RAGE through high-throughput screening. By exploring the structure-activity relationship and optimizing GS, we developed several lead compounds, including GSD-16-24. Utilizing solution-state and solid-state NMR, along with cryo-EM techniques, we demonstrated that GSD-16-24 binds directly to the C-terminal IDR of α-syn monomer and fibril, preventing the fibril from binding to the receptors. Furthermore, GSD-16-24 significantly inhibits the association of α-syn fibrils with membrane receptors, thereby reducing neuronal propagation and pro-inflammatory effects of α-syn fibrils. Our findings introduce a novel approach to mitigate the pathological effects of α-syn fibrils by targeting their IDR with small molecules, offering potential leads for the development of clinical drugs to treat PD.


Conflict of interest statement

The authors declare no competing financial interest.

Figures

Figure 1
Figure 1
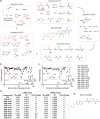
Discovery of GS to disrupt receptor binding of α-syn fibril by HTS. (a) Schematic of the ELISA-based high-throughput screening assay, created with BioRender.com. ELISA plates are precoated with LAG3 D1. 100 nM of FLAG-tagged α-syn PFFs are mixed with 20 μM of each compound before being added to each well. Bound α-syn PFFs are detected using a horseradish peroxidase (HRP)-conjugated anti-FLAG antibody (Anti-FLAG-Ab-HRP). The color reaction indicates the inhibitory effect. (b) Discovery of Givinostat (GS) by LAG3 high-throughput screening assay. Replicate 1 and 2 for GS overlap because their values are nearly identical. n = 2 independent samples. (c) Chemical structure of GS. (d, e) IC50 of GS inhibiting the binding of α-syn fibrils to receptors determined by LAG3 (d) and RAGE (e) ELISA assay. Data are shown as mean ± s.d., n = 3 independent samples. Nonlinear regression is used to fit each curve to a sigmoidal four parameters [inhibitor]-response (variable slope) equation in GraphPad Prism with R2 = 0.9729 for LAG3 assay curve and 0.9865 for RAGE assay curve, respectively. (f–h) Interactions between GS and α-syn-PFF (f), LAG3 D1 (g), and vRAGE (h) measured by ITC.
Figure 2
Figure 2
Rational design of GS derivatives with enhanced inhibitory activity. (a) Rational design of GSDs. GS was divided into five parts, with each part optimized in a clockwise order. The effective functional groups were highlighted in red. (b, c) Validation of GSDs by LAG3 (b) and RAGE (c) ELISA assay. Compounds were tested at a concentration of 20 μM. Data are shown as mean ± s.e.m., n = 3 independent samples. (d) IC50 of hit GSDs inhibiting the binding of α-syn fibrils to LAG3 D1 and vRAGE second validated by LAG3 and RAGE ELISA assay. n = 3 independent samples. Nonlinear regression is used to fit each curve to a sigmoidal four parameters [inhibitor]-response (variable slope) equation in GraphPad Prism. (e) Chemical structure of GSD-16-24, representative GSD. Optimized parts are highlighted in color.
Figure 3
Figure 3
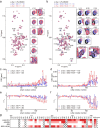
GS and GSD-16-24 interact with the C-terminal IDR of α-syn monomer. (a, b) Overlay of the 2D 1H–15N HSQC spectra of α-syn alone (black) and in the presence of GS (a) or GSD-16-24 (b) at molar ratios of 1:10 (blue) and 1:20 (pink), respectively. (Right) Representative residues with significant CSD and intensity drop zoomed in. (c, d) Calculated CSD of α-syn in the presence of GS (a) or GSD-16-24 (b) at the molar ratios of 1:10 (blue) and 1:20 (pink). The CSDs were calculated using the empirical equation ΔCSD = [ΔHN2 + 0.0289(ΔN2)]1/2, where ΔHN and ΔN represent the CSDs of amide proton (HN) and nitrogen (N), respectively. The dashed lines indicate the residues with CSD > 0.003 ppm (c) and CSD > 0.015 ppm (d), which are chosen based on the commonly employed approach that involves using the standard deviation of CSDs across all residues., (e, f) Calculated I/I0 of α-syn in the presence of GS (e) or GSD-16-24 (f) at the molar ratios of 1:10 (blue) and 1:20 (pink). The dashed lines indicate the residues with I/I0 < 0.7. (g) CSD scores of α-syn in the presence of LAG3 D1 (1:4), vRAGE (1:2), GS (1:20), and GSD-16-24 (1:20) at the indicated molar ratios. “X-marks” denote unassigned residues. Scoring criteria are detailed in the Method section.
Figure 4
Figure 4
GSD-16-24 predominately binds to the C-terminal IDR of α-syn fibril. (a, b) Interactions between GSD-16-24 and α-syn-PFF (a) and α-syn1–100 PFF (b) measured by ITC. (c) Central slices of the 3D maps of α-syn fibrils alone (Apo-α-syn) and in complex with GSD-16-24 (+ GSD-16-24). (d) Overlay of the 2D 1H–15N HSQC spectra of α-syn fibrils in the absence (cyan-blue) and presence of GSD-16-24 at molar ratios (α-syn: GSD-16-24) of 1:10 (red). The intensity factor between successive levels is set to 1.2. (e) Calculated I/I0 of α-syn fibrils in the presence of GSD-16-24 at the molar ratio of 1:1 (light pink), 1:5 (pink), and 1:10 (red). The error of I/I0 was calculated according to Gauss’ error propagation, in the same way as in the previous publication. The domain organization of α-syn is shown.
Figure 5
Figure 5
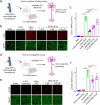
GSD-16-24 prevents α-syn-fibril-induced neuronal inflammation. (a) Schematic of BV2 cell surface binding assay, created with BioRender.com. (b) Representative images of the α-syn surface binding on BV2 cells treated with buffer, 200 nM α-syn monomer, 200 nM α-syn PFFs, and 200 nM α-syn PFFs preincubated with 0.2, 1, and 5 μM GSD-16-24. The fixed cells were immunostained for DAPI (blue) and α-syn (red). Scale bar, 25 μm. (c) Quantification of the bound α-syn intensity normalized to DAPI intensity. Data are shown as mean ± s.d. of 6 images in three independent experiments. Statistical significance was measured using one-way ANOVA followed by Tukey’s posthoc test. **, p < 0.01, ****, p < 0.0001. (d) Schematic of BV2 cell inflammation assay, created with BioRender.com. (e–g) Statistical analysis of the mRNA fold change of TNF-α (e), IL-1β (f), and IL-6 (g). BV2 cells were treated with PBS, lipopolysaccharide (LPS), α-syn monomer, α-syn PFFs, and α-syn PFFs preincubated with 0.2, 1, and 5 μM GSD-16-24. Mean ± s.d., n = 4. Statistical significance was measured using one-way ANOVA followed by Tukey’s posthoc test. **, p < 0.01, ***, p < 0.001, ****, p < 0.0001, ns, no significance.
Figure 6
Figure 6
GSD-16-24 prevents α-syn-fibril-induced neuronal propagation. (a) Schematic of neuron surface binding assay, created with BioRender.com. (b) Representative images of the α-syn surface binding on rat primary cortical neurons treated with buffer, 200 nM α-syn monomer, 200 nM α-syn PFFs, and 200 nM α-syn PFFs preincubated with 0.2, 1, and 5 μM GSD-16-24. The fixed neurons were immunostained for MAP2 (green) and α-syn (red). Scale bar, 50 μm. (c) Quantification of the bound α-syn intensity normalized to MAP2 intensity. Data are shown as mean ± s.d. of 6 images in three independent experiments. Statistical significance was measured using one-way ANOVA followed by Tukey’s posthoc test. **, p < 0.01, ****, p < 0.0001. (d) Schematic of neuron propagation assay, created with BioRender.com. (e) Representative images of rat primary cortical neurons treated with buffer, 200 nM α-syn monomer, 200 nM α-syn PFFs, and 200 nM α-syn PFFs preincubated with 0.2, 1, and 5 μM GSD-16-24. The fixed neurons were immunostained for MAP2 (green) and phosphorylated S129 α-syn (pS129, red). Scale bar, 25 μm. (f) Quantification of the pS129 intensity normalized to the MAP2 intensity. Data are shown as mean ± s.d. of 6 images in three independent experiments. Statistical significance was measured using one-way ANOVA followed by Tukey’s posthoc test. *, p < 0.05, ****, p < 0.0001.

References

    1. Spillantini M. G.; et al. Alpha-synuclein in Lewy bodies. Nature 1997, 388, 839–840. 10.1038/42166. - DOI - PubMed
    1. Kam T.-I.; et al. Poly(ADP-ribose) drives pathologic α-synuclein neurodegeneration in Parkinson’s disease. Science 2018, 362, eaat8407.10.1126/science.aat8407. - DOI - PMC - PubMed
    1. Goedert M. Alpha-synuclein and neurodegenerative diseases. Nat. Rev. Neurosci 2001, 2, 492–501. 10.1038/35081564. - DOI - PubMed
    1. Baba M.; et al. Aggregation of alpha-synuclein in Lewy bodies of sporadic Parkinson’s disease and dementia with Lewy bodies. Am. J. Pathol. 1998, 152, 879–884. - PMC - PubMed
    1. Li D.; Liu C. Hierarchical chemical determination of amyloid polymorphs in neurodegenerative disease. Nat. Chem. Biol. 2021, 17, 237–245. 10.1038/s41589-020-00708-z. - DOI - PubMed

MeSH terms