. 2024 Sep;30(9):e70067.
doi: 10.1111/cns.70067.

Vitamin D3 Attenuates Neuropathic Pain via Suppression of Mitochondria-Associated Ferroptosis by Inhibiting PKCα/NOX4 Signaling Pathway

Affiliations

Vitamin D3 Attenuates Neuropathic Pain via Suppression of Mitochondria-Associated Ferroptosis by Inhibiting PKCα/NOX4 Signaling Pathway

Wencui Zhang et al. CNS Neurosci Ther. 2024 Sep.

Abstract

Aims: Neuropathic pain remains a significant unmet medical challenge due to its elusive mechanisms. Recent clinical observations suggest that vitamin D (VitD) holds promise in pain relief, yet its precise mechanism of action is still unclear. This study explores the therapeutical role and potential mechanism of VitD3 in spared nerve injury (SNI)-induced neuropathic pain rat model.

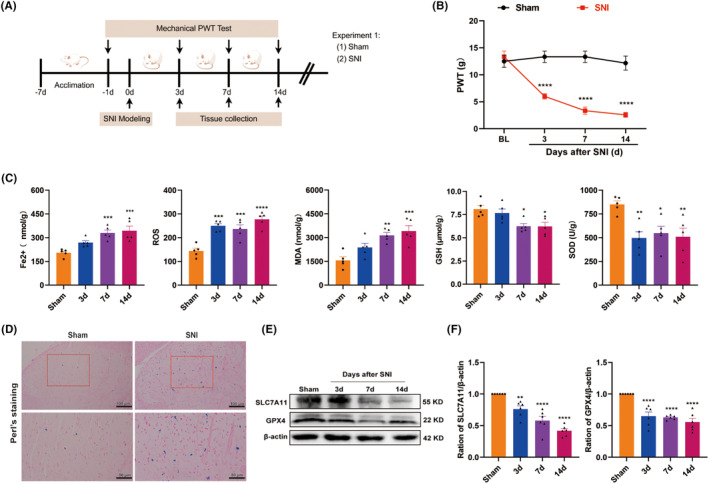
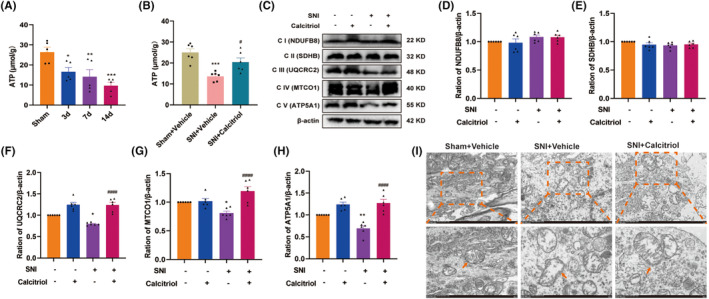
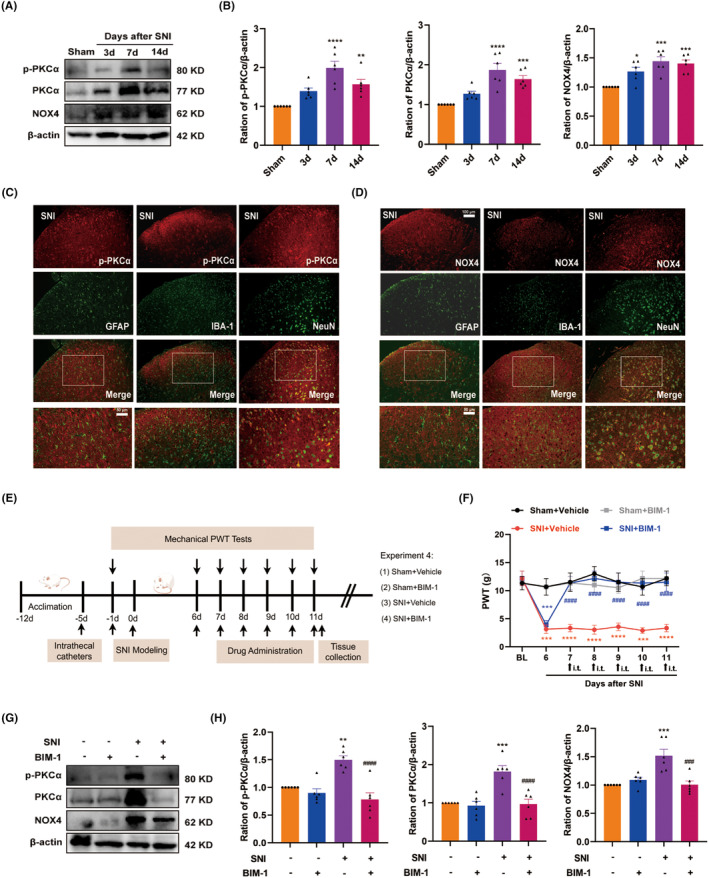
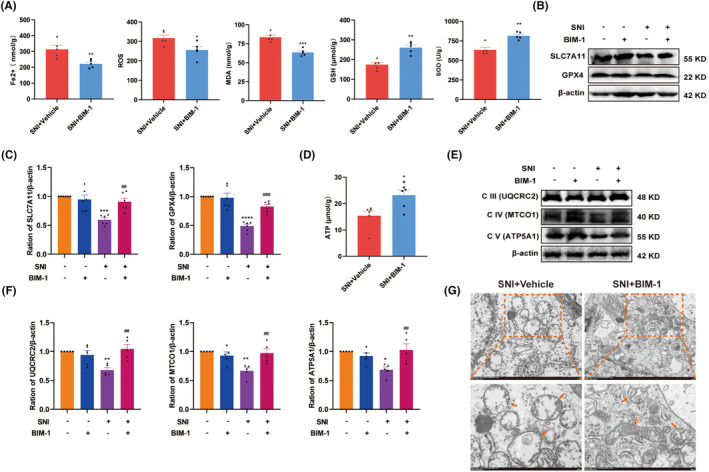
Methods: The analgesic effects and underlying mechanisms of VitD3 were evaluated in SNI and naïve rat models. Mechanical allodynia was assessed using the Von Frey test. Western blotting, immunofluorescence, biochemical assay, and transmission electron microscope (TEM) were employed to investigate the molecular and cellular effects of VitD3.

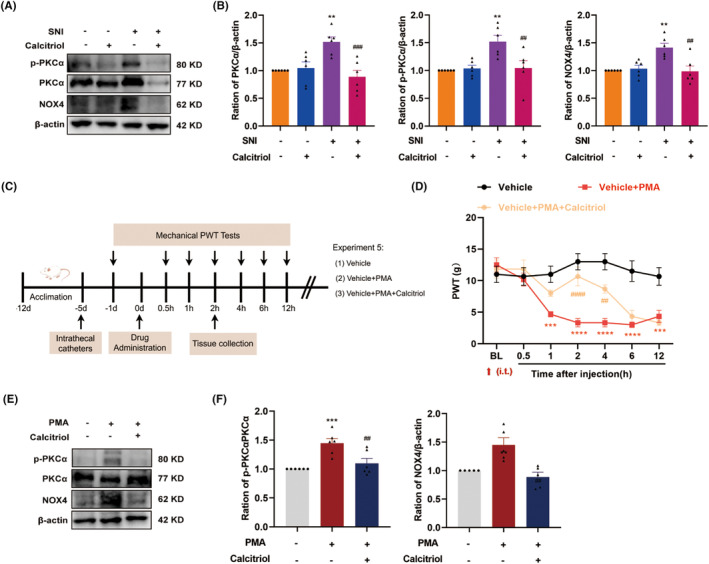
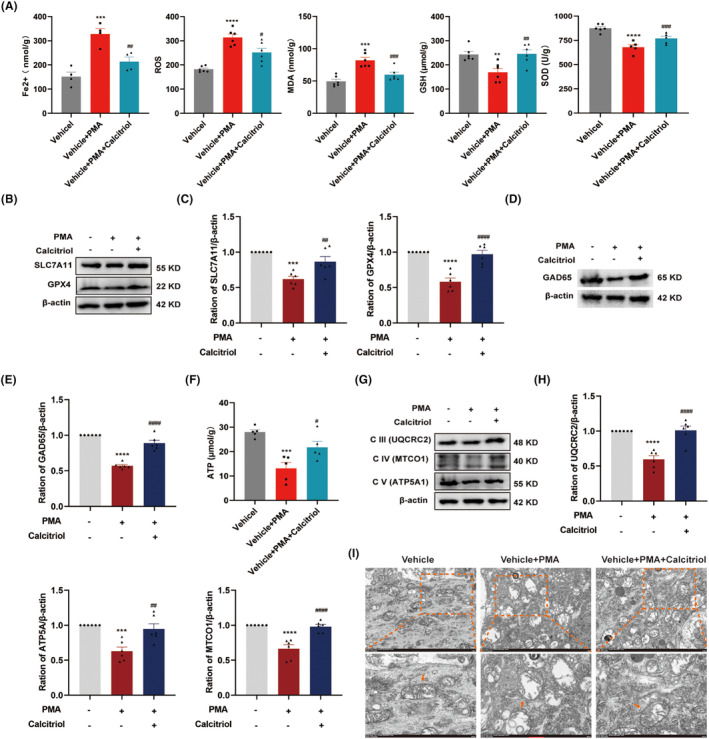
Results: Ferroptosis was observed in the spinal cord following SNI. Intrathecal administration of VitD3, the active form of VitD, activated the vitamin D receptor (VDR), suppressed ferroptosis, and alleviated mechanical nociceptive behaviors. VitD3 treatment preserved spinal GABAergic interneurons, and its neuroprotective effects were eliminated by the ferroptosis inducer RSL3. Additionally, VitD3 mitigated aberrant mitochondrial morphology and oxidative metabolism in the spinal cord. Mechanistically, VitD3 inhibited SNI-induced activation of spinal PKCα/NOX4 signaling. Inhibition of PKCα/NOX4 signaling alleviated mechanical pain hypersensitivity, accompanied by reduced ferroptosis and mitochondrial dysfunction in SNI rats. Conversely, activation of PKCα/NOX4 signaling in naïve rats induced hyperalgesia, ferroptosis, loss of GABAergic interneurons, and mitochondrial dysfunction in the spinal cord, all of which were reversed by VitD3 treatment.

Conclusions: Our findings provide evidence that VitD3 attenuates neuropathic pain by preserving spinal GABAergic interneurons through the suppression of mitochondria-associated ferroptosis mediated by PKCα/NOX4 signaling, probably via VDR activation. VitD, alone or in combination with existing analgesics, presents an innovative therapeutic avenue for neuropathic pain.

Keywords: GABAergic interneurons; PKCα/NOX4 signaling; ferroptosis; mitochondrial dysfunction; neuropathic pain; vitamin D3.


Conflict of interest statement

The authors declare no conflicts of interest.

Figures

FIGURE 1
FIGURE 1
SNI‐induced mechanical allodynia and ferroptosis in the spinal cord. (A) The schematic timeline of the experimental procedure. (B) Mechanical allodynia evaluated by PWT at baseline and 3, 7, and 14 days after sham or SNI (n = 6 per group). ****p < 0.0001 versus sham group. (C) Time course of Fe2+, ROS, MDA, GSH, and SOD levels in the spinal cord of SNI rats (n = 5 per group). *p < 0.05, **p < 0.01, ***p < 0.001, ****p < 0.0001 versus sham group. (D) Representative pictures of Perl's staining in spinal cord were shown (n = 4 per group). (E, F) Time course of ferroptosis‐related proteins SLC7A11 and GPX4 in the spinal cord after SNI (n = 6 per group). β‐Actin was used as an internal control, **p < 0.01, ****p < 0.0001 versus sham group.
FIGURE 2
FIGURE 2
Analgesic effect of VitD3 on mechanical allodynia in SNI rats. (A, B) A single dose of calcitriol (0.5, 1 and 2 μg, i.t.) or vehicle was administrated on Day 7 following SNI. Mechanical allodynia was measured before injection and 1, 2, 4, and 6 h after injection (n = 6 per group). ***p < 0.001, ****p < 0.0001 versus SNI + Vehicle group. (C, D) Calcitriol (1 μg, i.t.) was given once daily from Day 7 to Day 11 following SNI. Mechanical allodynia was conducted at 2 h after calcitriol injection from Day 7 to Day 11 following SNI (n = 6 per group). ***p < 0.001, ****p < 0.0001 versus Sham + Vehicle group, #### p < 0.0001 versus SNI + Vehicle group. (E) Time course of VDR in the spinal cord after SNI (n = 6 per group). *p < 0.05, ****p < 0.0001 versus sham group. (F) Representative blots and quantification of VDR in the spinal cord of different groups were presented (n = 6 per group). ***p < 0.001 versus Sham + Vehicle group, ## p < 0.01 versus SNI + Vehicle group. (G) Double immunofluorescence of VDR (red) and GFAP (green), IBA1 (green), and NeuN (green) in the spinal cord of SNI rats (n = 4 per group). The white boxes indicated typical co‐staining cells. Scale bar: 100 and 50 μm.
FIGURE 3
FIGURE 3
VitD3 attenuated ferroptosis and GABAergic interneuron loss in the spinal cord of SNI rats. (A) The levels of Fe2+, ROS, MDA, GSH, and SOD in the spinal cord were measured with corresponding kits (n = 5–6 per group). *p < 0.05, **p < 0.01, ***p < 0.001 versus Sham + Vehicle group, # p < 0.05, ## p < 0.01 versus SNI + Vehicle group. (B, C) Representative blots and quantification of SLC7A11 and GPX4 in the spinal cord of different groups were presented (n = 6 per group). ****p < 0.0001 versus the Sham + Vehicle group, ### p < 0.001, #### p < 0.0001 versus the SNI + Vehicle group. (D, E) Representative blots and quantification of GAD65 in the spinal cord of different groups were presented (n = 6 per group). ****p < 0.0001 versus the Sham + Vehicle group, #### p < 0.0001 versus the SNI + Vehicle group. (F) The timeline of experimental procedures. (G) Rats were intrathecally administered with calcitriol (1 μg) alone or co‐application with RSL3 (5 μg) once daily from Day 7 to Day 11 following SNI. Mechanical allodynia was conducted at 2 h after daily treatment, **p < 0.01, ***p < 0.001 versus SNI + Calcitriol group, n = 6 per group. (H, I) Representative western blot bands and quantification of GAD65 and GPX4 in the spinal cord of SNI + Calcitriol and SNI + Calcitriol+RSL3 group were presented. ****p < 0.0001 < 0.0001 versus SNI + Calcitriol group, n = 6 per group.
FIGURE 4
FIGURE 4
VitD3 mitigated SNI‐induced mitochondrial dysfunction in the spinal cord. (A, B) The content of ATP in the spinal cord was measured. (C–H) Representative western blot bands of mitochondrial ETC complexes (NDUFB8, SDHB, UQCRC2, MTCO1, and ATP5F1A) in the spinal cord of different groups were presented. Quantitative analysis of scanning densitometry was performed. *p < 0.05, **p < 0.01 versus Sham + Vehicle group, #### p < 0.0001 versus SNI + Vehicle group, n = 4–6 in each group. (I) Representative electron morphological changes in the mitochondrial in the spinal cord among groups. The labeled yellow boxes highlight the mitochondrial ultrastructure. scale bar: 1 μm and 500 nm, n = 3 in each group.
FIGURE 5
FIGURE 5
PKCα/NOX4 signaling pathway was involved in the development of SNI‐induced neuropathic pain. (A, B) Time course of p‐PKCα, PKCα, and NOX4 in the spinal cord of after SNI (n = 6 per group). *p < 0.05, **p < 0.01, ***p < 0.001, ****p < 0.0001 versus sham group. (C, D) Double immunofluorescence of p‐PKCα and NOX4 with GFAP, IBA1, and NeuN in the spinal dorsal horn of SNI rats (n = 4 per group). The white boxes indicated typical co‐staining cells. Scale bar: 100 and 50 μm. (E) The time schedule of the present experiment. (F) BIM‐1 (100 μM, i.t.) was given once daily from Day 7 to Day 11 following SNI. Mechanical allodynia was performed at 1.5 h after daily treatment. ***p < 0.001, ****p < 0.0001 versus Sham + Vehicle group, #### p < 0.000 versus SNI + Vehicle group. (G, H) Representative western blot bands and quantification of J p‐PKCα, PKCα, and NOX4 in the spinal cord among groups, **p < 0.01, ***p < 0.001 versus the sham group, ### p < 0.001, #### p < 0.0001 versus the SNI + Vehicle group, n = 6 in each group.
FIGURE 6
FIGURE 6
Pharmacological inhibition of PKCα/NOX4 signaling pathway suppressed ferroptosis and mitochondrial dysfunction. (A) The levels of Fe2+, ROS, MDA, GSH, and SOD in the spinal cord of SNI + Vehicle and SNI + BIM‐1 groups were measured (n = 5–6 per group). *p < 0.05, **p < 0.01, ***p < 0.001 versus SNI + Vehicle group. (B, C) Representative blots and quantification of SLC7A11 and GPX4 in the spinal cord of different groups were presented (n = 5–6 per group). ***p < 0.001, ****p < 0.0001 versus sham group, ## p < 0.01, ### p < 0.00 versus SNI + Vehicle group. (D) The levels of ATP in spinal cord of SNI + Vehicle and SNI + BIM‐1 groups were measured (n = 6 per group). *p < 0.05 versus SNI + Vehicle group. (E, F) Representative western blot bands of mitochondrial ETC Complex III‐V (UQCRC2, MTCO1, and ATP5F1A) in the spinal cord of different groups were presented. Quantitative analysis of scanning densitometry was performed. *p < 0.05, **p < 0.01 versus Sham + Vehicle group, # p < 0.05, ## p < 0.01 versus SNI + Vehicle group, n = 5 in each group. (G) Representative electron morphological changes of the mitochondrial in the spinal cord of SNI + Vehicle and SNI + BIM‐1 groups (n = 3 per group). The labeled yellow boxes highlight the mitochondrial ultrastructure. scale bar: 1 μm and 500 nm.
FIGURE 7
FIGURE 7
VitD3 alleviated pain hypersensitivity via inhibiting PKCα/NOX4 signaling pathway. (A, B) Representative western blot bands and quantification of p‐PKCα, PKCα, and NOX4 in the spinal cords of animals from different groups were presented. **p < 0.01 versus Sham + Vehicle group, ## p < 0.01, ### p < 0.001 versus SNI + Vehicle group, n = 6 in each group. (C) Time schedule of the experiment. (D) Naïve rats were intrathecally injected with a single dose of PMA (2.5 μg) alone or in combination with calcitriol (1 μg). Mechanical allodynia was measured before injection and 0.5, 1, 2, 4, 6, and 12 h after injection. ***p < 0.001, ****p < 0.0001 compared with Vehicle‐treated rats, ## p < 0.01, #### p < 0.0001 compared with PMA‐treated rats, n = 6 in each group. (E, F) Representative western blot bands and quantification of p‐PKCα and NOX4 in the spinal cords of animals from different groups were presented. The phosphorylation levels of PKCα were normalized to the total protein levels. **p < 0.01, ***p < 0.001 compared with Vehicle‐treated rats, ## p < 0.01 compared with PMA‐treated rats, n = 4–6 in each group.
FIGURE 8
FIGURE 8
VitD3 preserved spinal GABAergic interneurons via suppression of PKCα/NOX4 signaling pathway‐mediated ferroptosis and mitochondrial dysfunction. (A) The levels of Fe2+, ROS, MDA, GSH, and SOD in the spinal cord in different groups were assessed (n = 4–6 per group). **p < 0.01, ***p < 0.001, ****p < 0.0001 compared with Vehicle‐treated rats, # p < 0.05, ## p < 0.01, ### p < 0.001 compared with PMA‐treated rats. (B, C) Representative western blot bands and quantification of SLC7A11 and GPX4 in the spinal cords of different groups were presented (n = 6 per group). ***p < 0.001, ****p < 0.0001 compared with Vehicle‐treated rats, ## p < 0.01, #### p < 0.0001 compared with PMA‐treated rats. (D, E) Representative western blot bands and quantification of GAD65 in the spinal cords of different groups were presented (n = 6 per group). ****p < 0.0001 compared with Vehicle‐treated rats, #### p < 0.0001 compared with PMA‐treated rats. (F) The levels of ATP in spinal cord were measured (n = 5 per group). ***p < 0.001 compared with Vehicle‐treated rats, # p < 0.05 compared with PMA‐treated rats. (G, H) Representative western blot bands of mitochondrial ETC Complex III‐V (UQCRC2, MTCO1, and ATP5F1A) in the spinal cord of different groups were presented. ***p < 0.001, ****p < 0.0001 compared with Vehicle‐treated rats, ## p < 0.01, #### p < 0.0001 compared with PMA‐treated rats, n = 5–6 in each group. (I) Representative morphological changes in the mitochondrial in the spinal cord (n = 3 per group). The labeled yellow boxes highlight the mitochondrial ultrastructure. scale bar: 1 μm and 500 nm.
FIGURE 9
FIGURE 9
Schematic diagram of the analgesic mechanism of vitamin D3 in neuropathic pain.

Similar articles

Cited by

References

    1. Colloca L., Ludman T., Bouhassira D., et al., “Neuropathic Pain,” Nature Reviews Disease Primers 3 (2017): 17002. - PMC - PubMed
    1. Obara I., Telezhkin V., Alrashdi I., and Chazot P. L., “Histamine, Histamine Receptors, and Neuropathic Pain Relief,” British Journal of Pharmacology 177, no. 3 (2020): 580–599. - PMC - PubMed
    1. Cavalli E., Mammana S., Nicoletti F., Bramanti P., and Mazzon E., “The Neuropathic Pain: An Overview of the Current Treatment and Future Therapeutic Approaches,” International Journal of Immunopathology and Pharmacology 33 (2019): 2058738419838383. - PMC - PubMed
    1. Li C., Lei Y., Tian Y., et al., “The Etiological Contribution of GABAergic Plasticity to the Pathogenesis of Neuropathic Pain,” Molecular Pain 15 (2019): 1744806919847366. - PMC - PubMed
    1. Meisner J. G., Marsh A. D., and Marsh D. R., “Loss of GABAergic Interneurons in Laminae I–III of the Spinal Cord Dorsal Horn Contributes to Reduced GABAergic Tone and Neuropathic Pain After Spinal Cord Injury,” Journal of Neurotrauma 27, no. 4 (2010): 729–737. - PubMed

Publication types

MeSH terms

LinkOut - more resources