. 2024 Sep 19;17(10):100964.
doi: 10.1016/j.waojou.2024.100964. eCollection 2024 Oct.

Integrated machine learning and bioinformatic analysis of mitochondrial-related signature in chronic rhinosinusitis with nasal polyps

Affiliations

Integrated machine learning and bioinformatic analysis of mitochondrial-related signature in chronic rhinosinusitis with nasal polyps

Bo Yang et al. World Allergy Organ J. .

Abstract

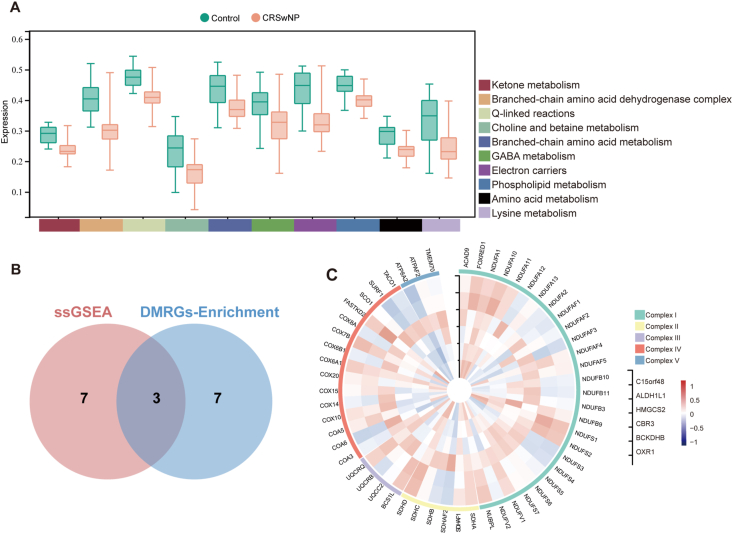
Background: Chronic rhinosinusitis with nasal polyps (CRSwNP) is a prevalent inflammatory disorder affecting the upper respiratory tract. Recent studies have indicated an association between CRSwNP and mitochondrial metabolic disorder characterized by impaired metabolic pathways; however, the precise mechanisms remain unclear. This study aims to investigate the mitochondrial-related signature in individuals diagnosed with CRSwNP.

Methods: Through the integration of differentially expressed genes (DEGs) with the mitochondrial gene set, differentially expressed mitochondrial-related genes (DEMRGs) were identified. Subsequently, the hub DEMRGs were selected using 4 integrated machine learning algorithms. Immune and mitochondrial characteristics were estimated based on CIBERSORT and ssGSEA algorithms. Bioinformatic findings were confirmed through RT-qPCR, immunohistochemistry, and ELISA for nasal tissues, as well as Western blotting analysis for human nasal epithelial cells (hNECs). The relationship between hub DEMRGs and disease severity was assessed using Spearman correlation analysis.

Results: A total of 24 DEMRGs were screened, most of which exhibited lower expression levels in CRSwNP samples. Five hub DEMRGs (ALDH1L1, BCKDHB, CBR3, HMGCS2, and OXR1) were consistently downregulated in both the discovery and validation cohorts. The hub genes showed a high diagnostic performance and were positively correlated with the infiltration of M2 macrophages and resting mast cells. Experimental results confirmed that the 5 genes were downregulated at both the mRNA and protein levels within nasal polyp tissues. Finally, a significant and inverse relationship was identified between the expression levels of these genes and both the Lund-Mackay and Lund-Kennedy scores.

Conclusion: Our findings systematically unraveled 5 hub markers correlated with mitochondrial metabolism and immune cell infiltration in CRSwNP, suggesting their potential to be based to design diagnostic and therapeutic strategies for the disease.

Keywords: Computational biology; Machine learning; Mitochondria; Nasal polyps; Rhinosinusitis.


Conflict of interest statement

The authors declare that they conducted the research without any potential conflict of interest arising from commercial or financial relationships.

Figures

Fig. 1
Fig. 1
The flowchart illustrating the investigative procedure. CON, control; CRSwNP, chronic rhinosinusitis with nasal polyps.
Fig. 2
Fig. 2
Identification of the differentially expressed mitochondrial-related genes (DEMRGs) between CRSwNP and control groups. (A) PCA revealing a batch effect between the integrated datasets both before and after de-batching. (B) The volcano plot of the differentially expressed genes (DEGs). (C) The Venn diagram showing intersection genes between DEGs and Mitochondrial-related genes from MitoCarta3.0. (D) Clustered heatmap of DEMRGs. (E) GO and KEGG pathway enrichment analyses of DEMRGs. (F) MitoPathway enrichment analysis of DEMRGs.
Fig. 3
Fig. 3
Detection of hub DEMRGs utilizing a comprehensive methodology. (A, B) Implementation of the LASSO regression. (C) Tenfold cross-validation error estimated using SVM-RFE. (D) The importance of features according to GBM algorithm. (E) Biomarker screening using the RF algorithm. (F) Venn diagram illustrating the intersection among the 4 above-mentioned machine learning outputs. (G) The expression of hub DEMRGs in CRSwNP and control samples. (H) The ROC curve of the diagnostic efficacy of the hub DEMRGs. (I) A nomogram model based on the 6 diagnostic biomarkers. (J) The calibration curve of the nomogram assessing the prognostic accuracy of the model. P < 0.05; ∗∗P < 0.01; ∗∗∗P < 0.001; ∗∗∗∗P < 0.0001; ns, not significant.
Fig. 4
Fig. 4
Target gene-miRNA and target gene-transcription factor (TF) networks are depicted in the diagram. Genes are represented by purple circled nodes, miRNAs by blue triangle nodes, and TFs by green diamond nodes.
Fig. 5
Fig. 5
Comparison of immune cell infiltration between CRSwNP and control groups. (A) The stacked bar chart illustrating the distribution of immune cell types. (B) The box plot depicting the contrasting distribution of 22 distinct types of immune cells between the CRSwNP and control groups. (C) The heatmap displaying the correlation patterns among the 22 types of infiltrating immune cells. (D) The correlation map showing the connection between differentially infiltrating immune cells and hub DEMRGs. P < 0.05; ∗∗P < 0.01; ∗∗∗P < 0.001; ∗∗∗∗P < 0.0001; ns, not significant.
Fig. 6
Fig. 6
MitoPathway-related characteristics in CRSwNP. (A) Distinct ssGSEA scores of the top 10 MitoPathways between CRSwNP and control samples. (B) Hub MitoPathways by intersecting the top 10 MitoPathways with the DEMRGs enrichment results. (C) Correlation between hub DEMRGs and respiratory chain complex (I–V) genes.
Fig. 7
Fig. 7
The expression of biomarkers between CRSwNP and control groups in validation datasets. (A) The expression of hub DEMRGs in GSE23552. (B) The expression of hub MitoPathways in GSE23552. (C) The UMAP map showing annotation results of cell subgroups in the scRNAseq data. (D) The distribution of hub DEMRGs in 6 cell subgroups. (E, F) The mean expression of hub DEMRGs in epithelial cells for each individual sample. P < 0.05; ∗∗P < 0.01; ∗∗∗P < 0.001; ∗∗∗∗P < 0.0001; ns, not significant.
Fig. 8
Fig. 8
Confirmation of ALDH1L1, BCKDHB, CBR3, HMGCS2, and OXR1 expression and their association with the severity of CRSwNP. (A) mRNA expression of hub DEMRGs in CRSwNP and control samples. (B) Correlations between the ΔCt in PCR of hub DEMRGs and the severity of CRSwNP, including Lund-Mackey score and Lund-Kennedy score. (C, D) Immunostaining of protein expression. Scale bars = 200 μm. (E, F) Representative expression levels of hub DEMRGs in Western blotting. (G) BCAA concentrations in nasal mucosa from CRSwNP and control groups. ΔCt = Ct (DEMRGs) – Ct (B2M); P < 0.05; ∗∗P < 0.01; ∗∗∗P < 0.001; ∗∗∗∗P < 0.0001; ns, not significant.

Similar articles

Cited by

References

    1. Kato A., Schleimer R.P., Bleier B.S. Mechanisms and pathogenesis of chronic rhinosinusitis. J Allergy Clin Immunol. 2022;149(5):1491–1503. - PMC - PubMed
    1. Fokkens W.J., Lund V., Bachert C., et al. EUFOREA consensus on biologics for CRSwNP with or without asthma. Allergy. 2019;74(12):2312–2319. - PMC - PubMed
    1. Prakash Y.S., Pabelick C.M., Sieck G.C. Mitochondrial dysfunction in airway disease. Chest. 2017;152(3):618–626. - PMC - PubMed
    1. Chellappan D.K., Paudel K.R., Tan N.W., et al. Targeting the mitochondria in chronic respiratory diseases. Mitochondrion. 2022;67:15–37. - PubMed
    1. Yoon Y.H., Yeon S.H., Choi M.R., et al. Altered mitochondrial functions and morphologies in epithelial cells are associated with pathogenesis of chronic rhinosinusitis with nasal polyps. Allergy Asthma Immunol Res. 2020;12(4):653–668. - PMC - PubMed

LinkOut - more resources