. 2024 Sep 12:16:1412735.
doi: 10.3389/fnagi.2024.1412735. eCollection 2024.

Association of white matter hyperintensities with cognitive decline and neurodegeneration

Affiliations

Association of white matter hyperintensities with cognitive decline and neurodegeneration

Tao-Ran Li et al. Front Aging Neurosci. .

Abstract

Background: The relationship between white matter hyperintensities (WMH) and the core features of Alzheimer's disease (AD) remains controversial. Further, due to the prevalence of co-pathologies, the precise role of WMH in cognition and neurodegeneration also remains uncertain.

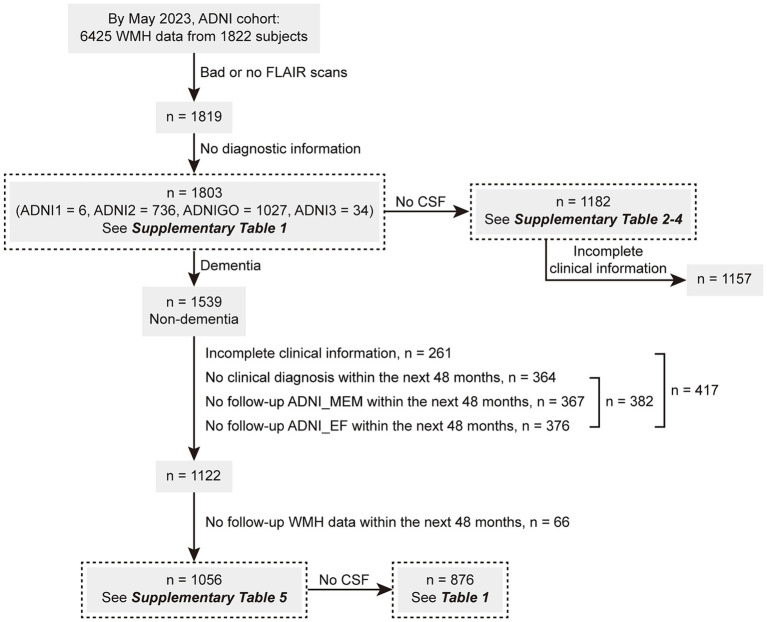
Methods: Herein, we analyzed 1803 participants with available WMH volume data, extracted from the ADNI database, including 756 cognitively normal controls, 783 patients with mild cognitive impairment (MCI), and 264 patients with dementia. Participants were grouped according to cerebrospinal fluid (CSF) pathology (A/T profile) severity. Linear regression analysis was applied to evaluate the factors associated with WMH volume. Modeled by linear mixed-effects, the increase rates (Δ) of the WMH volume, cognition, and typical neurodegenerative markers were assessed. The predictive effectiveness of WMH volume was subsequently tested using Cox regression analysis, and the relationship between WMH/ΔWMH and other indicators such as cognition was explored through linear regression analyses. Furthermore, we explored the interrelationship among amyloid-β deposition, cognition, and WMH using mediation analysis.

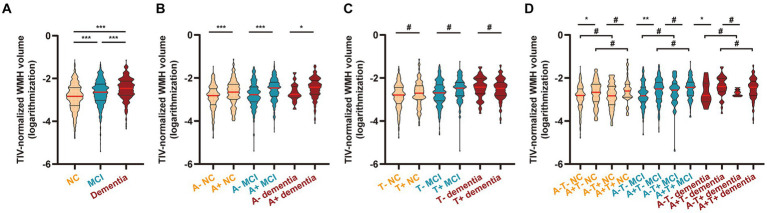
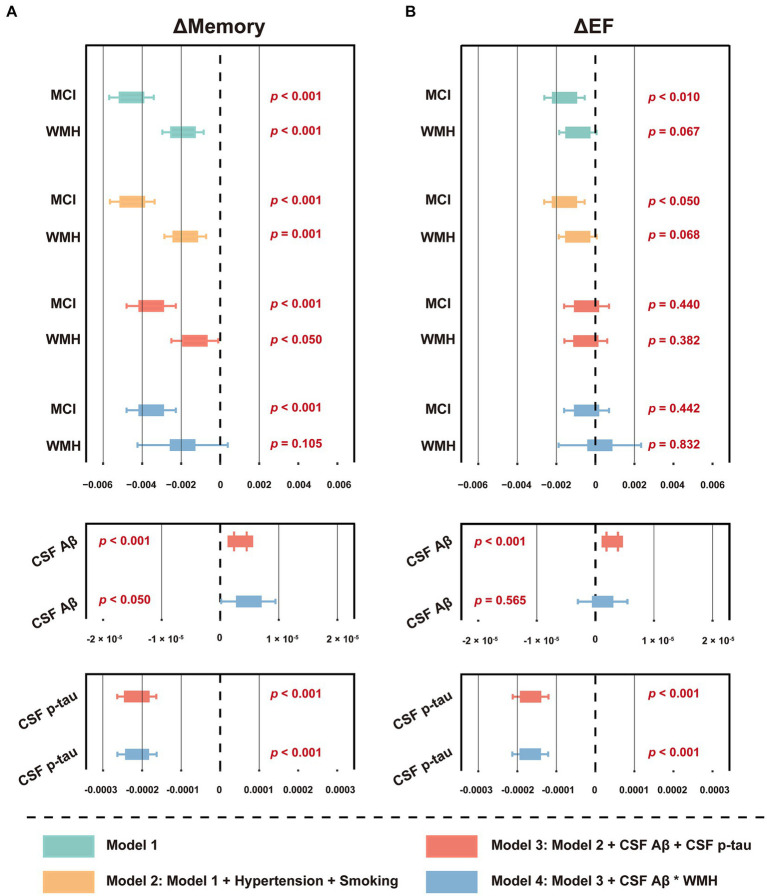
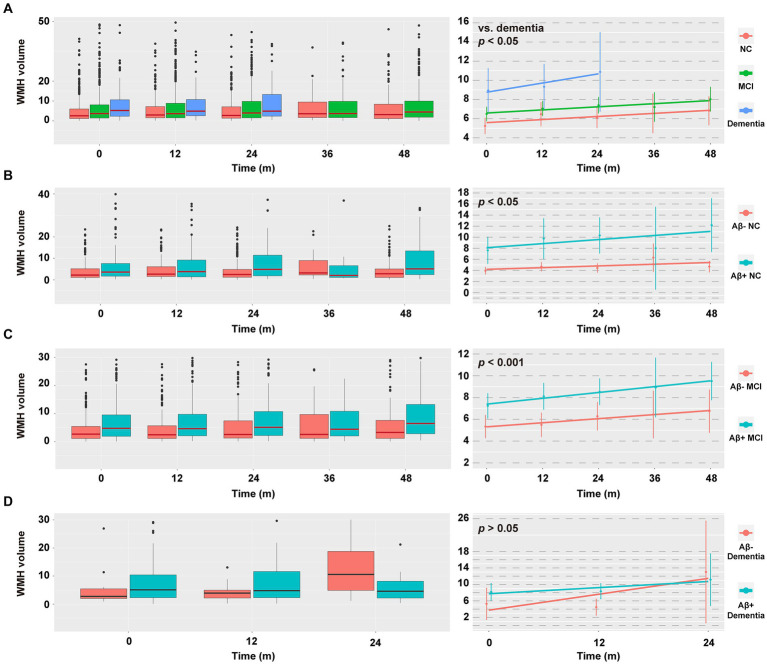
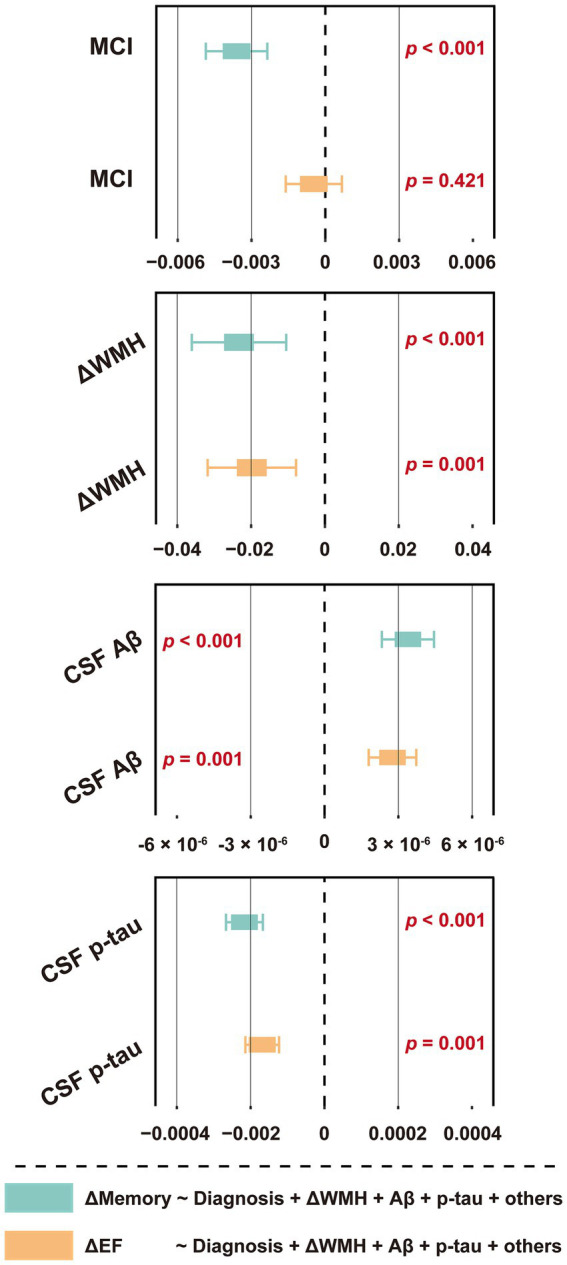
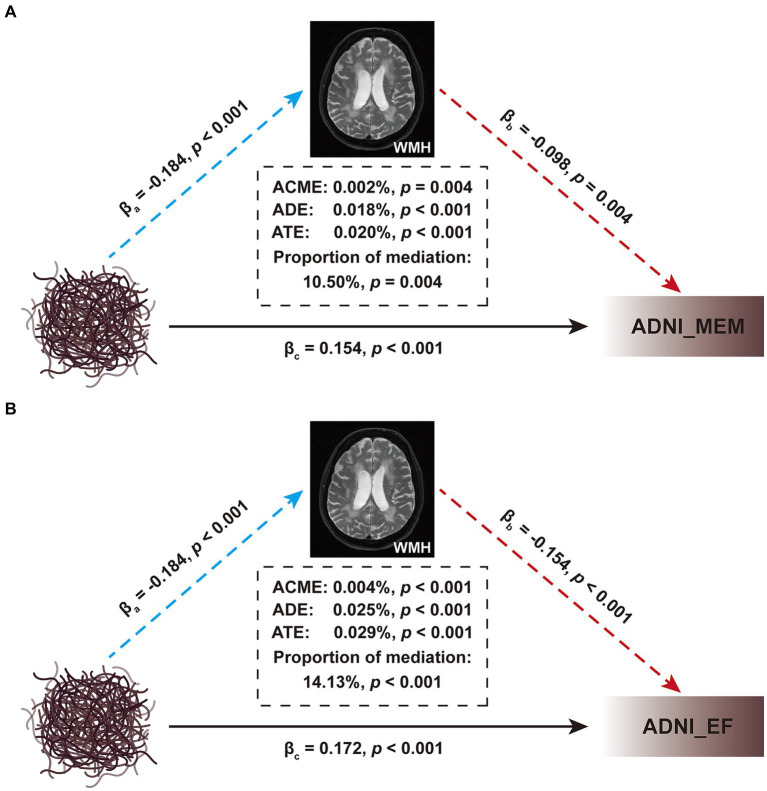
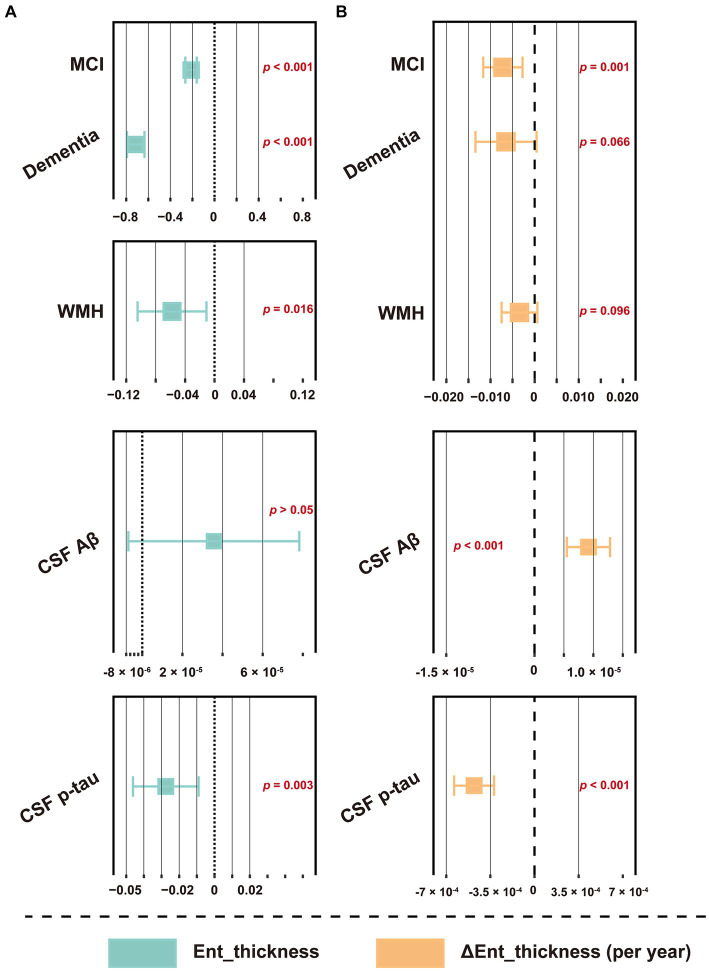
Results: Higher WMH volume was associated with older age, lower CSF amyloid-β levels, hypertension, and smoking history (all p ≤ 0.001), as well as cognitive status (MCI, p < 0.001; dementia, p = 0.008), but not with CSF tau levels. These results were further verified in any clinical stage, except hypertension and smoking history in the dementia stage. Although WMH could not predict dementia conversion, its increased levels at baseline were associated with a worse cognitive performance and a more rapid memory decline. Longitudinal analyses showed that baseline dementia and positive amyloid-β status were associated with a greater accrual of WMH volume, and a higher ΔWMH was also correlated with a faster cognitive decline. In contrast, except entorhinal cortex thickness, the WMH volume was not found to be associated with any other neurodegenerative markers. To a lesser extent, WMH mediates the relationship between amyloid-β and cognition.

Conclusion: WMH are non-specific lesions that are associated with amyloid-β deposition, cognitive status, and a variety of vascular risk factors. Despite evidence indicating only a weak relationship with neurodegeneration, early intervention to reduce WMH lesions remains a high priority for preserving cognitive function in the elderly.

Keywords: Alzheimer’s disease; Aβ; WMH; cerebral small vessel disease; cognition; neurodegeneration.


Conflict of interest statement

The authors declare that the research was conducted in the absence of any commercial or financial relationships that could be construed as a potential conflict of interest.

Figures

Figure 1
Figure 1
The screening flowchart of participants in this study. ADNI, Alzheimer’s Disease Neuroimaging Initiative; CSF, cerebrospinal fluid; MEM, memory sub-domain; EF, executive function sub-domain; WMH, white matter hyperintensity.
Figure 2
Figure 2
WMH volume in different diagnostic groups. (A) Participants were grouped by clinical diagnosis (n = 1803; see Supplementary Table S1). (B) Participants were grouped by clinical diagnosis and CSF-determined Aβ status (n = 1,182; see Supplementary Table S2). (C) Participants were grouped by clinical diagnosis and CSF-determined p-tau status (n = 1,182; see Supplementary Table S3). (D) Participants were grouped by clinical diagnosis and CSF-determined Aβ and p-tau statuses (n = 1,182; see Supplementary Table S4). According to a previous standard, we set the cutoff value at 977 pg./mL for Aβ and 27 pg./mL for p-tau to select participants with Aβ deposition (< 977 pg./mL; A+) and fibrillar tau (> 27 pg./mL; T+). The WMH volume was total intracranial volume-normalized and log-transformed (Supplementary Figure S2 shows the distribution of original WMH values and log-transformed WMH values). The results are presented in improved box charts; the red lines indicate the median values; the upper straight lines indicate the upper quartiles and the lower straight lines indicate the lower quartiles. Statistical analysis was conducted using one-way ANOVA followed by Tukey’s test (adjusted p value). Comparisons among groups: *, < 0.05; **, < 0.01; ***, < 0.001; #, > 0.05. WMH, white matter hyperintensity; NC, cognitively normal control; MCI, mild cognitive impairment; CSF, cerebrospinal fluid; Aβ, β-amyloid; p-tau, phosphorylated tau; ANOVA, analysis of variance.
Figure 3
Figure 3
Forest plot of the association between baseline WMH volume and cognitive function slopes. (A) The association between baseline WMH volume and ΔMemory. (B) The association between baseline WMH volume and ΔEF. The cognitive function slopes were calculated by using linear mixed-effects models among non-dementia participants with at least one follow-up ADNI_MEM/EF score within the next 48 months (n = 1,056, see Supplementary Table S5). In model 1, baseline WMH volume, plus age, sex, education, APOE ε4 status, and cognitive status were used as predictors of cognitive function slopes. In model 2, hypertension and smoking status were used as additional predictors on the basis of model 1. In model 3, CSF core biomarkers, including Aβ42 and p-tau levels, were used as additional predictors on the basis of model 2. In model 4, the interaction term of CSF Aβ42 and WMH were used as additional predictors on the basis of model 3. The WMH volume was total intracranial volume-normalized and log-transformed. CSF t-tau was not included due to its extremely high correlation with p-tau (R > 0.900, p < 0.001). For effect estimates with exact 95% CI and statistical significance values, see Supplementary Table S9. MCI, mild cognitive impairment; WMH, white matter hyperintensity; CSF, cerebrospinal fluid; Aβ, β-amyloid; p-tau, phosphorylated tau; t-tau, total tau; APOE, apolipoprotein E; MEM, memory sub-domain; EF, executive function; ADNI, Alzheimer’s Disease Neuroimaging Initiative; CI, confidence interval.
Figure 4
Figure 4
Data distribution and change in WMH volume within the next 48 months. (A–D) Data distribution of WMH volume (left column) and estimated means of WMH volume (right column) in different diagnostic groups. Raw values above 50/40/30/30 cm3 were discarded in A/B/C/D (left column) for the sake of aesthetics, with n = 24/15/55/13, respectively. Due to limited numbers, the follow-up WMH values cannot be predicted in the dementia group at the 36th and 48th month. The horizontal line in the middle of each box (left column) indicates the median, the top and bottom borders of the box mark the 75th and 25th percentiles. The modeled data (right column) show the mean 95% CIs for the predicted values using a linear mixed-effects model adjusted for age, sex, educational level, APOE ε4 status, total intracranial volume, and baseline WMH volume. p values indicate the group × time interaction effect. For effect estimates and statistical significance values, see Supplementary Tables S10, S11. NC, cognitively normal control; MCI, mild cognitive impairment; WMH, white matter hyperintensity; CSF, cerebrospinal fluid; Aβ, β-amyloid; APOE, apolipoprotein E.
Figure 5
Figure 5
Forest plot of the association between ΔWMH volume and cognitive function slopes. The slopes (ΔWMH, ΔMemory and ΔEF) were calculated by using linear mixed-effects models among non-dementia participants with at least one follow-up WMH data, ADNI_MEM/EF score within the next 48 months (n = 1,056, see Supplementary Table S5). The ΔWMH volumes, plus diagnostic status, age, sex, education, APOE ε4 status, hypertension and smoking status, and CSF core biomarkers, including Aβ42 and p-tau levels were used as predictors of cognitive function slopes (n = 876, see Table 1). CSF t-tau was not included due to its extremely high correlation with p-tau (R > 0.900, p < 0.001). For effect estimates with exact 95% CI and statistical significance values, see Supplementary Table S12. MCI, mild cognitive impairment; WMH, white matter hyperintensity; CSF, cerebrospinal fluid; Aβ, β-amyloid; p-tau, phosphorylated tau; t-tau, total tau; APOE, apolipoprotein E; MEM, memory sub-domain; EF, executive function; ADNI, Alzheimer’s Disease Neuroimaging Initiative; CI, confidence interval.
Figure 6
Figure 6
Mediation analyses of brain Aβ deposition on cognitive function. (A) The interrelationship among Aβ deposition, ADNI_MEM, and WMH. (B) The interrelationship among Aβ deposition, ADNI_EF, and WMH. Baseline WMH volume was used as the mediating variable; age, sex, educational level, and APOE ε4 status, were used as the covariates; the CSF Aβ levels were used as independent variable, and the ADNI_MEM or ADNI_EF score was used as dependent variable. All paths are presented in standardized regression coefficients (β). The WMH volume was total intracranial volume-normalized and log-transformed. The analysis was performed in 876 participants in Table 1. WMH, white matter hyperintensity; CSF, cerebrospinal fluid; Aβ, β-amyloid; APOE, apolipoprotein E; MEM, memory sub-domain; EF, executive function; ADNI, Alzheimer’s Disease Neuroimaging Initiative; ACME, average causal mediation effect; ADE, average direct effect; ATE, average total effect.
Figure 7
Figure 7
Forest plot of the association between WMH volume and entorhinal cortex thickness. (A) The association between baseline WMH volume and entorhinal cortex thickness. (B) The association between baseline WMH volume and the changes slope of entorhinal cortex thickness. Baseline WMH volume, plus diagnostic status, age, sex, education, APOE ε4 status, hypertension and smoking status, and CSF core biomarkers, including Aβ42 and p-tau levels were used as predictors of cognitive function slopes. The WMH volume was total intracranial volume-normalized and log-transformed. CSF t-tau was not included due to its extremely high correlation with p-tau (R > 0.900, p < 0.001). For effect estimates with exact 95% CI and statistical significance values, see Supplementary Table S13. MCI, mild cognitive impairment; WMH, white matter hyperintensity; CSF, cerebrospinal fluid; Aβ, β-amyloid; p-tau, phosphorylated tau; t-tau, total tau; APOE, apolipoprotein E; MEM, memory sub-domain; EF, executive function; ADNI, Alzheimer’s Disease Neuroimaging Initiative; CI, confidence interval.

References

    1. Alban S. L., Lynch K. M., Ringman J. M., Toga A. W., Chui H. C., Sepehrband F., et al. (2023). The association between white matter Hyperintensities and amyloid and tau deposition. Neuroimage Clin. 38:103383. doi: 10.1016/J.Nicl.2023.103383, PMID: - DOI - PMC - PubMed
    1. Bernal J., Schreiber S., Menze I., Ostendorf A., Pfister M., Geisendörfer J., et al. (2023). Arterial hypertension and Β-amyloid accumulation have spatially overlapping effects on posterior white matter Hyperintensity volume: a cross-sectional study. Alzheimers Res. Ther. 15:97. doi: 10.1186/S13195-023-01243-4, PMID: - DOI - PMC - PubMed
    1. Bittner T., Zetterberg H., Teunissen C. E., Ostlund R. E., Jr., Militello M., Andreasson U., et al. (2016). Technical performance of a novel, fully automated Electrochemiluminescence immunoassay for the quantitation of Β-amyloid (1-42) in human cerebrospinal fluid. Alzheimers Dement. 12, 517–526. doi: 10.1016/J.Jalz.2015.09.009 - DOI - PubMed
    1. Bos I., Verhey F. R., Ramakers I., Jacobs H., Soininen H., Freund-Levi Y., et al. (2017). Cerebrovascular and amyloid pathology in Predementia stages: the relationship with neurodegeneration and cognitive decline. Alzheimers Res. Ther. 9:101. doi: 10.1186/S13195-017-0328-9, PMID: - DOI - PMC - PubMed
    1. Burt L. A., Billington E. O., Rose M. S., Raymond D. A., Hanley D. A., And Boyd S. K. (2019). Effect of high-dose vitamin D supplementation on volumetric bone density and bone strength: a randomized clinical trial. JAMA 322, 736–745. doi: 10.1001/Jama.2019.11889, PMID: - DOI - PMC - PubMed

LinkOut - more resources