. 2024 Sep 16;28(5):430.
doi: 10.3892/etm.2024.12719. eCollection 2024 Nov.

Gut microbiota of children with autism spectrum disorder and healthy siblings: A comparative study

Affiliations

Gut microbiota of children with autism spectrum disorder and healthy siblings: A comparative study

Dalia Abuljadayel et al. Exp Ther Med. .

Abstract

Autism spectrum disorder (ASD) is a neurodevelopmental abnormality that impairs social communication. The human gut microbiome (GM) influences a variety of local processes, including dysbiosis and the defense against pathogenic microorganisms. The aim of the present study was to categorize and identify molecular biomarkers for ASD. In the present study, metagenomics whole genome shotgun sequencing was used to identify the gut microbiota in autistic individuals. Fecal samples from four children with ASD and four healthy control siblings, aged 3-10 years old, were examined using bioinformatics analysis. A total of 673,091 genes were cataloged, encompassing 25 phyla and 2 kingdoms based on the taxonomy analysis. The results revealed 257 families, 34 classes, 84 orders, and 1,314 genera among 4,339 species. The top 10 most abundant genes and corresponding functional genes for each group were determined after the abundance profile was screened. The results showed that children with ASD had a higher abundance of certain gut microbiomes than their normal siblings and vice versa. The phyla Firmicutes and Proteobacteria were the most abundant in ASD. The Thermoanaerobacteria class was also restricted to younger healthy individuals. Moreover, the Lactobacillaceae family was more abundant in children with ASD. Additionally, it was discovered that children with ASD had a higher abundance of the Bacteroides genus and a lower abundance of the Bifidobacterium and Prevotella genera. In conclusion, there were more pathogenic genera and species and higher levels of biomass, diversity and richness in the GM of children with ASD.

Keywords: autism; autism spectrum disorder; dysbiosis; gut microbiome; gut-brain axis.


Conflict of interest statement

The authors declare that they have no competing interests.

Figures

Figure 1
Figure 1
Venn diagram showing the number of genes found in children with ASD and healthy control siblings in their fecal samples. The different colors in the Venn diagram represent different groups: blue, control; pink, children with ASD. The number of unique genes in each group and the number of common genes shared between the groups are shown. ASD, autism spectrum disorder.
Figure 2
Figure 2
Distribution of the length of the genes in nucleotides in the ASD and healthy control children. The horizontal axis represents the gene length interval, and the vertical axis represents the number of genes falling in this interval. ASD, autism spectrum disorder.
Figure 3
Figure 3
The relative microbial abundance of two kingdoms, bacteria and archaea, in the children with ASD and healthy control siblings. Children with ASD had a higher diversity of bacteria, but a lower abundance of archaea. ASD, autism spectrum disorder.
Figure 4
Figure 4
The relative microbial abundance of phyla across healthy controls (blue) and ASD samples (red). ASD, autism spectrum disorder.
Figure 5
Figure 5
The relative microbial abundance at the class level across healthy control (blue) and ASD samples (red). ASD, autism spectrum disorder.
Figure 6
Figure 6
The relative microbial abundance at the order level across healthy control (blue) and ASD samples (red). ASD, autism spectrum disorder.
Figure 7
Figure 7
The relative microbial abundance at the family level across healthy control (blue) and ASD samples (red). ASD, autism spectrum disorder.
Figure 8
Figure 8
The relative microbial abundance at the genus level across healthy control (blue) and ASD samples (red). ASD, autism spectrum disorder.
Figure 9
Figure 9
The relative microbial abundance at the species level across healthy control (blue) and ASD samples (red). ASD, autism spectrum disorder.
Figure 10
Figure 10
PCA based on the number of genes at the species level of metagenomes collected from Children with ASD and their healthy control siblings. A colored dot refers to a given sample in one group and similar colored dots refer to the same group. The x-axis is the first principal component, and the y-axis is the second principal component for the analysis. The number in the brackets represents the contribution of the PCA to differences among samples. PCA, principal component analysis; ASD, autism spectrum disorder.
Figure 11
Figure 11
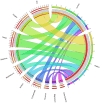
Circus plot showing the results of the correlation between mineral concentration and gene abundance, affecting the way these minerals work on the relative percentage scale. The different colors of the inner circle indicate different samples/groups and functional classifications. The right side of the outer circle is the relative percentage of each functional category in both groups (control and ASD), and the left side of the outer circle is the relative percentage of a few minerals and dyes in each sample. ASD, autism spectrum disorder.

References

    1. Bölte S, Girdler S, Marschik PB. The contribution of environmental exposure to the etiology of autism spectrum disorder. Cell Mol Life Sci. 2019;76:1275–1297. doi: 10.1007/s00018-018-2988-4. - DOI - PMC - PubMed
    1. Kral TVE, Eriksen WT, Souders MC, Pinto-Martin JA. Eating behaviors, diet quality, and gastrointestinal symptoms in children with autism spectrum disorders: a brief review. J Pediatr Nurs. 2013;28:548–556. doi: 10.1016/j.pedn.2013.01.008. - DOI - PubMed
    1. Mukherjee SB. Autism spectrum disorders-diagnosis and management. Indian J Pediatr. 2017;84:307–314. doi: 10.1007/s12098-016-2272-2. - DOI - PubMed
    1. Heintz-Buschart A, Wilmes P. Human gut microbiome: Function matters. Trends Microbiol. 2018;26:563–574. doi: 10.1016/j.tim.2017.11.002. - DOI - PubMed
    1. Schären OP, Hapfelmeier S. Robust microbe immune recognition in the intestinal mucosa. Genes Immun. 2021;22:268–275. doi: 10.1038/s41435-021-00131-x. - DOI - PMC - PubMed

LinkOut - more resources