

Deciphering the role of tryptophan metabolism-associated genes ECHS1 and ALDH2 in gastric cancer: implications for tumor immunity and personalized therapy
- PMID: 39328412
- PMCID: PMC11424447
- DOI: 10.3389/fimmu.2024.1460308
Deciphering the role of tryptophan metabolism-associated genes ECHS1 and ALDH2 in gastric cancer: implications for tumor immunity and personalized therapy
Abstract
Background: Tryptophan Metabolism-associated Genes (TMGs), such as ECHS1 and ALDH2, are crucial in cancer progression through immunosuppressive mechanisms, particularly in Gastric Cancer (GC). This study explores their effects on the Tumor Microenvironment (TME). Additionally, it examines their potential as novel immunotherapy targets.
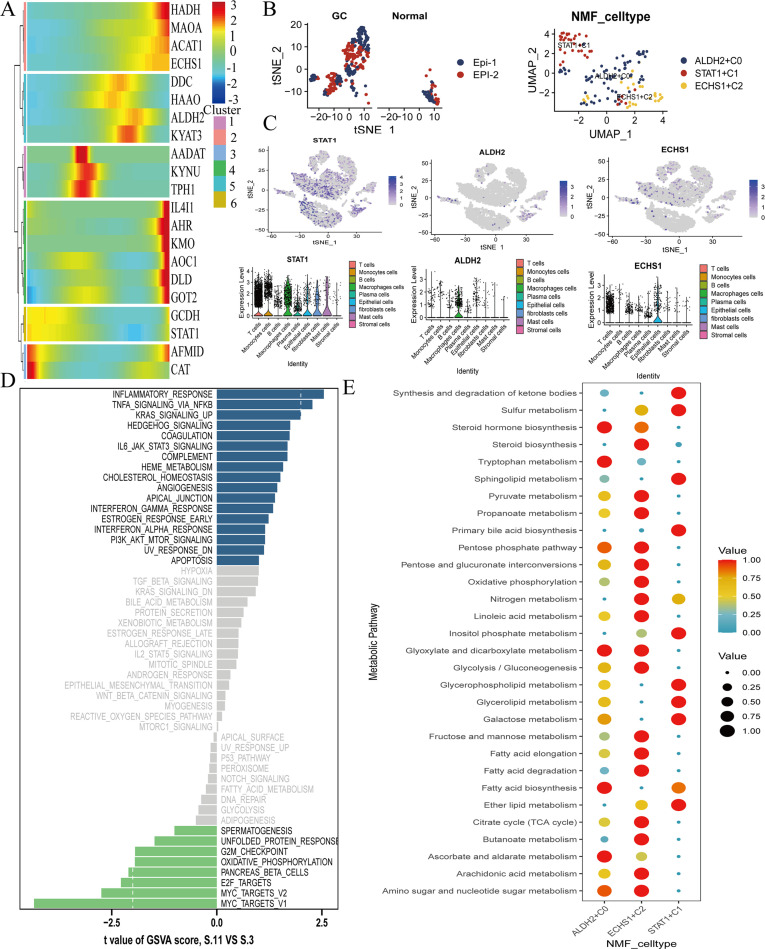
Methods: We utilized single-cell and bulk transcriptomic technologies to analyze the heterogeneity of GC. Non-negative Matrix Factorization (NMF) clustering identified key TMGs, and extensive RNA-seq analyses were performed to pinpoint prognostic genes and potential immunotherapy targets. Furthermore, through PCR analyses we found that ECHS1 and ALDH2 gene expression plays a regulatory role in the migration, invasion and inflammatory factor in AGS and SNU-1 cell lines. The interference effect of si-ECHS1 and ad-ALDH2 was validated using cell scratch assay in AGS and SNU-1 cell line.
Results: We observed a statistically significant correlation between ECHS1 and ALDH2 expression and increased TME heterogeneity. Our findings also revealed that ECHS1 down-regulation and ALDH2 up-regulation contribute to reduced TME heterogeneity, decreased inflammation, and inhibited AGS and SNU-1 tumor cells migration and proliferation. GSVA enrichment analysis highlighted the NF-kappa B(NF-κB) signaling pathway as specifically regulated by TMGs. Furthermore,ECHS1 and ALDH2 modulated CD8+ and CD4+ T cell activities, impacting GC progression. In vitro experiments further solidified our conclusions by showcasing the inhibitory effects of Si-ECHS1 and ad-ALDH2 on the invasive and proliferative capabilities of AGS and SNU-1 cells. Moreover, Si-ECHS1 and ad-ALDH2 gene expression effectively reduced the expression of inflammatory factors IL-10,IL-7,CXCL8 and IL-6, leading to a remarkable alleviation of chronic inflammation and the heterogeneous nature of the TME.
Conclusion: This research highlights the importance of ECHS1 and ALDH2 in GC progression and immune modulation, suggesting that targeted therapies focusing on these genes offer promising avenues for personalized immunotherapy in GC. These findings hold potential for improving patient survival and quality of life. Future studies on the NF-κB signaling pathway's role in this context are warranted to further elucidate the mechanisms underlying TMG-mediated immune modulation in GC.
Keywords: ALDH2; ECHS1; gastric cancer (GC); tryptophan metabolism-associated genes (TMGs); tumor microenvironment (TME).
Copyright © 2024 Wang, Zhou, Yan, Miao, Wang, Gu, Fan, Xu, Huang and Liu.
Conflict of interest statement
The authors declare that the research was conducted in the absence of any commercial or financial relationships that could be construed as a potential conflict of interest.
Figures


Similar articles
-
CXC chemokine receptor 4 - mediated immune modulation and tumor microenvironment heterogeneity in gastric cancer: Utilizing multi-omics approaches to identify potential therapeutic targets.Biofactors. 2025 Jan-Feb;51(1):e2130. doi: 10.1002/biof.2130. Epub 2024 Oct 21. Biofactors. 2025. PMID: 39431668
-
Single-cell analysis uncovers high-proliferative tumour cell subtypes and their interactions in the microenvironment of gastric cancer.J Cell Mol Med. 2024 Jun;28(12):e18373. doi: 10.1111/jcmm.18373. J Cell Mol Med. 2024. PMID: 38894657 Free PMC article.
-
Alda‑1 restores ALDH2‑mediated alcohol metabolism to inhibit the NF‑κB/VEGFC axis in head and neck cancer.Int J Mol Med. 2025 Apr;55(4):55. doi: 10.3892/ijmm.2025.5496. Epub 2025 Jan 31. Int J Mol Med. 2025. PMID: 39886980 Free PMC article.
-
Single-cell RNA sequencing to map tumor heterogeneity in gastric carcinogenesis paving roads to individualized therapy.Cancer Immunol Immunother. 2024 Sep 13;73(11):233. doi: 10.1007/s00262-024-03820-4. Cancer Immunol Immunother. 2024. PMID: 39271545 Free PMC article. Review.
-
NF-κB signaling pathway in tumor microenvironment.Front Immunol. 2024 Oct 18;15:1476030. doi: 10.3389/fimmu.2024.1476030. eCollection 2024. Front Immunol. 2024. PMID: 39493763 Free PMC article. Review.
Cited by
-
Global research trends in tryptophan metabolism and cancer: a bibliometric and visualization analysis (2005-2024).Front Oncol. 2025 Jul 1;15:1621666. doi: 10.3389/fonc.2025.1621666. eCollection 2025. Front Oncol. 2025. PMID: 40666095 Free PMC article.
-
ECHS1: pathogenic mechanisms, experimental models, and emerging therapeutic strategies.Orphanet J Rare Dis. 2025 Aug 13;20(1):430. doi: 10.1186/s13023-025-03959-y. Orphanet J Rare Dis. 2025. PMID: 40804397 Free PMC article. Review.
-
Advances in the immunological microenvironment and immunotherapy of bladder cancer.Front Immunol. 2025 Aug 19;16:1609871. doi: 10.3389/fimmu.2025.1609871. eCollection 2025. Front Immunol. 2025. PMID: 40904451 Free PMC article. Review.
-
Elucidating stearoyl metabolism and NCOA4-mediated ferroptosis in gastric cancer liver metastasis through multi-omics single-cell integrative mendelian analysis: advancing personalized immunotherapy strategies.Discov Oncol. 2025 Jan 15;16(1):46. doi: 10.1007/s12672-025-01769-z. Discov Oncol. 2025. PMID: 39812999 Free PMC article.
-
ATP6AP1 drives pyroptosis-mediated immune evasion in hepatocellular carcinoma: a machine learning-guided therapeutic target.Discov Oncol. 2025 Apr 25;16(1):616. doi: 10.1007/s12672-025-02426-1. Discov Oncol. 2025. PMID: 40281381 Free PMC article.
References
MeSH terms
Substances
LinkOut - more resources
Full Text Sources
Medical
Research Materials
Miscellaneous