

Patient-derived organoids and mini-PDX for predicting METN375S-mutated lung cancer patient clinical therapeutic response
- PMID: 39328538
- PMCID: PMC11425092
- DOI: 10.1016/j.heliyon.2024.e37884
Patient-derived organoids and mini-PDX for predicting METN375S-mutated lung cancer patient clinical therapeutic response
Abstract
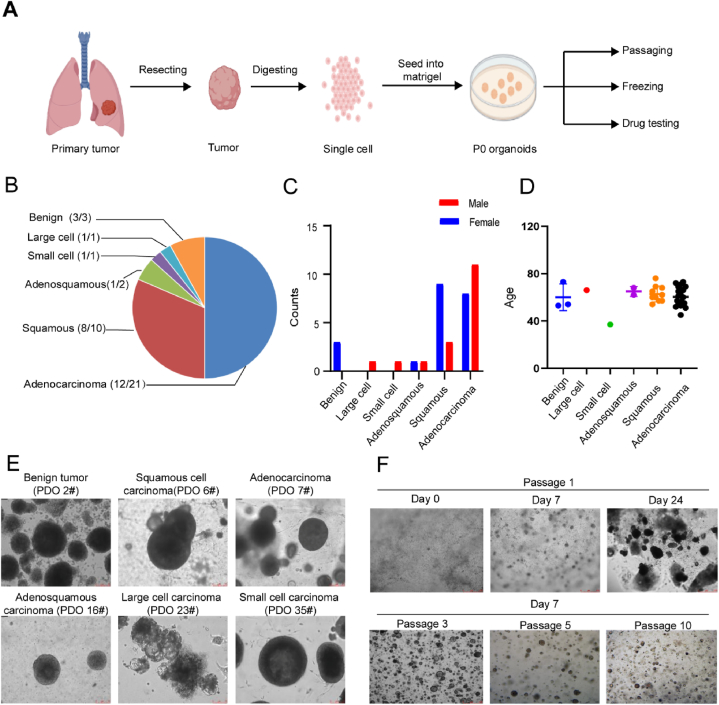
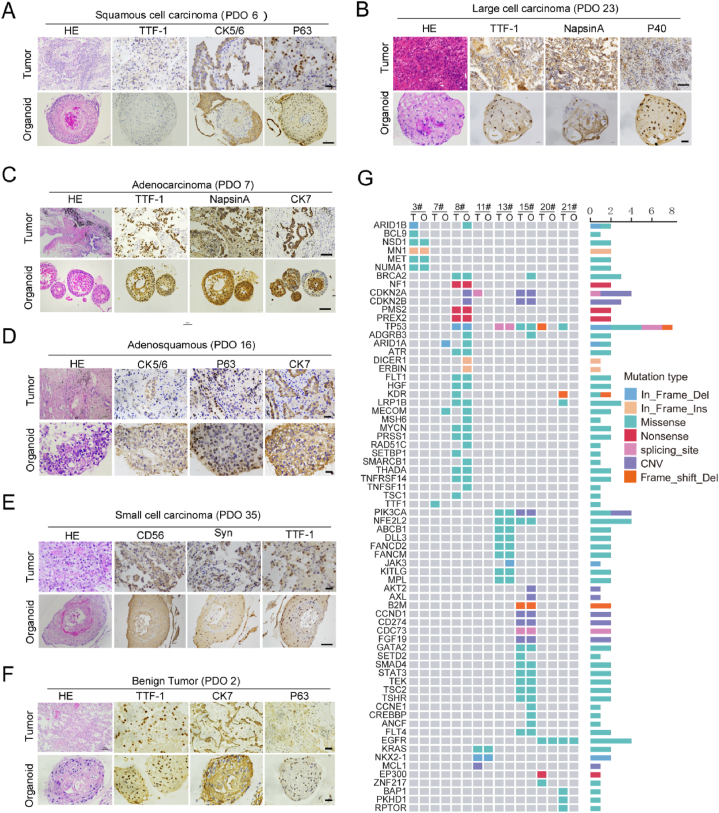
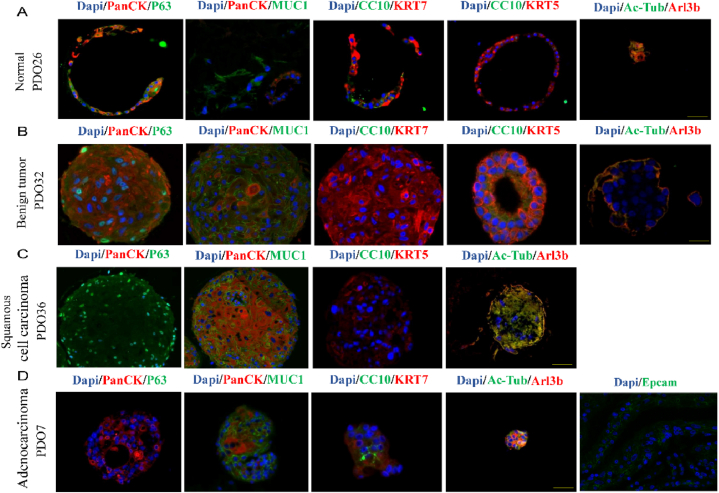
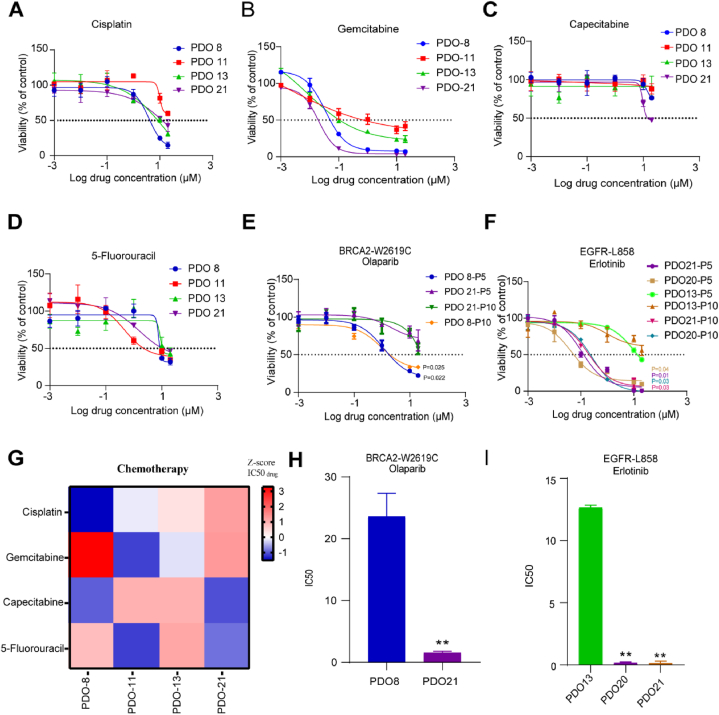
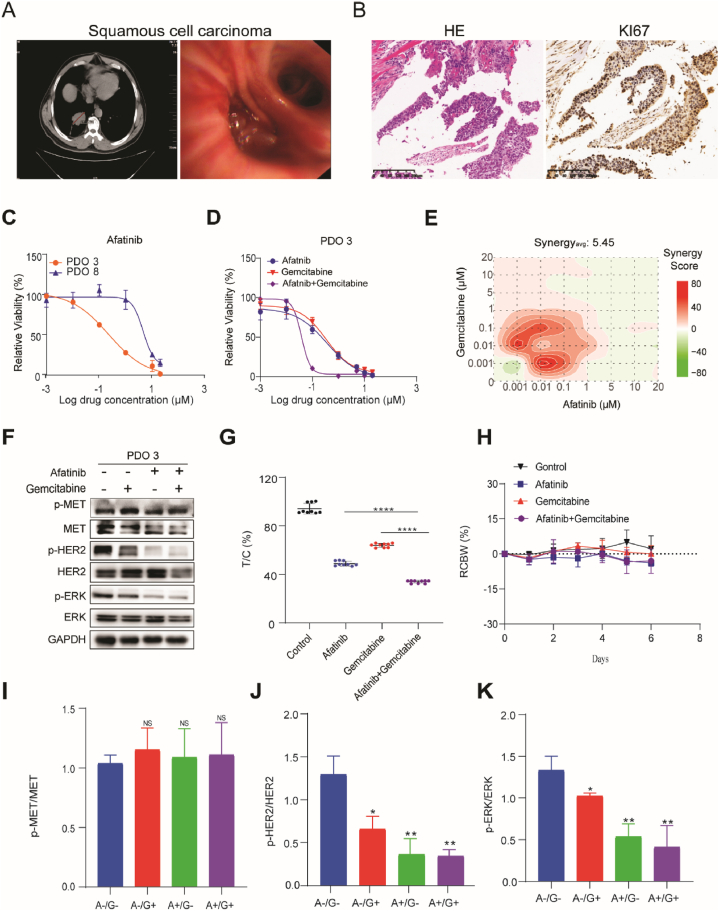
Lung cancer as a molecularly and histologically high heterogonous disease, there is an urgent need to predict lung cancer patients' responses to anti-cancer treatment, and patient-derived organoids (PDOs) have been recognized as a valuable platform for preclinical drug screening. In this study, we successfully established 26 PDO lines from various subtypes of lung cancers including benign tumor, adenocarcinoma, squamous cell carcinoma, adenosquamous carcinoma, large-cell carcinoma, and small-cell carcinoma. These PDOs were shown to retain the major genomic and histological characteristics of primary tumors and remain stable during long-term culture. With the help of targeted genomic sequencing, we found that lung cancer that harbors METN375S mutation is selectively sensitive to afatinib, and a combination of afatinib and gemcitabine induced synthetic lethality in PDO and mini-PDX models. In summary, our findings demonstrate the potential of PDO in predicting lung cancer drug response, and reveal a promising strategy for METN375S mutant lung cancer treatment.
© 2024 The Authors.
Conflict of interest statement
We declare that we have no conflicts of interest.
Figures
Similar articles
-
Genomic characteristics and drug screening among organoids derived from non-small cell lung cancer patients.Thorac Cancer. 2020 Aug;11(8):2279-2290. doi: 10.1111/1759-7714.13542. Epub 2020 Jul 7. Thorac Cancer. 2020. PMID: 32633046 Free PMC article.
-
Modeling Clinical Responses to Targeted Therapies by Patient-Derived Organoids of Advanced Lung Adenocarcinoma.Clin Cancer Res. 2021 Aug 1;27(15):4397-4409. doi: 10.1158/1078-0432.CCR-20-5026. Epub 2021 Jun 3. Clin Cancer Res. 2021. PMID: 34083237 Free PMC article.
-
Patient-derived organoid culture of gastric cancer for disease modeling and drug sensitivity testing.Biomed Pharmacother. 2023 Jul;163:114751. doi: 10.1016/j.biopha.2023.114751. Epub 2023 Apr 26. Biomed Pharmacother. 2023. PMID: 37105073
-
Patient derived organoids in prostate cancer: improving therapeutic efficacy in precision medicine.Mol Cancer. 2021 Sep 29;20(1):125. doi: 10.1186/s12943-021-01426-3. Mol Cancer. 2021. PMID: 34587953 Free PMC article. Review.
-
Patient-derived functional organoids as a personalized approach for drug screening against hepatobiliary cancers.Adv Cancer Res. 2022;156:319-341. doi: 10.1016/bs.acr.2022.01.011. Epub 2022 Mar 16. Adv Cancer Res. 2022. PMID: 35961704 Review.
References
-
- Siegel R.L., et al. Cancer statistics. CA A Cancer J. Clin. 2021;71(1) 2021. - PubMed
-
- Leitao, et al. Pathobiology Journal of Immunopathology Molecular & Cellular Biology; 2018. Heterogeneity in Lung Cancer.
-
- Bedard P., et al. Small molecules, big impact: 20 years of targeted therapy in oncology. Lancet (London, England) 2020;395(10229):1078–1088. - PubMed
LinkOut - more resources
Full Text Sources
Miscellaneous
