

APC and ZBTB2 May Mediate M2 Macrophage Infiltration to Promote the Development of Renal Fibrosis: A Bioinformatics Analysis
- PMID: 39328595
- PMCID: PMC11424844
- DOI: 10.1155/2024/5674711
APC and ZBTB2 May Mediate M2 Macrophage Infiltration to Promote the Development of Renal Fibrosis: A Bioinformatics Analysis
Abstract
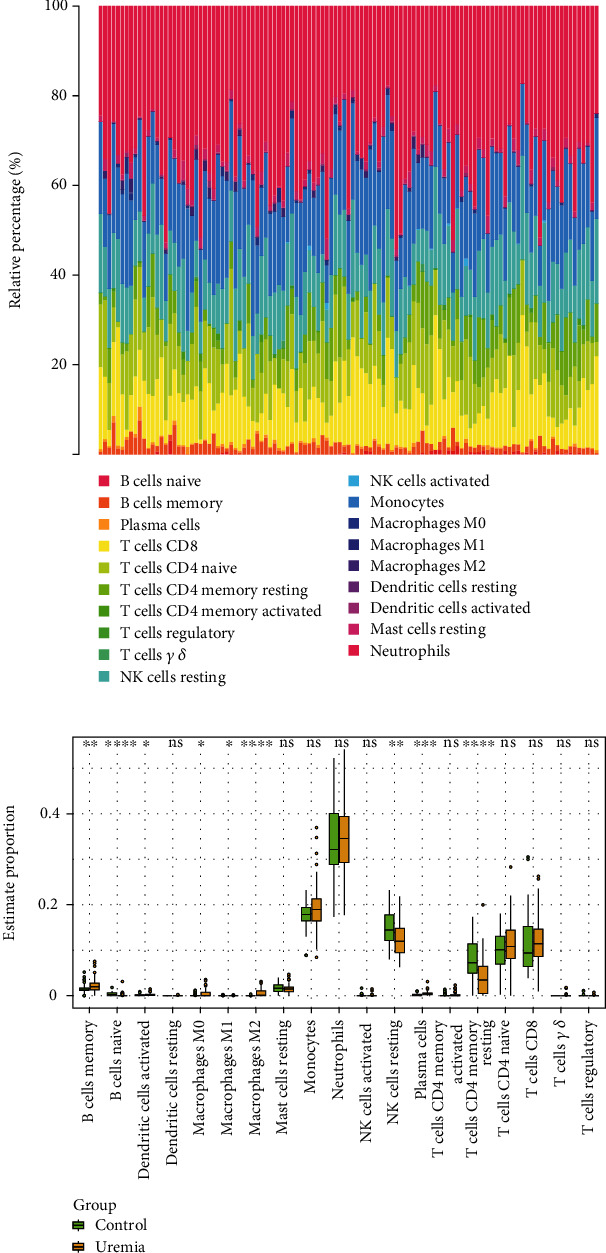
Background and Purpose: The continuous accumulation of M2 macrophages may potentially contribute to the development of kidney fibrosis in chronic kidney disease (CKD). The purpose of this study was to analyze the infiltration of M2 macrophages in uremic patients and to seek new strategies to slow down the progression of renal fibrosis. Methods: We conducted a comprehensive search for expression data pertaining to uremic samples within the Gene Expression Omnibus (GEO) database, encompassing the time frame from 2010 to 2022. Control and uremic differentially expressed genes (DEGs) were identified. Immune cell infiltration was investigated by CIBERSORT and modules associated with M2 macrophage infiltration were identified by weighted gene coexpression network analysis (WGCNA). Consistent genes were identified using the least absolute shrinkage and selection operator (LASSO) and selection and visualization of the most relevant features (SVM-RFE) methods to search for overlapping genes. Receiver operating characteristic (ROC) curves were examined for the diagnostic value of candidate genes. Quantitative real-time PCR (qPCR) examined the expression levels of candidate genes obtained from uremic patients in M2 macrophage. Results: A total of 1298 DEGs were identified within the GSE37171 dataset. Significant enrichment of DEGs was observed in 20 biological processes (BP), 19 cellular components (CC), 6 molecular functions (MF), and 70 Kyoto Encyclopedia of Genes and Genomes (KEGG) pathways. CIBERSORT analysis observed a significant increase in B-cell memory, dendritic cell activation, M0, M1, M2, and plasma cell numbers in uremic samples. We identified the 10 most interrelated genes. In particular, adenomatous polyposis coli (APC) and zinc finger and BTB structural domain 2 (ZBTB2) were adversely associated with the infiltration of M2 macrophages. Importantly, the expression levels of APC and ZBTB2 were far lower in M2 macrophages from uremic patients than those in healthy individuals. Conclusion: The development of renal fibrosis may be the result of M2 macrophage infiltration promoted by APC and ZBTB2.
Keywords: biomarker; chronic kidney disease; immune infiltration; renal fibrosis; uremia.
Copyright © 2024 Jianling Song et al.
Conflict of interest statement
The authors declare no conflicts of interest.
Figures


Similar articles
-
Exploration of the shared diagnostic genes and mechanisms between periodontitis and primary Sjögren's syndrome by integrated comprehensive bioinformatics analysis and machine learning.Int Immunopharmacol. 2024 Nov 15;141:112899. doi: 10.1016/j.intimp.2024.112899. Epub 2024 Aug 13. Int Immunopharmacol. 2024. PMID: 39142001
-
Identification of cancer stemness and M2 macrophage-associated biomarkers in lung adenocarcinoma.Heliyon. 2023 Aug 16;9(9):e19114. doi: 10.1016/j.heliyon.2023.e19114. eCollection 2023 Sep. Heliyon. 2023. PMID: 37662825 Free PMC article.
-
Identifying the hub gene and immune infiltration of Parkinson's disease using bioinformatical methods.Brain Res. 2022 Jun 15;1785:147879. doi: 10.1016/j.brainres.2022.147879. Epub 2022 Mar 10. Brain Res. 2022. PMID: 35278479
-
The role of macrophages in fibrosis of chronic kidney disease.Biomed Pharmacother. 2024 Aug;177:117079. doi: 10.1016/j.biopha.2024.117079. Epub 2024 Jul 4. Biomed Pharmacother. 2024. PMID: 38968801 Review.
-
Friend or foe? The role of SIRT6 on macrophage polarized to M2 subtype in acute kidney injury to chronic kidney disease.Ren Fail. 2025 Dec;47(1):2482121. doi: 10.1080/0886022X.2025.2482121. Epub 2025 Apr 22. Ren Fail. 2025. PMID: 40260529 Free PMC article. Review.
References
-
- Foreman K. J., Marquez N., Dolgert A., et al. Forecasting life expectancy, years of life lost, and all-cause and cause-specific mortality for 250 causes of death: reference and alternative scenarios for 2016-40 for 195 countries and territories. Lancet . 2018;392(10159):2052–2090. doi: 10.1016/S0140-6736(18)31694-5. - DOI - PMC - PubMed
-
- Ji X., Wang H., Wu Z., et al. Specific inhibitor of Smad3 (SIS3) attenuates fibrosis, apoptosis, and inflammation in unilateral ureteral obstruction kidneys by inhibition of transforming growth factor β (TGF-β)/Smad3 signaling. Medical Science Monitor . 2018;24:1633–1641. doi: 10.12659/MSM.909236. - DOI - PMC - PubMed
MeSH terms
Substances
LinkOut - more resources
Full Text Sources
Medical
