. 2024 Sep 12:15:1340509.
doi: 10.3389/fpls.2024.1340509. eCollection 2024.

Screening key sorghum germplasms for low-nitrogen tolerance at the seedling stage and identifying from the carbon and nitrogen metabolism

Affiliations

Screening key sorghum germplasms for low-nitrogen tolerance at the seedling stage and identifying from the carbon and nitrogen metabolism

Chunjuan Liu et al. Front Plant Sci. .

Abstract

Introduction: Sorghum (Sorghum bicolor L.) can withstand drought and heat stress and efficiently utilize water and nutrients. However, the underlying mechanism of its tolerance to low-nitrogen (N) stress remains poorly understood.

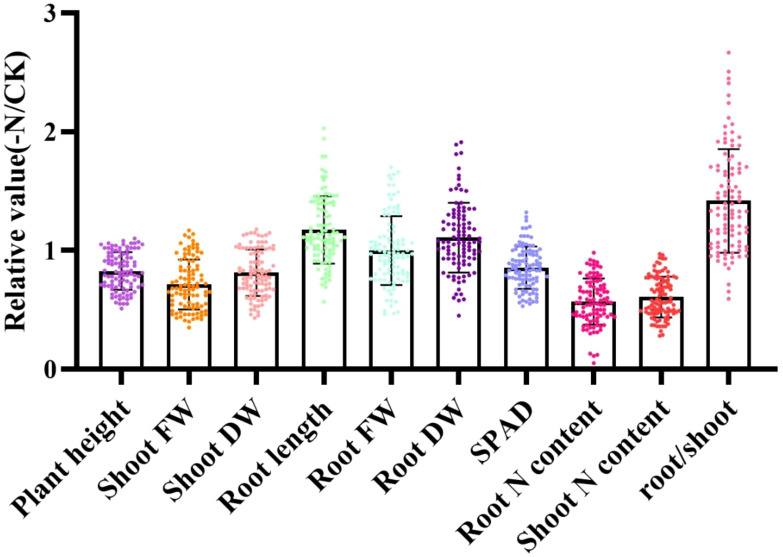
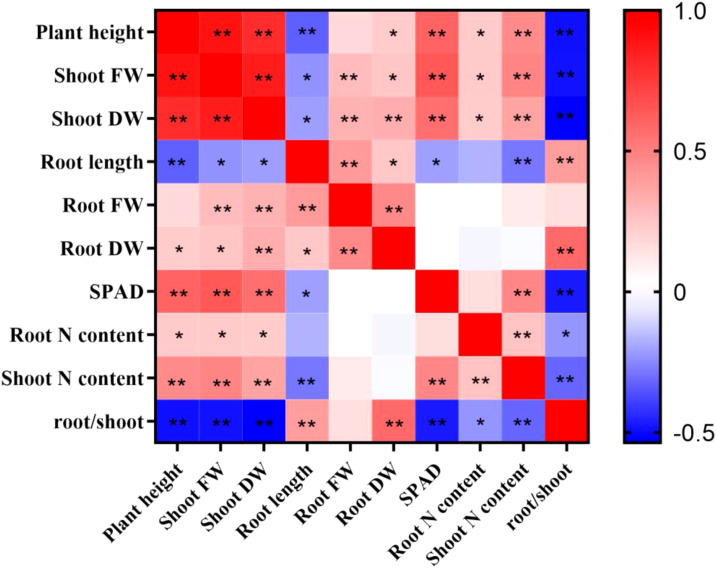
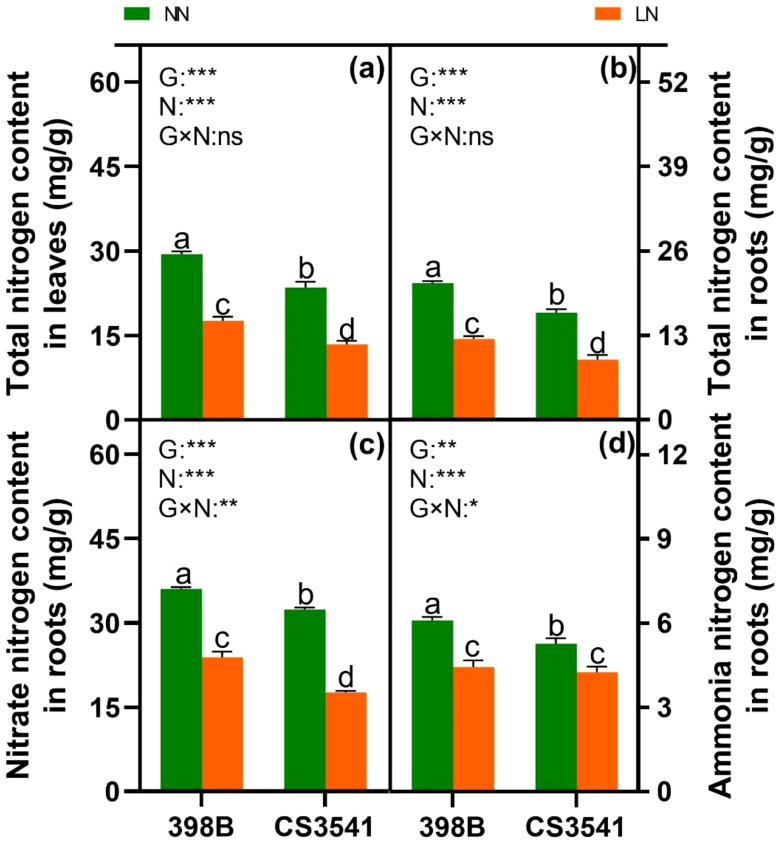
Materials and methods: This study assessed low-N tolerance in 100 sorghum-inbred lines and identified those with exceptional resilience. Principal component analysis, Pearson's correlation, and Y value analysis were used to examine various seedling growth metrics, including plant and root dimensions, biomass, chlorophyll content, root N content, shoot N content, and root/shoot ratio.

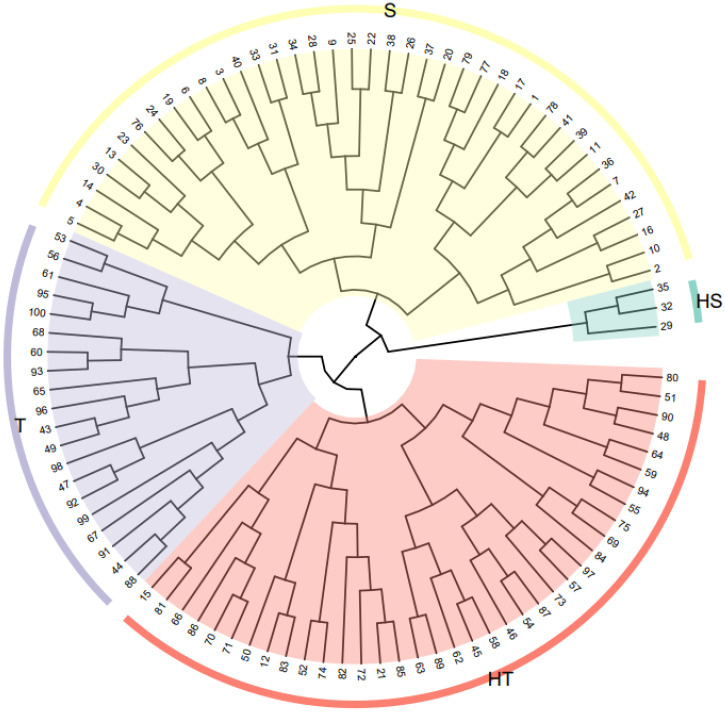
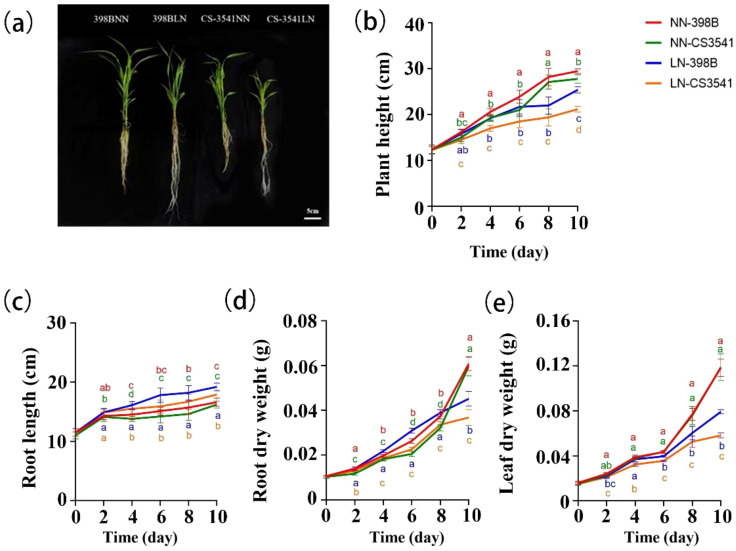
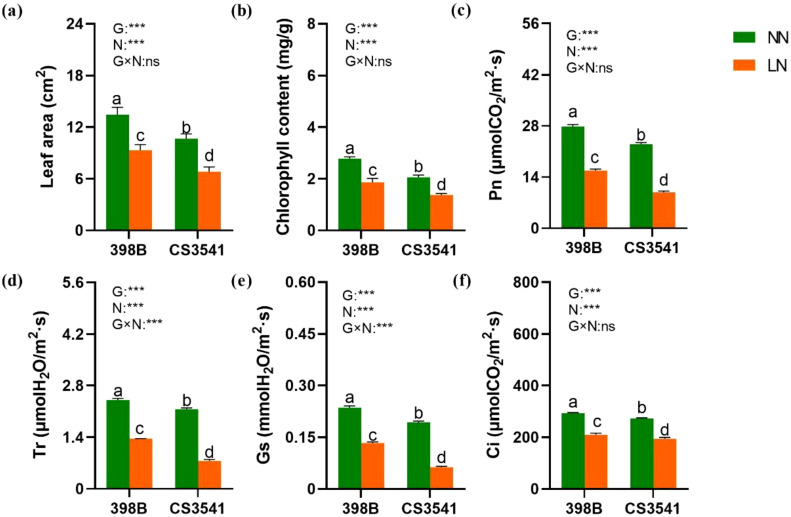
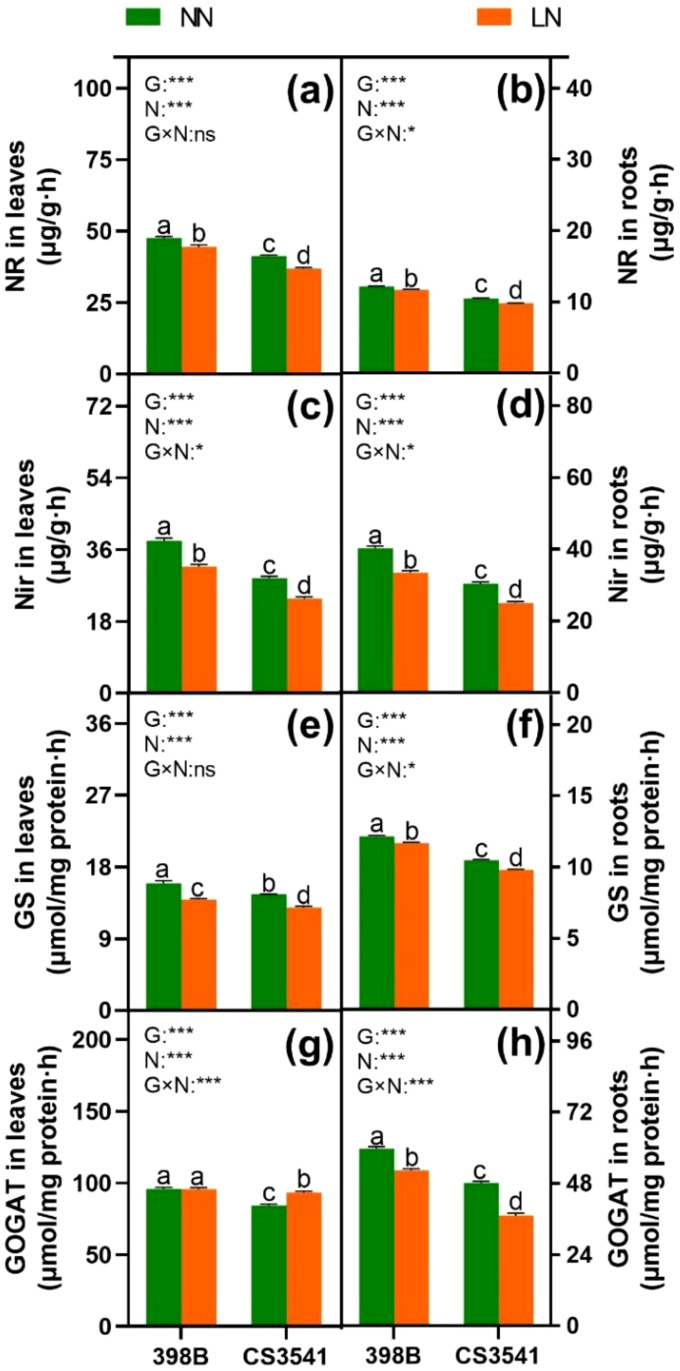
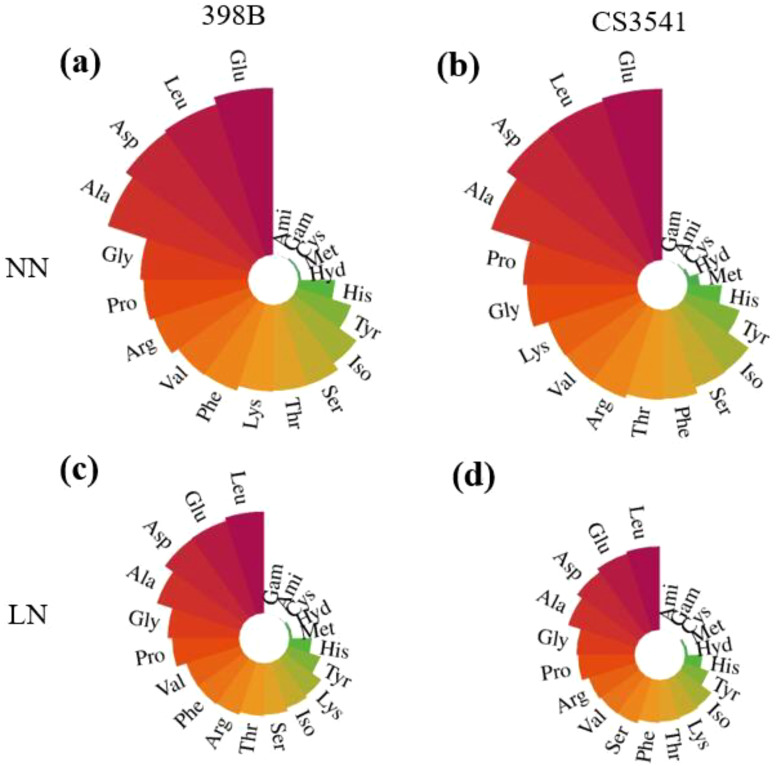
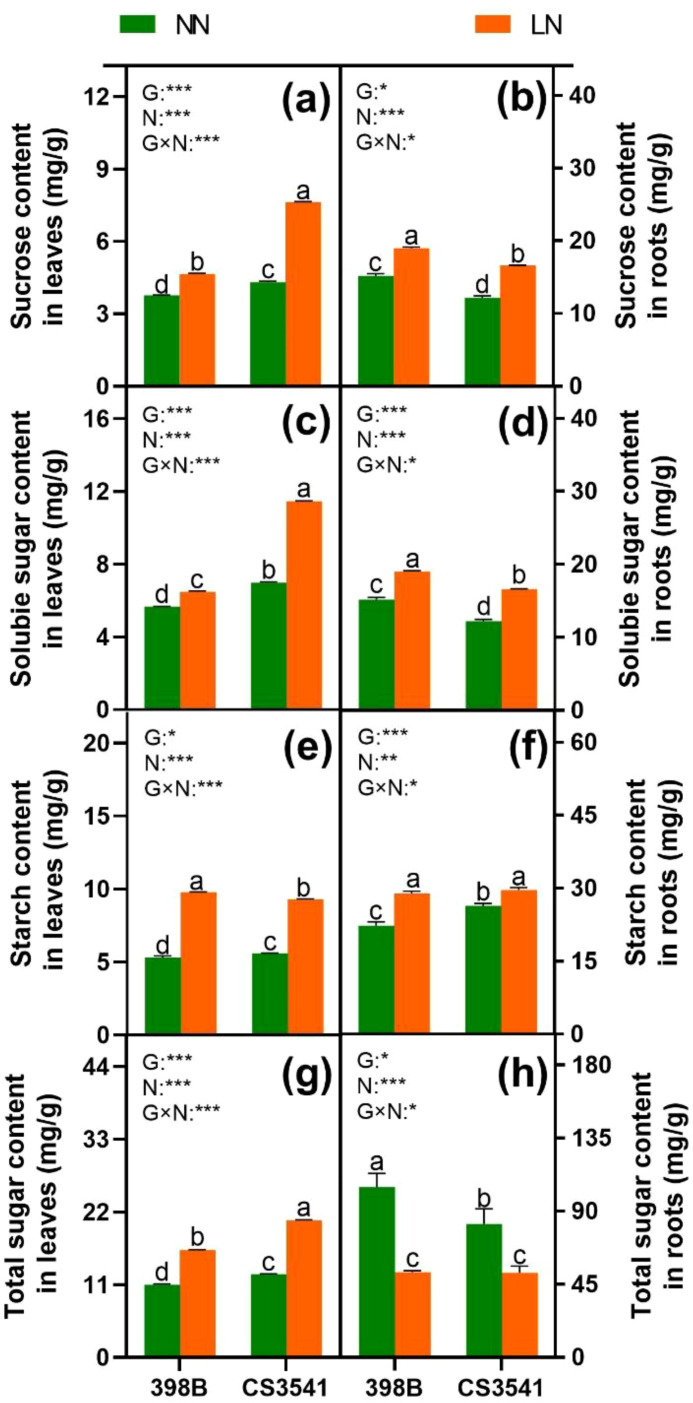
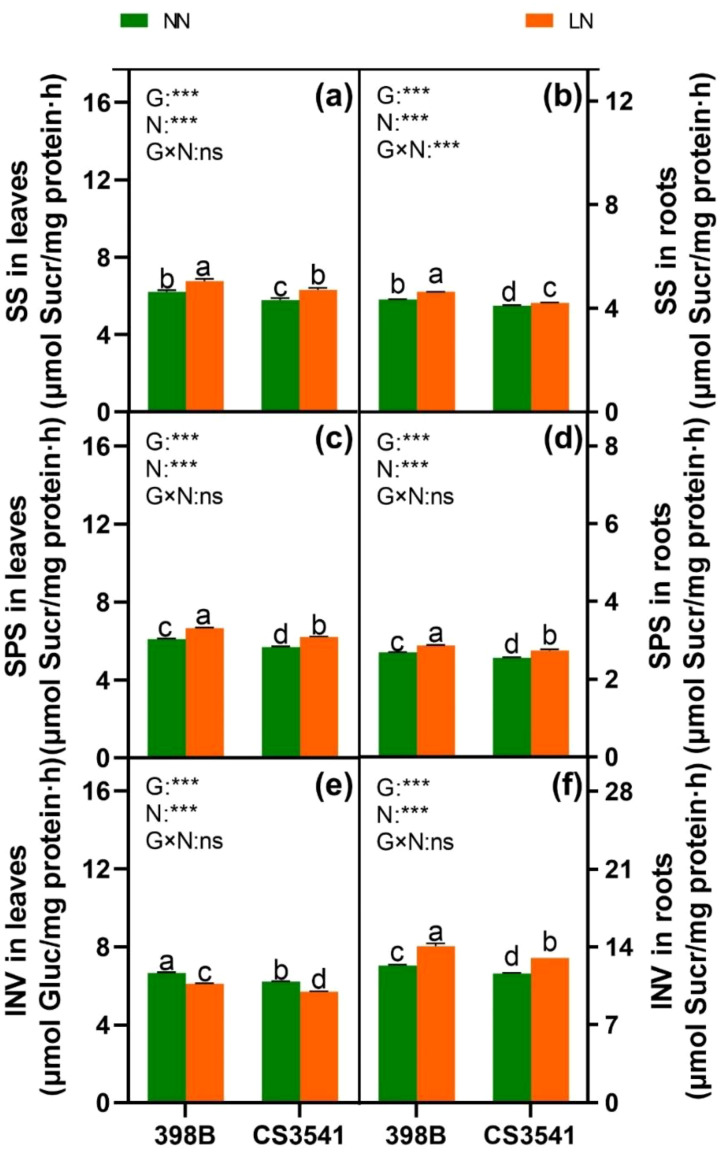
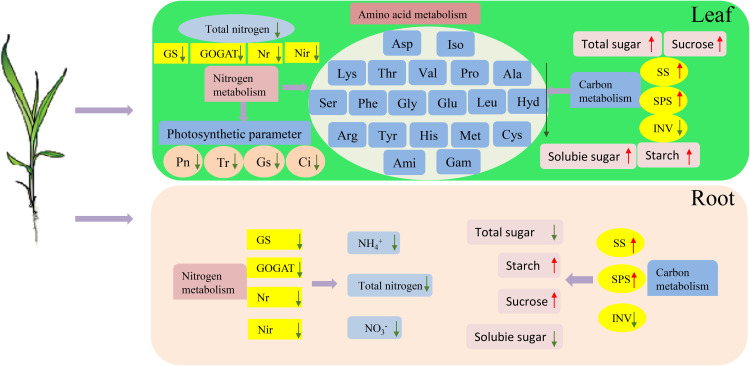
Results and discussion: The genotypes were categorized into four distinct groups based on their respective Y values, revealing a spectrum from highly tolerant to sensitive. Low-N-tolerant sorghum lines maintained higher photosynthetic rates and exhibited increased enzymatic activities linked to carbon and N metabolism in the leaves and roots. Furthermore, low-N-tolerant genotypes had higher levels of key amino acids, including cystine, glycine, histidine, isoleucine, leucine, phenylalanine, threonine, and tyrosine, indicating a robust internal metabolic response to N deficiency.

Conclusion: This study provides a comprehensive and reliable approach for the evaluation of sorghum tolerance to low-N environments, sheds light on its morphological and physiological adaptations, and provides valuable insights for future breeding programs and agricultural practices.

Keywords: C metabolism; N metabolism; Sorghum bicolor; genotypic variation; low-N tolerance screening; phenotype.


Conflict of interest statement

The authors declare that the research was conducted in the absence of any commercial or financial relationships that could be construed as a potential conflict of interest.

Figures

Figure 1
Figure 1
Relative morphological and physiological property values conveying tolerance to N stress in 100 sorghum genotypes determined using a hydroponic experiment. Data are expressed relative to the treatment with normal nitrogen (NN: 7.5 mmol·L-1 N). FW, fresh weight; DW, dry weight; plant height (cm); root length (cm); shoot FW (g); shoot DW (g); root FW (g); root DW (g); root N content (g/kg); and shoot N content (g/kg). The X axes represent the relative values, which were the values under low-N treatment (-N) compared with the values under normal N treatment (CK). The Y axes represent the morphological and physiological parameters.
Figure 2
Figure 2
Pearson’s correlation coefficients for the sorghum traits after 10 days of normal-N (NN) and low-N (LN) treatment. FW, fresh weight; DW, dry weight. * and ** indicate significant correlations of 0.05 and 0.01, respectively.
Figure 3
Figure 3
Cluster analysis diagram showing the sorghum genotypes (numbers 1–100 are the ranking of the low-N tolerance of each genotype). Red indicates high low-N-tolerant genotypes (HT), purple indicates low-N tolerant-genotypes (T), yellow indicates low-N-sensitive genotypes (S), and green indicates high-low-N-sensitive genotypes (HS).
Figure 4
Figure 4
Growth characteristics of the two genotypes after normal-N (NN) and low-N (LN) treatment. Phenotypes of the low-N-tolerant genotype (398B) and low-N-sensitive genotype (CS3541) after 10 days of NN and LN treatments (A). Changes in plant height (B), root length (C), root dry weight (D), and leaf dry weight (E) after 0, 2, 4, 6, 8, and 10 days of the NN and LN treatments. Bar, 5 cm. Different letters indicate significant differences (P < 0.05).
Figure 5
Figure 5
Effects of low-N stress on leaf and root microstructure in sorghum seedlings. (A) Changes in leaf microstructure after 10 days of normal-N (NN) and low-N (LN) treatment. ×40 magnification; scale bar, 20 μm. B, bulliform cells; V, vascular bundles; M, mesophyll tissue. (B) Changes in root microstructure after 10 days of NN and LN treatment. ×10 magnification; scale bar, 10 μm. R, root cap; Me, meristematic zone; Ez, elongation zone; Mz, maturation zone.
Figure 6
Figure 6
Effects of low-N stress on leaf area and photosynthetic characteristics in sorghum seedlings. Changes in leaf area (A), chlorophyll content (B), Pn (C), Tr (D), Gs (E), and Ci (F) after 10 days of normal-N (NN) and low-N (LN) treatment. Pn, net photosynthetic rate; Gs, stomatal conductivity; Tr, transpiration rate; Ci, intercellular CO2 concentration. Different lowercase letters indicate significant differences among the different genotypes (P < 0.05) under normal-N (NN) and low-N stress (LN). The P-values of ANOVA for N treatment, genotypes (G), and their interactions are indicated. ***P < 0.001; ns, no significance.
Figure 7
Figure 7
Effects of low-N stress on total N content and NO3 - and NH4 + content in sorghum seedlings. Changes in total N content in leaves and roots (A, B); NO3 - and NH4 + content in roots (C, D) after 10 days of normal-N (NN) and low-N (LN) treatment. Different lowercase letters indicate significant differences among the different genotypes (P < 0.05) under normal-N (NN) and low-N stress (LN). The P-values of ANOVA for N treatment, genotypes (G), and their interactions are indicated. *P < 0.05; **P < 0.01; ***P < 0.001; ns, no significance.
Figure 8
Figure 8
Effects of low-N stress on leaf and root N metabolism enzyme activities in sorghum seedlings. Changes in the NR of leaves and roots (A, B), NiR of leaves and roots (C, D), GS of leaves and roots (E, F), and GOGAT of leaves and roots (G, H) after 10 days of normal-N (NN) and low-N (LN) treatment. NR, nitrate reductase; NiR, nitrite reductase; GS, glutamine synthetase; GOGAT, glutamate synthase. Different lowercase letters indicate significant differences among the different genotypes (P < 0.05) under normal-N (NN) and low-N stress (LN). The P-values of ANOVA for N treatment, genotypes (G), and their interactions are indicated. *P < 0.05; ***P < 0.001; ns, no significance.
Figure 9
Figure 9
Effects of low-N stress on leaf amino acid content in sorghum seedlings. Changes in amino acid content of 398B leaves after 10 days of normal-N (NN) treatment (A), CS3541 leaves after 10 days of NN treatment (B), 398B leaves after 10 days of low-N (LN) treatment (C), and CS3541 leaves after 10 days of LN treatment (D). Amino acids: His, histidine; Hyd, 4-hydroxy-L-proline; Arg, arginine; Ser, serine; Gly, glycine; Asp, aspartic acid; Glu, glutamic acid; Thr, threonine; Ala, alanine; Gam, gamma-aminobutyric acid; Pro, proline; Ami, D-2-aminobutyric acid; Lys, lysine; Cys, cystine; Met, methionine; Tyr, tyrosine; Val, valine; Iso, isoleucine; Leu, leucine; Phe, phenylalanine.
Figure 10
Figure 10
Effects of low-N stress on leaf and root sucrose, soluble sugar, starch, and total sugar in sorghum seedlings. Changes in sucrose content (A, B), soluble sugar content (C, D), starch content (E, F), and total sugar content (G, H) of leaves and roots, respectively, after 10 days of normal-N (NN) and low-N (LN) treatments. Different lowercase letters indicate significant differences among the different genotypes (P < 0.05) under normal-N (NN) and low-N stress (LN). The P-values of ANOVA for N treatment, genotypes (G), and their interactions are indicated. *P < 0.05; **P < 0.01; ***P < 0.001.
Figure 11
Figure 11
Effects of low-N stress on leaf and root C metabolism enzyme activities in sorghum seedlings. Changes in SS (A, B), SPS (C, D), and INV (E, F) in leaves and roots, respectively, after 10 days of normal-N (NN) and low-N (LN) treatments. SPS, sucrose phosphate synthase; SS, sucrose synthase; INV, invertase. Different lowercase letters indicate significant differences among the different genotypes (P < 0.05) under normal-N (NN) and low-N stress (LN). The P-values of ANOVA for N treatment, genotypes (G), and their interactions are indicated. ***P < 0.001; ns, no significance.
Figure 12
Figure 12
Effects of low-N stress on C and N metabolism in sorghum seedlings. The upward red and downward green arrows represent the increases and decreases, respectively. GS, glutamine synthetase; GOGAT, glutamate synthase; NR, nitrate reductase; NiR, nitrite reductase; SPS, sucrose phosphate synthase; SS, sucrose synthase; INV, invertase; Pn, net photosynthetic rate; Gs, stomatal conductivity; Tr, transpiration rate; Ci, intercellular CO2 concentration; Ala, alanine; Ami, D-2-aminobutyric acid; Arg, arginine; Asp, aspartic acid; Cys, cystine; Gam, gamma-aminobutyric acid; Glu, glutamic acid; Gly, glycine; His, histidine; Hyd, 4-hydroxy-L-proline; Iso, isoleucine; Leu, leucine; Lys, lysine; Met, methionine; Phe, phenylalanine; Pro, proline; Ser, serine; Thr, threonine; Tyr, tyrosine; Val, valine.

Similar articles

References

    1. Addy S., Jr-Niedziela C. E., Reddy M. P. (2010). Effect of nitrogen fertilization on stay-green and senescent sorghum hybrids in sand culture. J. Plant Nutr. 33, 185–199. doi: 10.1080/01904160903434253 - DOI
    1. Bollam S., Romana K., Rayaprolu L., Vemula A., Das R., Rathore A., et al. . (2021). Nitrogen use efficiency in Sorghum: exploring native variability for traits under variable N-Regimes. Front. Plant Sci. 12, 1–19. doi: 10.3389/fpls.2021.643192 - DOI - PMC - PubMed
    1. Buchanan C. D., Lim S., Salzman R. A., Kagiampakis I., Morishige D. T., Weers B. D., et al. . (2005). Sorghum bicolor’s transcriptome response to dehydration, high salinity and ABA. Plant Mol. Biol. 58, 699–720. doi: 10.1007/s11103-005-7876-2 - DOI - PubMed
    1. Carcedo A. J., Mayor L., Demarco P., Morris G. P., Lingenfelser J., Messina C. D., et al. . (2022). Environment characterization in Sorghum (Sorghum bicolor L.) by modeling water-deficit and heat patterns in the Great Plains Region, United States. Front. Plant Sci. 13, 768610. doi: 10.3389/fpls.2022.768610 - DOI - PMC - PubMed
    1. Du C., Zhang M., Zhou X., Bai Y., Wang L., Zhang L., et al. . (2023). Revealing the relationship between nitrogen use efficiency-related QTLs and carbon and nitrogen metabolism regulation in poplar. GCB. Bioenergy. 15, 575–592. doi: 10.1111/gcbb.13040 - DOI

LinkOut - more resources