Biochar regulates the functions of keystone taxa to reduce p-coumaric acid accumulation in soil
- PMID: 39328907
- PMCID: PMC11425655
- DOI: 10.3389/fmicb.2024.1458185
Biochar regulates the functions of keystone taxa to reduce p-coumaric acid accumulation in soil
Abstract
Introduction: Applying biochar (BC) to reduce toxic substance accumulation in soil, either through direct adsorption or modulation of the microbial community, has received considerable attention. However, a knowledge gap exists regarding how BC regulates microbial community structure and functions to mitigate toxic substance accumulation.
Methods: We previously identified p-coumaric acid (p-CA) as a representative autotoxin in tobacco rhizosphere soil. On this basis, this study simulated a soil environment with p-CA accumulation to investigate the impacts of BC on p-CA, soil physicochemical properties, and microbial community structure and function.
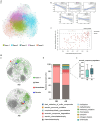
Results: The results showed that p-CA could be directly adsorbed onto BC, which followed the pseudo-second-order kinetic model (R 2 = 0.996). A pot experiment revealed that BC significantly reduced soil p-CA, altered soil microbial composition, and enhanced bacterial community diversity. A weighted correlation network analysis showed a close association between taxon 1 in the microbial network and p-CA, suggesting a pivotal role for this taxon in reducing p-CA, with Devosia and Nocardioides identified as potential key contributors to this process. The prediction of possible keystone taxa functions showed that BC increased the relative abundances of aromatic compound degraders. Mantel tests indicated that soil organic matter exerted the greatest influence on keystone taxa functions and hub genera.
Discussion: These findings suggest that BC may either directly chemisorb p-CA or indirectly facilitate p-CA degradation by regulating the functioning of keystone taxa. The results of this study provide a novel perspective for further investigation of the mechanisms through which BC reduces the accumulation of toxic substances in soil.
Keywords: adsorption characteristics; biochar; keystone taxa; microbial function; p-coumaric acid.
Copyright © 2024 Zhu, Jia, Zi, Zhou, Du, Wang, Dai, Wang and Bai.
Conflict of interest statement
Huijuan Dai is employed by the China Tobacco Hebei Industrial Co., Ltd. The remaining authors declare that the research was conducted in the absence of any commercial or financial relationships that could be construed as a potential conflict of interest.
Figures


Similar articles
-
[Potential of Arbuscular Mycorrhizal Fungi, Biochar, and Combined Amendment on Sandy Soil Improvement Driven by Microbial Community].Huan Jing Ke Xue. 2021 Apr 8;42(4):2066-2079. doi: 10.13227/j.hjkx.202008154. Huan Jing Ke Xue. 2021. PMID: 33742842 Chinese.
-
Bacterial Keystone Taxa Regulate Carbon Metabolism in the Earthworm Gut.Microbiol Spectr. 2022 Oct 26;10(5):e0108122. doi: 10.1128/spectrum.01081-22. Epub 2022 Aug 16. Microbiol Spectr. 2022. PMID: 35972247 Free PMC article.
-
Competitive interaction with keystone taxa induced negative priming under biochar amendments.Microbiome. 2019 May 20;7(1):77. doi: 10.1186/s40168-019-0693-7. Microbiome. 2019. PMID: 31109381 Free PMC article.
-
Soil acidification and salinity: the importance of biochar application to agricultural soils.Front Plant Sci. 2023 Sep 14;14:1206820. doi: 10.3389/fpls.2023.1206820. eCollection 2023. Front Plant Sci. 2023. PMID: 37780526 Free PMC article. Review.
-
Applications and synergistic degradation mechanisms of nZVI-modified biochar for the remediation of organic polluted soil and water: A review.Sci Total Environ. 2024 Feb 10;911:168548. doi: 10.1016/j.scitotenv.2023.168548. Epub 2023 Nov 20. Sci Total Environ. 2024. PMID: 37989392 Review.
References
-
- Aciego Pietri J. C., Brookes P. C. (2009). Substrate inputs and pH as factors controlling microbial biomass, activity and community structure in an arable soil. Soil Biol. Biochem. 41, 1396–1405. doi: 10.1016/j.soilbio.2009.03.017 - DOI
-
- Bai Y. X., Wang G., Cheng Y. D., Shi P. Y., Yang C. C., Yang H. W., et al. . (2019). Soil acidification in continuously cropped tobacco alters bacterial community structure and diversity via the accumulation of phenolic acids. Sci. Rep. 9:12499. doi: 10.1038/s41598-019-48611-5, PMID: - DOI - PMC - PubMed
-
- Benedek T., Pápai M., Gharieb K., Bedics A., Táncsics A., Tóth E., et al. . (2022). Nocardioides carbamazepini sp. nov., an ibuprofen degrader isolated from a biofilm bacterial community enriched on carbamazepine. Syst. Appl. Microbiol. 45:126339. doi: 10.1016/j.syapm.2022.126339, PMID: - DOI - PubMed
-
- Blum U., Staman K. L., Flint L. J., Shafer S. R. (2000). Induction and/or selection of phenolic acid-utilizing bulk-soil and rhizosphere bacteria and their influence on phenolic acid phytotoxicity. J. Chem. Ecol. 26, 2059–2078. doi: 10.1023/A:1005560214222 - DOI
LinkOut - more resources
Full Text Sources
Miscellaneous

