

Dedicator of cytokinesis 8 (DOCK8) mutation impairs the differentiation of helper T cells by regulating the glycolytic pathway of CD4+ T cells
- PMID: 39329018
- PMCID: PMC11424684
- DOI: 10.1002/mco2.747
Dedicator of cytokinesis 8 (DOCK8) mutation impairs the differentiation of helper T cells by regulating the glycolytic pathway of CD4+ T cells
Abstract
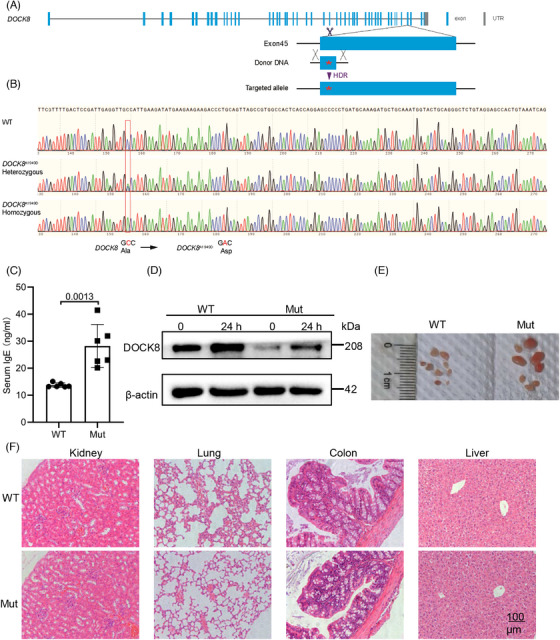
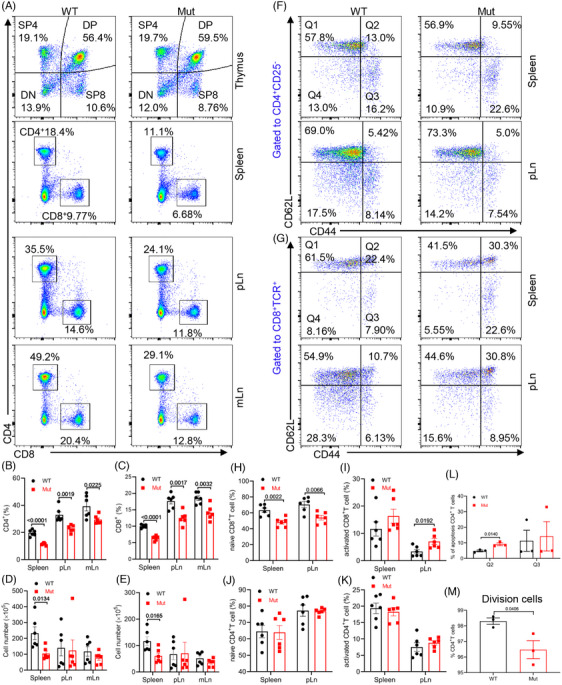
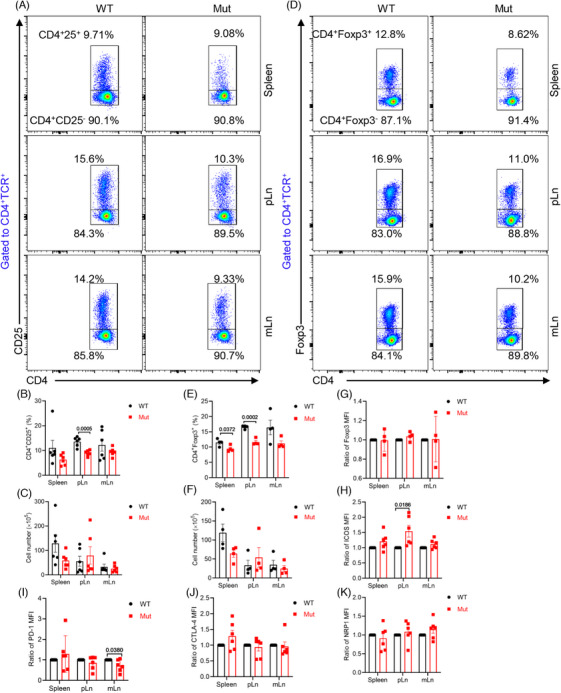
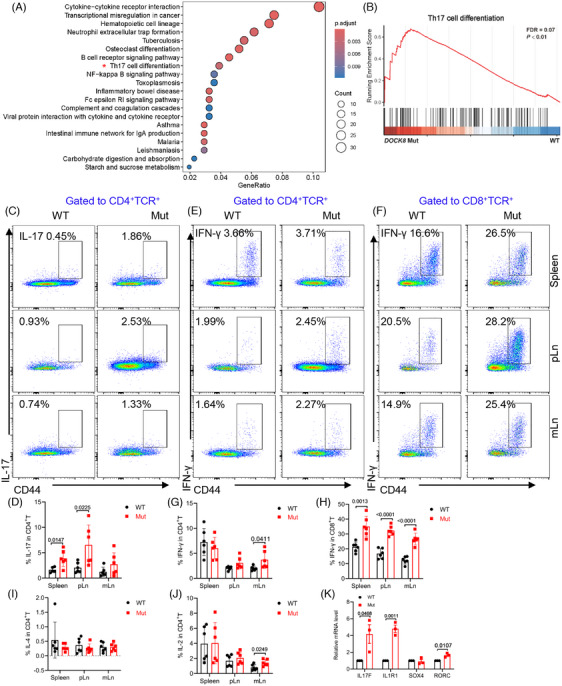
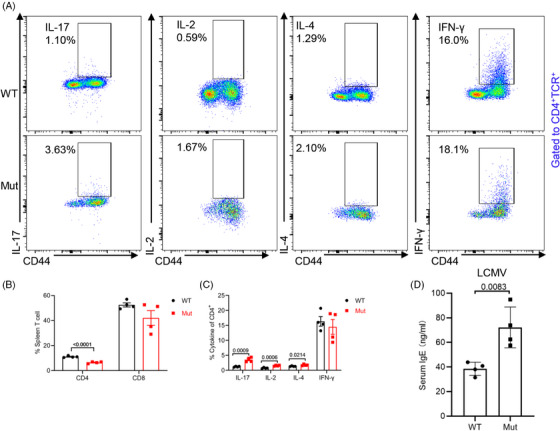
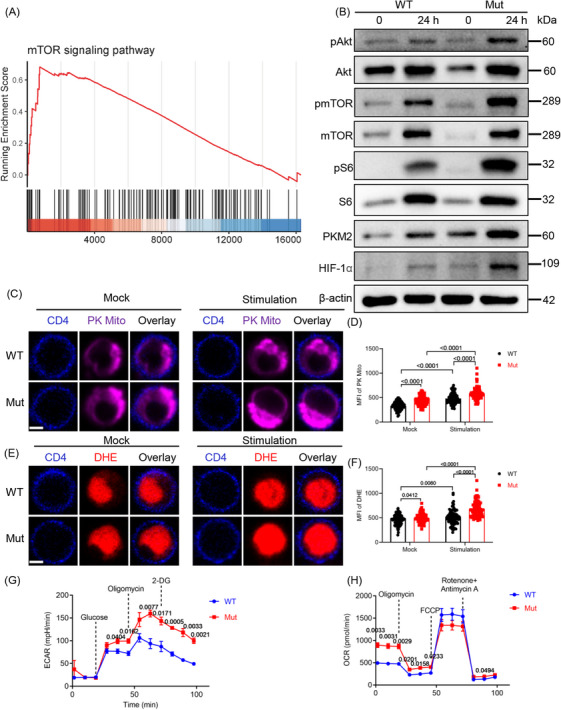
Dedicator of cytokinesis 8 (DOCK8) deficiency is a primary immunodeficiency disease caused by mutations in exon 45 of the DOCK8 gene. The clinical signs primarily consist of increased serum IgE levels, eczema, repeated skin infections, allergies, and upper respiratory tract infections. Using CRISPR/Cas9 technology, we generated a DOCK8 exon 45 mutation in mice, mirroring the mutation found in patients. The results indicated that DOCK8 mutation impairs peripheral T cell homeostasis, disrupts regulatory T cells (Tregs) development, increases ICOS expression in Tregs within peripheral lymph nodes (pLn), and promotes Th17 cell differentiation within the spleen and pLn. Upon virus infection, DOCK8 mutation CD4+ T cells have a Th2 effector fate. RNA-bulk sequencing data revealed alternations in the mTOR pathway of DOCK8 mutant CD4+ T cells. We observed that DOCK8 mutation upregulates the glycolysis levels in CD4+ T cells, which is related to the Akt/mTOR/S6/HIF-1α pathway. In summary, our research elucidates that DOCK8 regulates the differentiation of helper T cells by modulating the glycolytic pathway in CD4+ T cells, thereby advancing the comprehension and offering potential treatment of diseases in DOCK8-deficient patients.
Keywords: DOCK8; T cell; differentiation; glycolytic.
© 2024 The Author(s). MedComm published by Sichuan International Medical Exchange & Promotion Association (SCIMEA) and John Wiley & Sons Australia, Ltd.
Conflict of interest statement
Heather Miller is an employee of Cytek Biosciences but has no potential relevant financial or non‐financial interests to disclose. The other authors declare no conflicts of interest.
Figures
Similar articles
-
Dedicator of cytokinesis 8-deficient CD4+ T cells are biased to a TH2 effector fate at the expense of TH1 and TH17 cells.J Allergy Clin Immunol. 2017 Mar;139(3):933-949. doi: 10.1016/j.jaci.2016.07.016. Epub 2016 Aug 20. J Allergy Clin Immunol. 2017. PMID: 27554822 Free PMC article.
-
Dedicator of cytokinesis 8 regulates signal transducer and activator of transcription 3 activation and promotes TH17 cell differentiation.J Allergy Clin Immunol. 2016 Nov;138(5):1384-1394.e2. doi: 10.1016/j.jaci.2016.04.023. Epub 2016 May 24. J Allergy Clin Immunol. 2016. PMID: 27350570 Free PMC article.
-
The extended clinical phenotype of 64 patients with dedicator of cytokinesis 8 deficiency.J Allergy Clin Immunol. 2015 Aug;136(2):402-12. doi: 10.1016/j.jaci.2014.12.1945. Epub 2015 Feb 25. J Allergy Clin Immunol. 2015. PMID: 25724123 Free PMC article.
-
Deciphering the role of DOCK8 in tumorigenesis by regulating immunity and the application of nanotechnology in DOCK8 deficiency therapy.Front Pharmacol. 2022 Nov 1;13:1065029. doi: 10.3389/fphar.2022.1065029. eCollection 2022. Front Pharmacol. 2022. PMID: 36386145 Free PMC article. Review.
-
DOCK8 deficiency: Insights into pathophysiology, clinical features and management.Clin Immunol. 2017 Aug;181:75-82. doi: 10.1016/j.clim.2017.06.003. Epub 2017 Jun 15. Clin Immunol. 2017. PMID: 28625885 Free PMC article. Review.
Cited by
-
Exploring the differential functions of circulating follicular helper T and peripheral helper T cells in rheumatoid arthritis based on metabolism patterns.Front Immunol. 2025 Jun 17;16:1608675. doi: 10.3389/fimmu.2025.1608675. eCollection 2025. Front Immunol. 2025. PMID: 40599793 Free PMC article.
-
DOCK8 gene mutation alters cell subsets, BCR signaling, and cell metabolism in B cells.Cell Death Dis. 2024 Dec 1;15(11):871. doi: 10.1038/s41419-024-07180-w. Cell Death Dis. 2024. PMID: 39616183 Free PMC article.
References
-
- Gadea G, Blangy A. Dock‐family exchange factors in cell migration and disease. Eur J Cell Biol. 2014;93(10‐12):466‐477. - PubMed
-
- Ruusala A, Aspenström P. Isolation and characterisation of DOCK8, a member of the DOCK180‐related regulators of cell morphology. FEBS Lett. 2004;572(1‐3):159‐166. - PubMed
-
- Hall A. Rho family GTPases. Biochem Soc Trans. 2012;40(6):1378‐1382. - PubMed
LinkOut - more resources
Full Text Sources
Research Materials
Miscellaneous