. 2023 Oct;2(5):399-417.
doi: 10.1089/genbio.2023.0019. Epub 2023 Oct 16.

Influence of Alzheimer's disease related neuropathology on local microenvironment gene expression in the human inferior temporal cortex

Affiliations

Influence of Alzheimer's disease related neuropathology on local microenvironment gene expression in the human inferior temporal cortex

Sang Ho Kwon et al. GEN Biotechnol. 2023 Oct.

Abstract

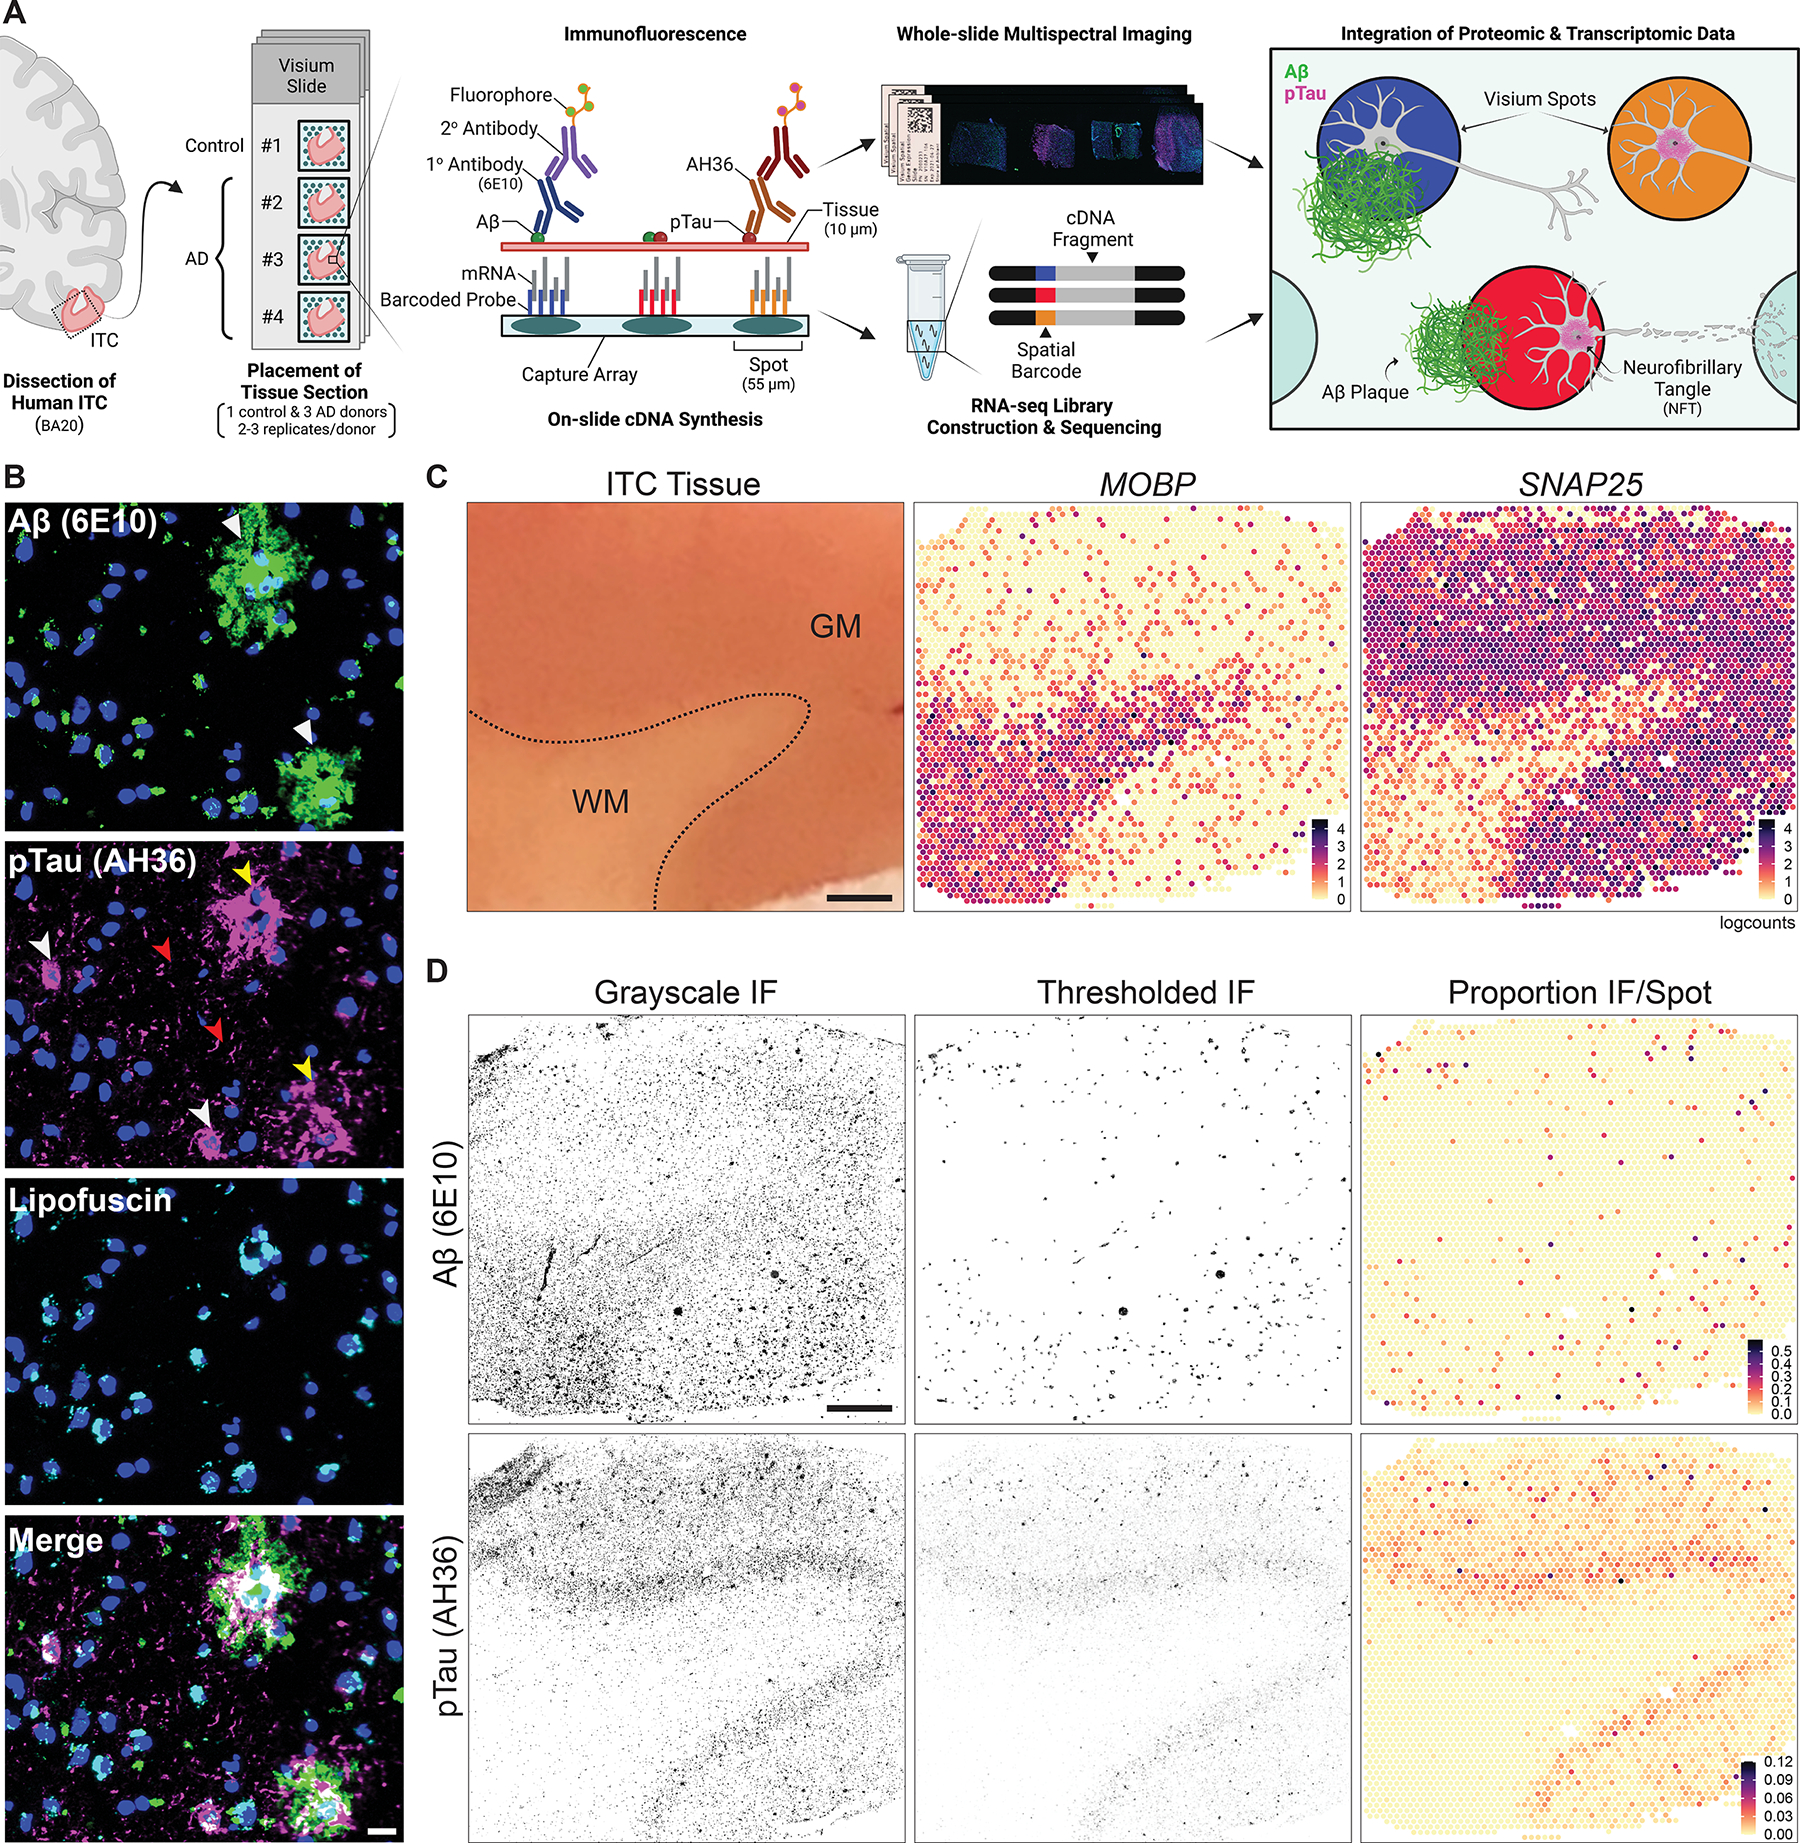
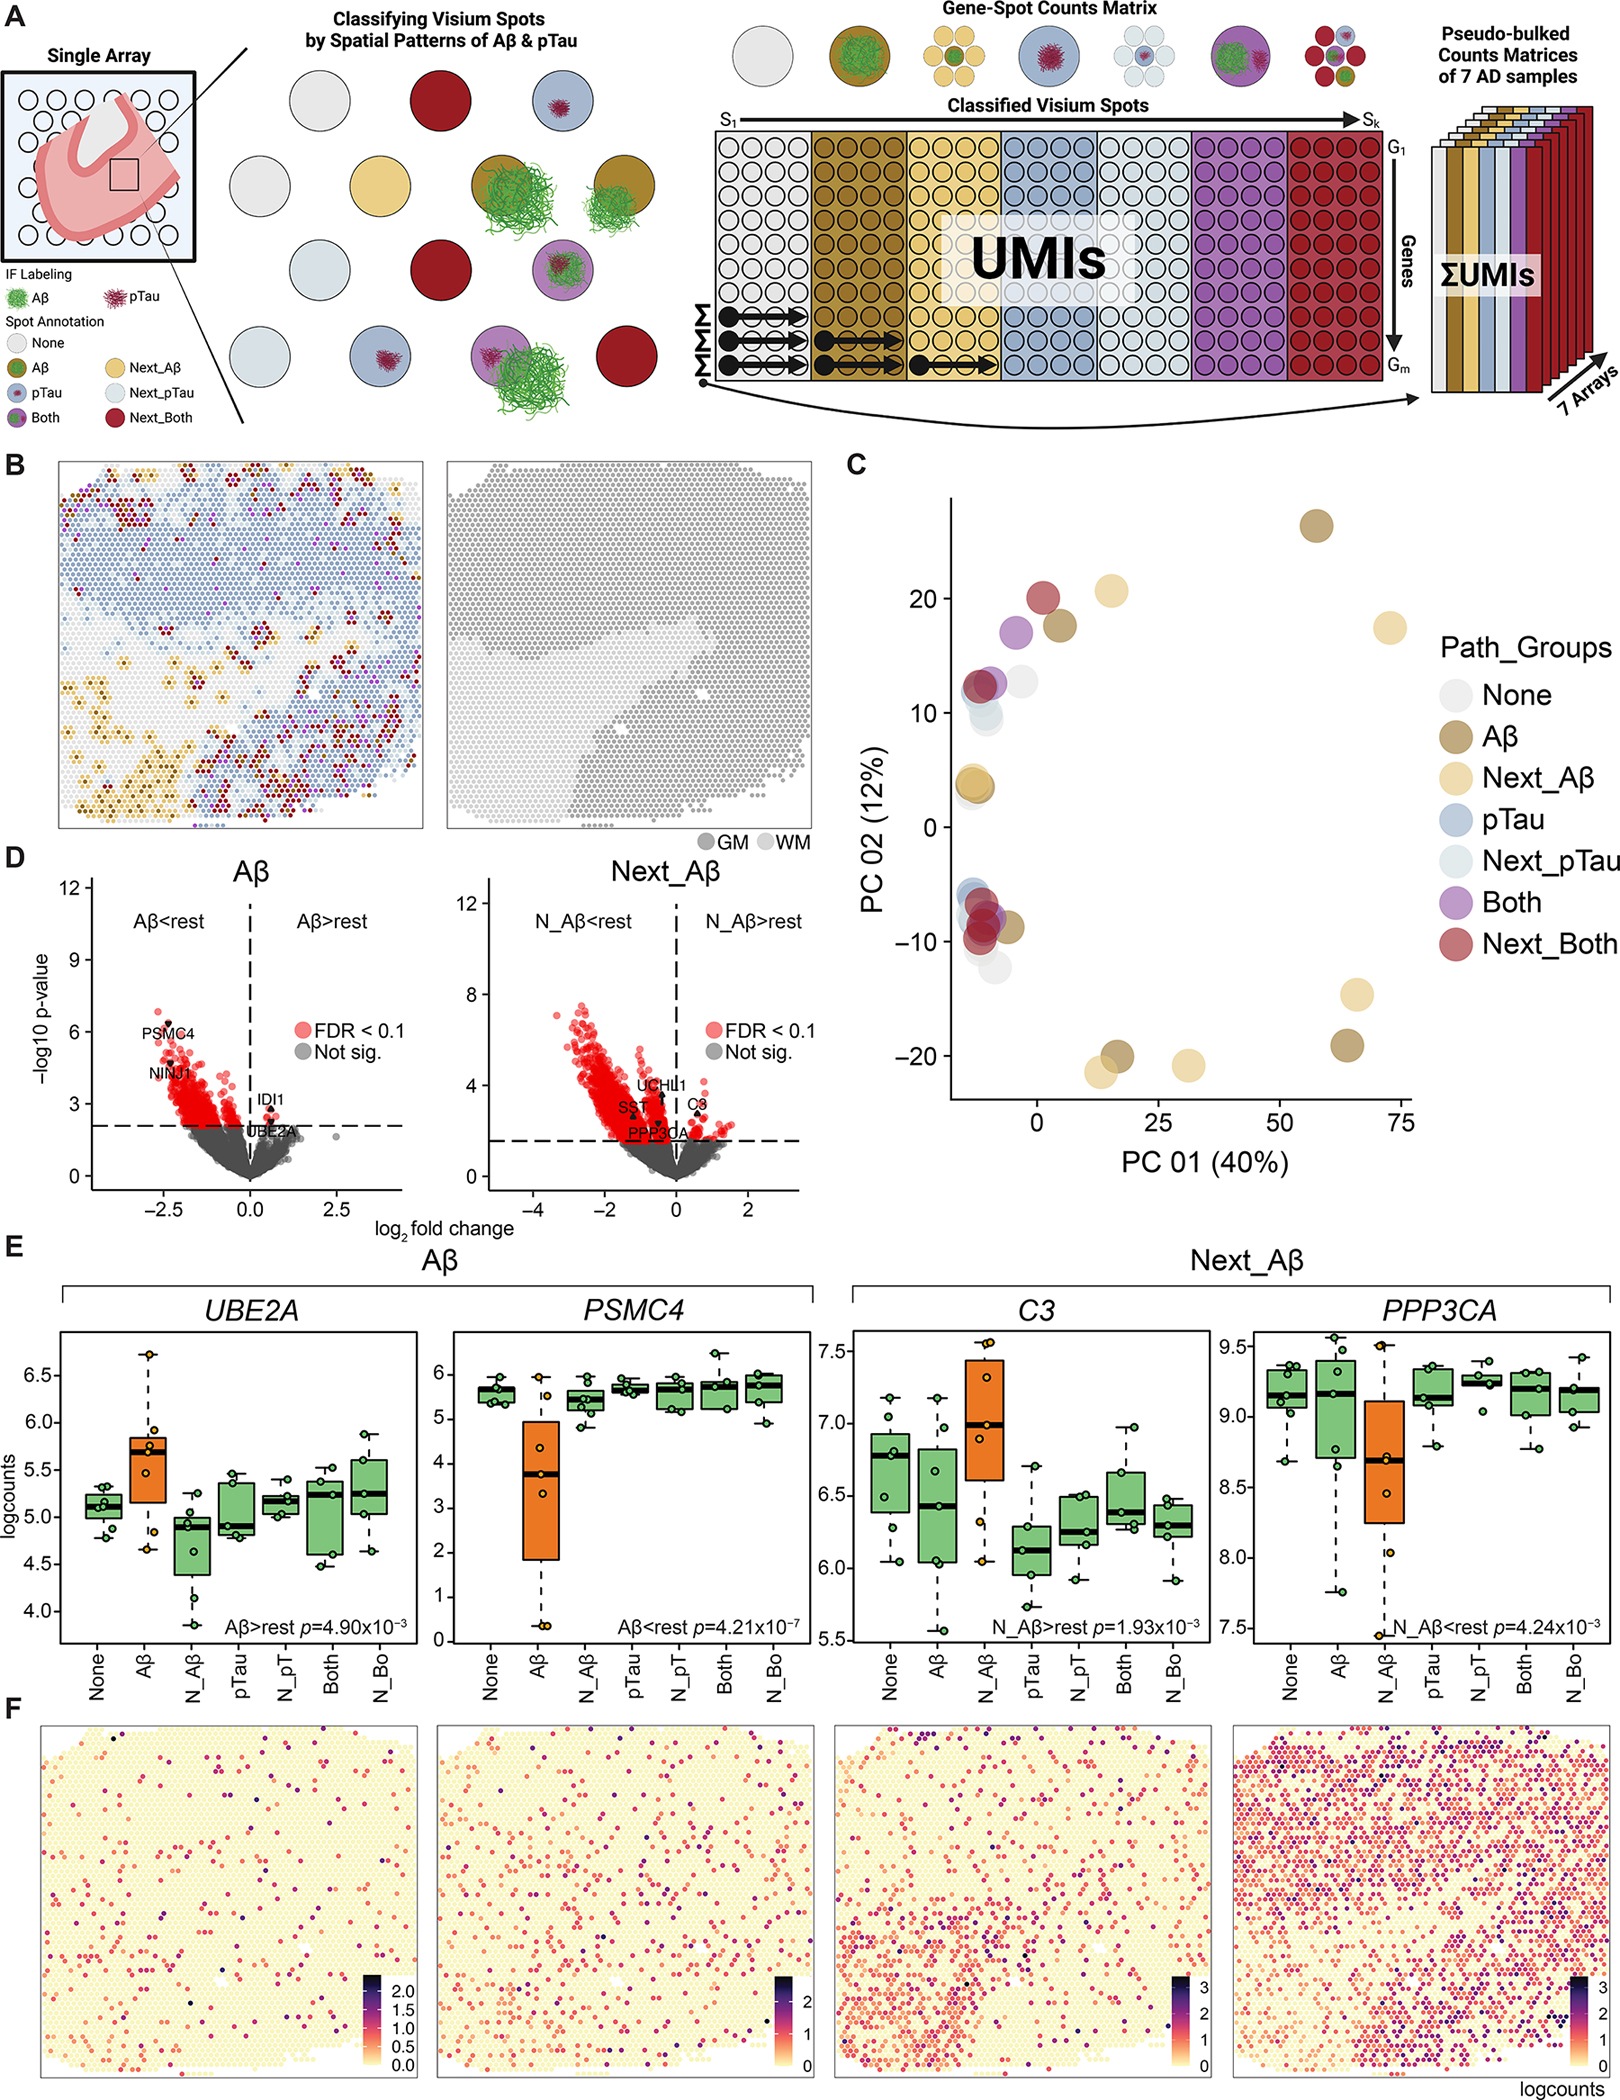
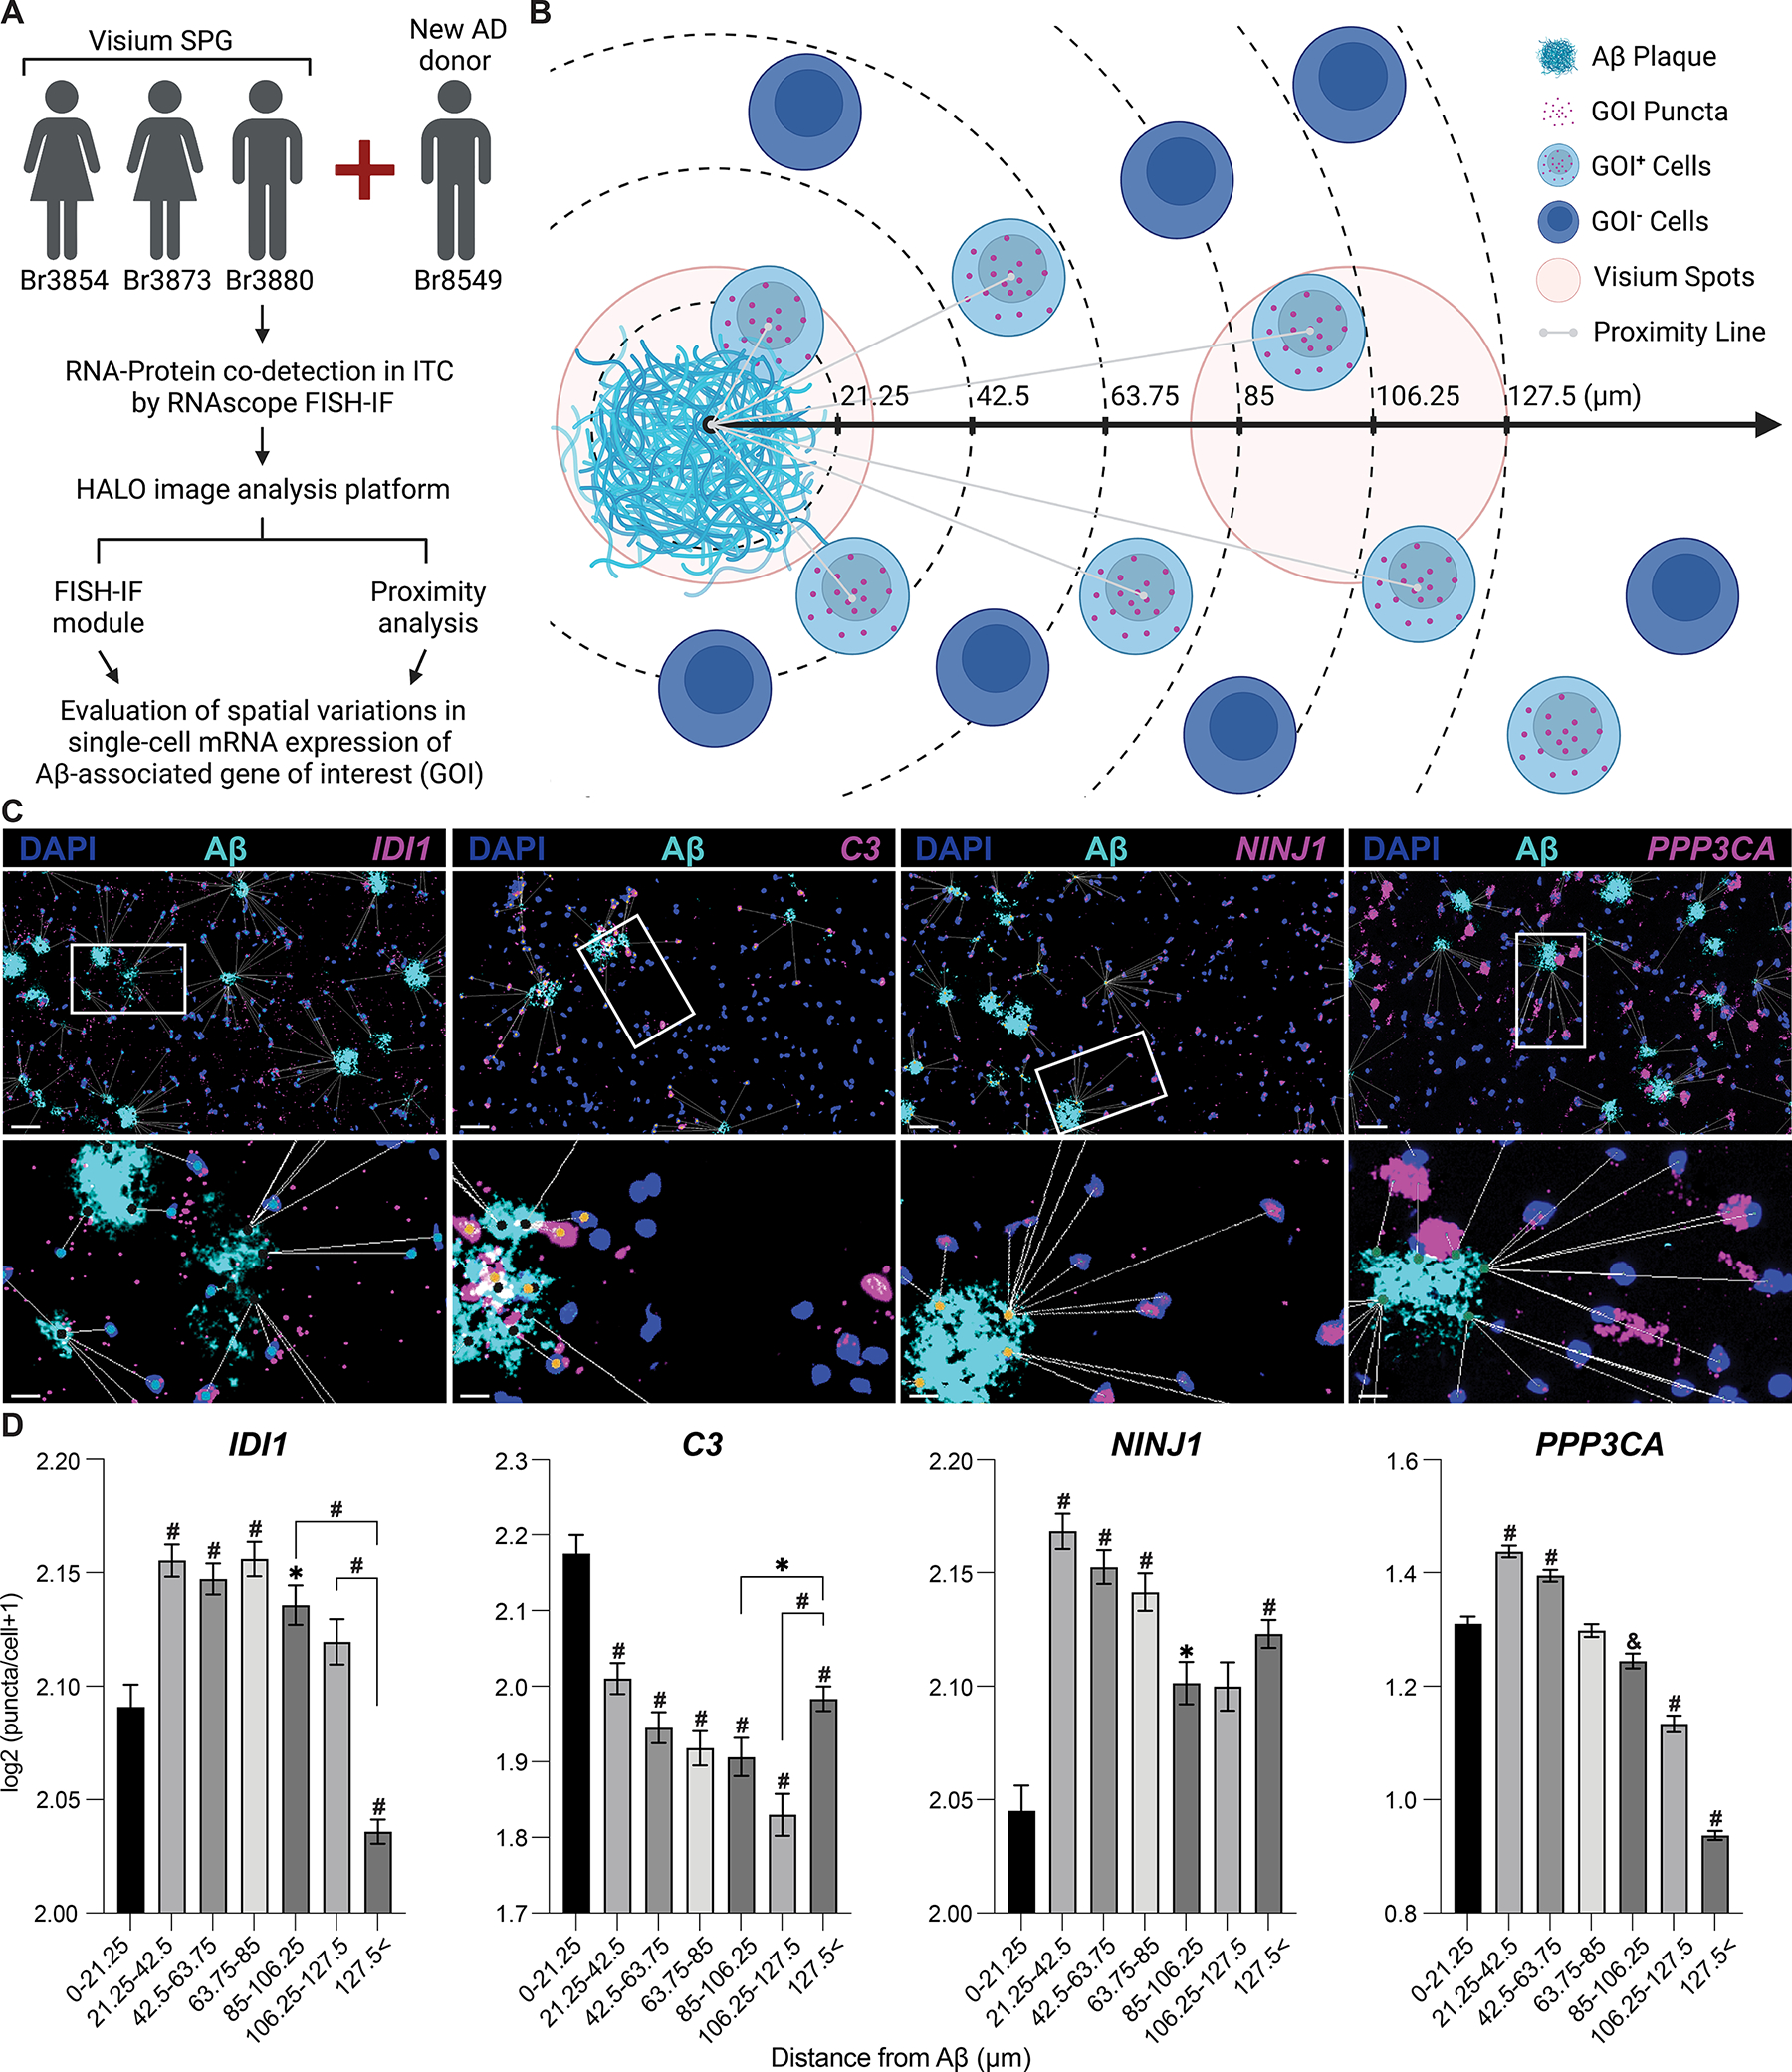
Neuropathological lesions in the brains of individuals affected with neurodegenerative disorders are hypothesized to trigger molecular and cellular processes that disturb homeostasis of local microenvironments. Here, we applied the 10x Genomics Visium Spatial Proteogenomics (Visium-SPG) platform, which couples spatial gene expression with immunofluorescence protein co-detection, to evaluate its ability to quantify changes in spatial gene expression with respect to amyloid-β (Aβ) and hyperphosphorylated tau (pTau) pathology in post-mortem human brain tissue from individuals with Alzheimer's disease (AD). We identified transcriptomic signatures associated with proximity to Aβ in the human inferior temporal cortex (ITC) during late-stage AD, which we further investigated at cellular resolution with combined immunofluorescence and single molecule fluorescent in situ hybridization (smFISH). The study provides a data analysis workflow for Visium-SPG, and the data represent a proof-of-principal for the power of multi-omic profiling in identifying changes in molecular dynamics that are spatially-associated with pathology in the human brain. We provide the scientific community with web-based, interactive resources to access the datasets of the spatially resolved AD-related transcriptomes at https://research.libd.org/Visium_SPG_AD/.

Keywords: Alzheimer's disease; RNA-protein co-detection; Spatially-resolved transcriptomics; amyloid-β (Aβ); neuropathology; phosphorylated tau (pTau).


Conflict of interest statement

Author disclosure statement SRW and MM are employees of 10x Genomics. All other authors declare no conflicts of interest.

Figures

Fig.1
Fig.1. Spatial transcriptomics combined with immunodetection of Aβ and pTau in the human inferior temporal cortex (ITC).
(A) Schematic of experimental design using Visium Spatial Proteogenomics (Visium-SPG) to investigate the impact of Aβ and pTau aggregates on the local microenvironment transcriptome in the post-mortem human brain. Human ITC blocks were acquired from 3 donors with AD and 1 age-matched neurotypical control. Tissue blocks were cryosectioned at 10μm to obtain 2–3 replicates per donor and sections were collected onto individual capture arrays of a Visium spatial gene expression slide, yielding a total of 3 gene expression experiments. The entire slide (4 tissue sections) was stained and scanned using multispectral imaging methods to detect Aβ and pTau immunofluorescence (IF) signals as well as autofluorescence. Following imaging, tissue sections were permeabilized and subjected to on-slide cDNA synthesis after which libraries were generated and sequenced. Transcriptomic data was aligned with the respective IF image data to generate gene expression maps of the local transcriptome with respect to Aβ plaques and pTau elements, including neurofibrillary tangles. (B) High magnification images show Aβ plaques (white triangles) and various neurofibrillary elements such as tangles (white arrowheads), neuropil threads (red arrowheads), and neuritic tau plaques (yellow arrowheads). Lipofuscin (cyan) was identified through spectral unmixing and pixels confounded with this autofluorescent signal were excluded from analysis, scale bar, 20μm. (C) ITC tissue block from Br3880 (left) and corresponding spotplots (right) from the Visium data show gene expression of MOBP and SNAP25, which demarcates the border between gray matter (GM) and white matter (WM), scale bar, 1mm. Color scale indicates spot-level gene expression in logcounts. (D) Image processing and quantification of Aβ and pTau per Visium spot. Aβ and pTau signals were thresholded in their single IF channels for segmentation against autofluorescence background, including lipofuscin. Thresholded Aβ and pTau signals were aligned to the gene expression map of the same tissue section from Br3880 and quantified as the proportion of number of pixels per Visium spot, which is visualized in a spotplot, scale bar, 1mm.
Fig.2
Fig.2. Identification of transcriptomic signatures in local microenvironments harboring AD-related neuropathology.
(A) Graphical overview of spot-level annotation for AD-related neuropathology (left), and strategy for pseudo-bulking annotated spots (right). Aβ and pTau labeling was quantified in individual spots, which were subsequently annotated accordingly to reconstruct spatial heterogeneity of pathology according to the following hierarchy: spots containing both Aβ and pTau (purple), Aβ pathology (brown), pTau pathology (blue), and then spots adjacent to both Aβ and pTau (red), Aβ pathology (light brown), and pTau pathology (light blue). Spots with no significant Aβ and pTau deposition were labeled white. Annotated spots were then collapsed into the 7 pathological categories in a gene × spot matrix for each tissue sample. Unique molecular identifier (UMI) counts for each gene were pseudo-bulked within an individual pathological category across the 7 replicate arrays from 3 AD donors to yield 49 pathology-enriched gene expression profiles. (B) Spotplot for Br3880 showing spot-level annotation of AD-related neuropathology (left) and unsupervised clustering of spots using BayesSpace (right). Spots associated with pathology were aggregated within gray matter (GM; dark gray), which was identified using an unsupervised clustering approach, as in Figure S12A. Any pathology-associated spots in the white matter (WM; light gray) were not included in downstream analyses. (C) PCA was performed on the 41 pseudo-bulked gene expression profiles across the 7 spatial categories of AD-related neuropathology. PC1 separated the Aβ and next_Aβ spots from the other pathological categories. (D) Volcano plots depicting differentially expressed genes (DEGs) between Aβ pathology (Aβ) or adjacent Aβ pathology (Next_Aβ) versus the rest of pathological categories. Each dot represents a gene, plotted with its log2 fold change (x-axis) and −log10 p-value (y-axis), thus comparing the effect size (fold change) against the statistical evidence for differential expression (p-value). The dashed line represents a p-value threshold matching FDR<0.1, with DEGs below the line considered not significant (gray, Not sig.) Significant DEGs that passed the FDR threshold were labeled red and classified by their enrichment (>rest) and depletion (<rest) in gene expression according to the ‘enrichment’ model. (E) Boxplots of DEGs in Aβ pathology spots (UBE2A and PSMC4) and adjacent Aβ pathology spots (C3 and PPP3CA) depicted in orange across all samples, compared to all other pathological categories depicted in green. For brevity, ‘Next’ was shortened to N. (F) Corresponding spotplots of UBE2A, PSMC4, C3, and PPP3CA for Br3880 showing spatial distribution of each DEGs. Color scale indicates spot-level gene expression in logcounts.
Fig.3
Fig.3. Characterization of Aβ-associated transcriptional signatures at cellular resolution.
(A) Flowchart of experimental design and data analysis. Human ITC tissues from 3 original AD donors plus additional male AD donor (Br8549) were subjected to multiplexed staining using RNAscope smFISH combined with immunofluorescence (FISH-IF) to detect genes of interest (GOIs) and Aβ plaques. Images were analyzed with HALO image analysis software to assess spatial relationships between Aβ and cells expressing GOI. The FISH-IF module of HALO was used for image segmentation and quantification of Aβ and GOIs. The proximity analysis module was used to determine a distance between Aβ and cells expressing or not expressing GOIs. The outputs of the two modules were integrated to measure the gene expression of GOIs within a predefined proximity of Aβ at cellular resolution. (B) Schematic describing proximity analysis. An Aβ-associated microenvironment was demarcated by approximating the Visium spot grid-line system in which the center of a single Visium spot is 127.5μm away from its neighboring spot. This distance was further subdivided into 6 evenly spaced intervals, resulting in a total of 7 bins to finely resolve the spatial gene expression gradients of GOIs. The proximity between Aβ and nearby cells expressing and not expressing GOIs was measured and used to classify into the 7 bins for quantifying the average GOI gene expression. (C) RNA-protein co-detection of Aβ and IDI1, C3, NINJ1, PPP3CA reveals the spatial distribution patterns of Aβ (cyan) and GOIs (magenta) at lower (Top, scale bar: 50μm) and higher magnifications (Bottom, scale bar: 12.5μm). Proximity lines indicate the distance between Aβ and nearby cells expressing GOIs (max: 127.5μm). (D) Bar plots show quantification of gene expression levels for GOIs in Figure 3C across 7 consecutive bins representing increased distance from Aβ, as modeled in Figure 3B. Gene expression levels were determined with log2 (X+1) transformation where X represents the counts of puncta in a single cell for a given GOI. Data are mean ± SEM. The first bin was compared to all the rest by default for statistical tests (Kruskal-Wallis test, *p<0.05, &p<0.005, and #p<0.0001). The bracket denotes statistical testing between two specified bins. Violin plots are provided in Figure S18C describing the cellular distribution and numbers counted for each bin.

Similar articles

Cited by

References

    1. Schoknecht K, David Y, Heinemann U. The blood-brain barrier-gatekeeper to neuronal homeostasis: clinical implications in the setting of stroke. Semin Cell Dev Biol. 2015;38:35–42. doi:10.1016/j.semcdb.2014.10.004 - DOI - PubMed
    1. McGavern DB, Kang SS. Illuminating viral infections in the nervous system. Nat Rev Immunol. 2011;11(5):318–329. doi:10.1038/nri2971 - DOI - PMC - PubMed
    1. Quail DF, Joyce JA. The microenvironmental landscape of brain tumors. Cancer Cell. 2017;31(3):326–341. doi:10.1016/j.ccell.2017.02.009 - DOI - PMC - PubMed
    1. Pluvinage JV, Wyss-Coray T. Systemic factors as mediators of brain homeostasis, ageing and neurodegeneration. Nat Rev Neurosci. 2020;21(2):93–102. doi:10.1038/s41583-019-0255-9 - DOI - PubMed
    1. Hemphill MA, Dauth S, Yu CJ, Dabiri BE, Parker KK. Traumatic brain injury and the neuronal microenvironment: a potential role for neuropathological mechanotransduction. Neuron. 2015;85(6):1177–1192. doi:10.1016/j.neuron.2015.02.041 - DOI - PubMed

LinkOut - more resources