. 2024 Sep 26;8(9):e70006.
doi: 10.1002/hem3.70006. eCollection 2024 Sep.

Activating mutations remodel the chromatin accessibility landscape to drive distinct regulatory networks in KMT2A-rearranged acute leukemia

Affiliations

Activating mutations remodel the chromatin accessibility landscape to drive distinct regulatory networks in KMT2A-rearranged acute leukemia

Qirui Zhang et al. Hemasphere. .

Abstract

Activating FLT3 and RAS mutations commonly occur in leukemia with KMT2A-gene rearrangements (KMT2A-r). However, how these mutations cooperate with the KMT2A-r to remodel the epigenetic landscape is unknown. Using a retroviral acute myeloid leukemia (AML) mouse model driven by KMT2A::MLLT3, we show that FLT3 ITD , FLT3 N676K , and NRAS G12D remodeled the chromatin accessibility landscape and associated transcriptional networks. Although the activating mutations shared a common core of chromatin changes, each mutation exhibits unique profiles with most opened peaks associating with enhancers in intronic or intergenic regions. Specifically, FLT3 N676K and NRAS G12D rewired similar chromatin and transcriptional networks, distinct from those mediated by FLT3 ITD . Motif analysis uncovered a role for the AP-1 family of transcription factors in KMT2A::MLLT3 leukemia with FLT3 N676K and NRAS G12D , whereas Runx1 and Stat5a/Stat5b were active in the presence of FLT3 ITD . Furthermore, transcriptional programs linked to immune cell regulation were activated in KMT2A-r AML expressing NRAS G12D or FLT3 N676K , and the expression of NKG2D-ligands on KMT2A-r cells rendered them sensitive to CAR T cell-mediated killing. Human KMT2A-r AML cells could be pharmacologically sensitized to NKG2D-CAR T cells by treatment with the histone deacetylase inhibitor LBH589 (panobinostat) which caused upregulation of NKG2D-ligand levels. Co-treatment with LBH589 and NKG2D-CAR T cells enabled robust AML cell killing, and the strongest effect was observed for cells expressing NRAS G12D . Finally, the results were validated and extended to acute leukemia in infancy. Combined, activating mutations induced mutation-specific changes in the epigenetic landscape, leading to changes in transcriptional programs orchestrated by specific transcription factor networks.


Conflict of interest statement

The authors declare no conflict of interest.

Figures
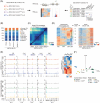
Figure 1
Figure 1
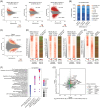
Activating mutations affected the cellular state. (A) Schematics of the experimental design, 16 mice with AML were studied by ATAC‐sequencing and integrated with existing RNA‐sequencing data (see also Hyrenius‐Wittste et al., for details on the murine leukemias). One KMT2A::MLLT3+NRAS G12D mouse (m16‐11) did not meet the Encode quality criteria for ATAC‐seq data and was excluded (Supporting Information S1: Table 1). (B) Genomic annotation of peaks for each genotype of murine AML showing a lower fraction of peaks in promoters and a higher fraction in intergenic and intronic regions for murine KMT2A::MLLT3 AML with activating mutations as compared to KMT2A::MLLT3‐alone. (C) Pearson correlation of the open peaks in mouse leukemia samples showing clustering according to genotype. (D) left: chromatin accessibility comparison of normal mouse hematopoietic cells where the top 400 DARs (fold change ≥2, Benjamini‐Hochberg adjusted p < 0.05) from pair‐wise comparison of each subpopulation to hematopoietic stem cells (HSC) were used as input for hierarchical clustering. Right: the same top 400 DARs from each normal hematopoietic comparison in the same order when applied on the murine KMT2A::MLLT3 leukemia samples. (E) Chromatin accessibility profiles (left) and transcript levels (right) of Flt3, Emp1, Cttn, Cnn3, and Etv4 in the murine KMT2A::MLLT3 AML and normal hematopoietic samples, respectively. DARs are indicated below and DARs outside of these plots can be found in Supporting Information S1: Tables 5 and 10. (F) PCA of the ATAC‐data using infant KMT2A‐r leukemia and normal hematopoietic cells, where the infant samples were projected into the PCA of the normal cells (GSE122989, GSE74912)., ,
Figure 2
Figure 2
Activating mutations remodeled the chromatin accessibility landscape. (A) Number of DARs in KMT2A::MLLT3‐driven AML carrying either of the activating mutations as compared to leukemia expressing KMT2A::MLLT3‐alone. (B) Genomic annotation of up‐regulated DARs in murine AML co‐expressing KMT2A::MLLT3 and either of the activating mutations. (C) Number of DARs in infant KMT2A‐r leukemia with activating mutations as compared to those without. (D) Chromatin openness of murine KMT2A::MLLT3 leukemia on DARs and the expression profiles of nearby genes for each mutation (KMT2A::MLLT3+FLT3 ITD : Pearson's cor = 0.23, p = 5.908e−14; KMT2A::MLLT3+FLT3 N676K : cor = 0.18, p < 2.2e−16; KMT2A::MLLT3+NRAS G12D : cor = 0.23, p < 2.2e−16). (E) Chromatin openness of infant KMT2A‐r leukemia on DARs and expression of nearby genes (Pearson's cor = 0.26, p < 2.2e−16). The DARs in (D, E) were ordered by increasing ratio of normalized RPKM signal in KMT2A‐r with activating mutations to the signal in KMT2A‐r alone. The color bar of ATAC‐seq shows the normalized RPKM signal, signals on the DARs body as well as 100 bases up‐ and down‐stream of DARs are shown. The color bar of RNA‐seq shows the gene expression ratio computed using CPM values. (F) Biological processes enriched among up‐regulated DARs in murine leukemia co‐expressing KMT2A::MLLT3 and an activating mutation. (G) The overlap between nearby genes from DARs in murine KMT2A::MLLT3+NRAS G12D and human homologs from nearby DARs in infant KMT2A‐r+RAS mut (hypergeometric test p = 1.02E−88 for upregulated and p = 1.47E−34 for downregulated genes). The three infant KMT2A‐r+RAS mut leukemias were combined and the two infant leukemias lacking an activating mutation were combined for this analysis. Dots in red: DEGs upregulated in both mouse and human leukemia; dots in blue: DEGs down‐regulated in both mouse and human leukemia; dots in green: DEGs either upregulated in mice and down‐regulated in human leukemia or downregulated in mouse and upregulated in human leukemia; dots in gray: genes nonsignificantly regulated. DEGs were identified using the corresponding RNA‐seq data (fold change ≥1.5, Benjamini‐Hochberg adjusted p < 0.05, 1236 upregulated and 845 downregulated genes).
Figure 3
Figure 3
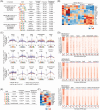
AP‐1 transcription factors were activated by FLT3 N676K and NRAS G12D in KMT2A::MLLT3 ‐driven AML. (A, B) The most highly enriched motifs in the upregulated DARs in murine KMT2A::MLLT3‐driven AML with activating mutations (A) and their transcription levels (B). (C) Differential footprints of representative transcription factor motifs. The y‐axis stands for the average ATAC‐seq signal around the predicted transcription factor binding sites. The number of binding sites is shown on the top of each footprint portrait. (D) The binding signals of motifs on the DARs in each of the murine KMT2A::MLLT3‐leukemias. The DARs were ordered by increasing ratio of normalized RPKM signal in KMT2A::MLLT3 with activating mutations to the signal in KMT2A::MLLT3 alone. The color bar shows the normalized RPKM signal. The signal on the DARs body as well as 100 bases up‐ and down‐stream of DARs are shown. The motifs in panels (A, C, and D) are same. (E, F) The most highly enriched motifs in upregulated DARs in infant KMT2A‐r leukemia with activating mutations (E) and their transcription levels (F). For enriching motifs, the combined infant KMT2A‐r leukemia with activating mutations (n = 3) and the combined infant leukemia with KMT2A‐r alone (n = 2) were used.
Figure 4
Figure 4
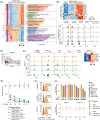
Activating mutations promoted the expression of immune genes. (A) Unsupervised hierarchical clustering of the combined DARs from murine KMT2A::MLLT3 leukemia comparing each of the activating mutations to KMT2A::MLLT3‐alone, and enriched biological process of the closest genes to the DARs. (B) Expression profiles of the GSEA leading‐edge genes for one of the processes converging on immune cell regulation (top) and chromatin accessibility profiles of representative genes (bottom) in murine leukemia with or without activating mutations. (C, D) Immune gene sets enriched in infant KMT2A‐r leukemia with activating mutations (C), chromatin accessibility profiles (D, left), and expression levels of representative genes (D, right). (E) Nkg2d‐CAR T cells target KMT2A‐r cells in a dose‐responsive manner. (F) NKG2D expression in MM6 cells is induced upon treatment with LBH589 for 24 h irrespective of NRAS mutational status. (G) LBH589 allows MM6 cells to be targeted by NKG2D‐CAR T cells and those expressing NRAS G12D are more efficiently targeted.
Figure 5
Figure 5
FLT3 ITD induced mutation‐specific gene expression profiles and chromatin accessibility landscape. (A) Heatmap showing the expression of selected genes in murine KMT2A::MLLT3 leukemia with or without activation mutations. (B) ATAC‐seq tracks depicting chromatin accessibility at the Nov and Socs2 loci for the different genetic backgrounds mentioned in panel (A). Regions with DARs are highlighted. (C) Heatmap showing the expression of Gzmb, Cma1, Mcpt8, and Socs2 across various hematopoietic stem and progenitor cell populations from normal murine bone marrow. (D) ATAC‐seq for the Gzmb, Cma1, Mcpt8 for a representative sample for each group, and public ChIP‐seq data, that demonstrated an H3K27ac signal in the murine RN2 cell line containing KMT2A::MLLT3+Nras G12D but not in murine AML driven by KMT2A::MLLT3‐alone. Enhancer coordinates revealed an enhancer in this locus (chr14:56720909‐56721677) and Hi‐C data, , , and enhancer–promoter interactions from normal hematopoietic and leukemic cells showed extensive cis‐element interactions around this enhancer. (E) Box plots comparing NOV and SOCS2 expression levels in primary AML samples with different FLT3 mutations as compared to those without using the TCGA data. (F) Kaplan–Meier survival curves comparing overall survival in AML patients with survival above or below the median from the TCGA cohort based on NOV expression levels. Statistical significance is marked with ***p < 0.001 and ****p < 0.001.

Similar articles

References

    1. Meyer C, Larghero P, Almeida Lopes B, et al. The KMT2A recombinome of acute leukemias in 2023. Leukemia. 2023;37(5):988‐1005. - PMC - PubMed
    1. Pieters R, De Lorenzo P, Ancliffe P, et al. Outcome of infants younger than 1 year with acute lymphoblastic leukemia treated with the interfant‐06 protocol: results from an international phase III randomized study. J Clin Oncol. 2019;37(25):2246‐2256. - PubMed
    1. Hucks G, Rheingold SR. The journey to CAR T cell therapy: the pediatric and young adult experience with relapsed or refractory B‐ALL. Blood Cancer J. 2019;9(2):10. - PMC - PubMed
    1. van der Sluis IM, de Lorenzo P, Kotecha RS, et al. Blinatumomab added to chemotherapy in infant lymphoblastic leukemia. N Engl J Med. 2023;388(17):1572‐1581. - PubMed
    1. Agraz‐Doblas A, Bueno C, Bashford‐Rogers R, et al. Unraveling the cellular origin and clinical prognostic markers of infant B‐cell acute lymphoblastic leukemia using genome‐wide analysis. Haematologica. 2019;104(6):1176‐1188. - PMC - PubMed