. 2024 Sep 26:7:0492.
doi: 10.34133/research.0492. eCollection 2024.

Dietary "Beigeing" Fat Contains More Phosphatidylserine and Enhances Mitochondrial Function while Counteracting Obesity

Affiliations

Dietary "Beigeing" Fat Contains More Phosphatidylserine and Enhances Mitochondrial Function while Counteracting Obesity

Yanbing Zhou et al. Research (Wash D C). .

Abstract

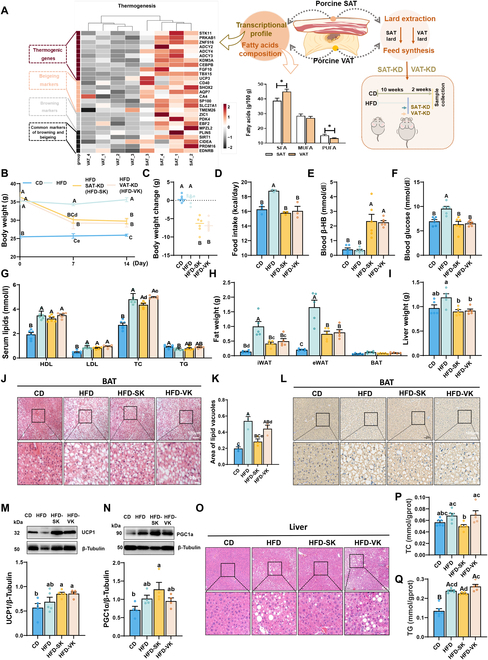
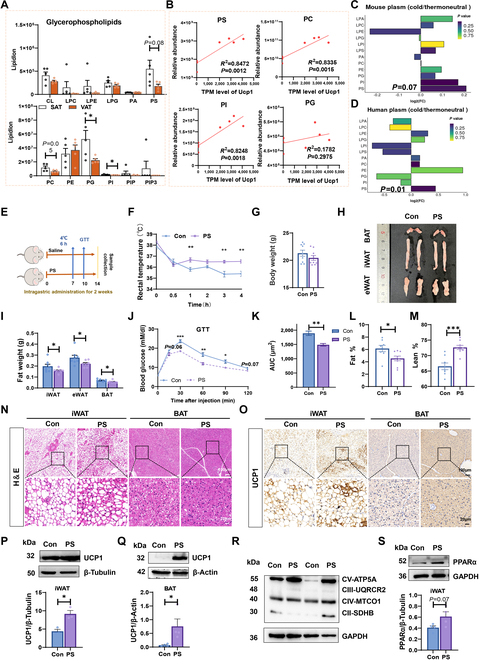
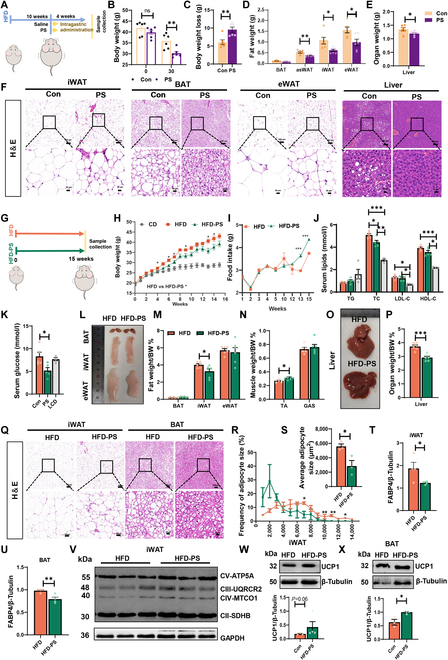
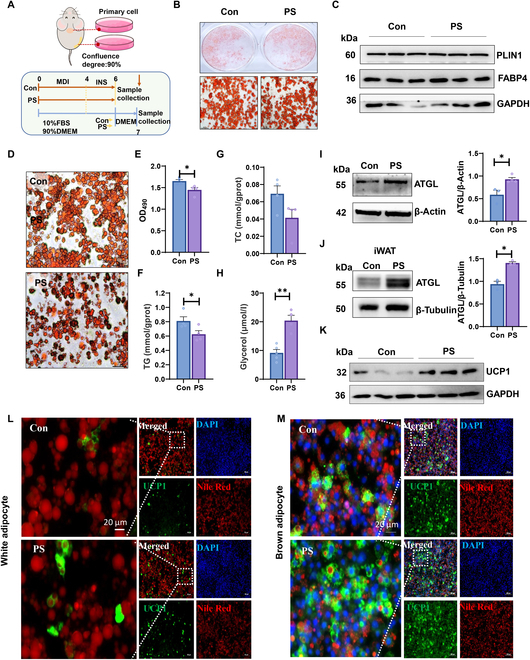
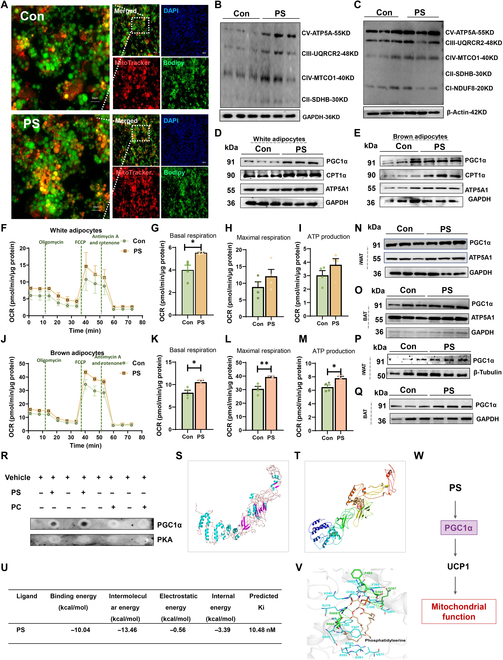
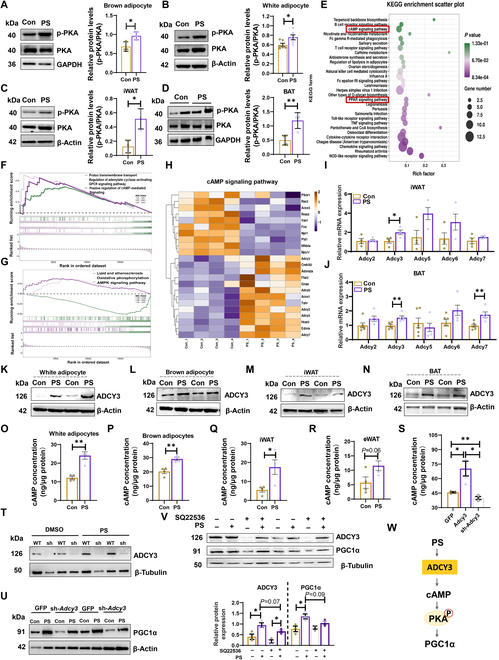
Activation of mitochondrial function and heat production in adipose tissue by the modification of dietary fat is a promising strategy against obesity. However, as an important source of lipids for ketogenic and daily diets, the function of fats extracted from different adipose tissue sites was largely unknown. In this study, we illustrated the function of fats extracted from adipose tissues with different "beigeing" properties in the ketogenic diet and identified lipid profiles of fats that facilitate energy expenditure. We found that the anti-obesity effect of ketogenic diets was potentiated by using "beigeing" fat [porcine subcutaneous adipose tissue (SAT)] as a major energy-providing ingredient. Through lipidomic analyses, phosphatidylserine (PS) was identified as a functional lipid activating thermogenesis in adipose tissue. Moreover, in vivo studies showed that PS induces adipose tissue thermogenesis and alleviates diet-induced obesity in mice. In vitro studies showed that PS promotes UCP1 expression and lipolysis of adipocytes. Mechanistically, PS promoted mitochondrial function in adipocytes via the ADCY3-cAMP-PKA-PGC1α pathway. In addition, PS-PGC1a binding may affect the stability of the PGC1α protein, which further augments PS-induced thermogenesis. These results demonstrated the efficacy of dietary SAT fats in diminishing lipid accumulation and the underlying molecular mechanism of PS in enhancing UCP1 expression and mitochondrial function. Thus, our findings suggest that as dietary fat, "beigeing" fat provides more beneficial lipids that contribute to the improvement of mitochondrial function, including PS, which may become a novel, nonpharmacological therapy to increase energy expenditure and counteract obesity and its related diseases.


Conflict of interest statement

Competing interests: The authors declare that they have no competing interests.

Figures

Fig. 1.
Fig. 1.
SAT-Fat-based KD decreased lipid deposition in BAT and liver of DIO mice. (A) Scheme of the experimental process. The heatmap depicted the thermogenesis-associated DEGs in subcutaneous adipose tissue (SAT) and visceral adipose tissue (VAT) of pigs. Bar graph displayed the contents of total SFAs, MUFAs, and PUFAs in porcine SAT and VAT. SFAs, saturated fatty acids; MUFAs, monounsaturated fatty acids; PUFAs, polyunsaturated fatty acids containing 2 or 3 to 6 double bonds. The data are presented as the means ± SEM. *P < 0.05, **P < 0.01, 2-tailed Student’s t test. (B) Body weights of SAT-KD-fed mice, VAT-KD-fed mice, HFD-fed mice, and CD-fed mice on days 0, 7, and 14 (6 mice per group). (C) Time courses of body weight changes of mice fed the respective diets for 14 days. (D) Food intake. (E) Blood β-HB and (F) glucose in mice 3 h after meal. (G) Serum lipid contents. HDL, high-density lipoprotein cholesterol; LDL, low-density lipoprotein cholesterol; TC, total cholesterol; TG; triglyceride. (H) Weight of fat tissues and (I) liver tissue. iWAT, inguinal white adipose tissue; eWAT, epididymal adipose tissue; BAT, brown adipose tissue. (J) Representative H&E staining BAT from 4 groups. Scale bars, 100 μm. (K) Area of lipid vacuoles in BAT from 4 groups (n = 3). (L) Representative UCP1 immunostaining of BAT from 4 groups. Scale bars, 100 mm. (M) Protein levels of UCP1 and (N) PGC1α in BAT. (O) Representative H&E staining of liver sections. (P) TG and (Q) TC contents in the liver of mice (n = 5 to 6). The data are presented as means ± SEM. One-way ANOVA with Tukey’s test. Groups with different superscript lowercase letters were significantly different (P < 0.05), and groups with different superscript uppercase letters differed even more significantly (P < 0.01).
Fig. 2.
Fig. 2.
PS as specific lipid modulated lipid accumulation in adipose tissue. (A) Concentrations of GPs in SAT and VAT. LPC, lysophosphatidylcholine; LPE, lysophosphatidylethanolamine; LPG, lysophosphatidylglycerol; CL, cardiolipin; PA, phosphatidic acid; PS, phosphatidylserine; PC, phosphatidylcholine; PE, phosphatidylethanolamine; PG, phosphatidylglycerol; PI, phosphatidylinositol; PIP, phosphatidylinositol phosphate; PIP3, phosphatidylinositol triphosphate. The data are presented as the means ± SEM. *P < 0.05, **P < 0.01, 2-tailed Student’s t test. (B) Correlation analysis between GP content and UCP1 expression in mouse iWAT. (C) Changes in GP composition in plasma after cold exposure in mice and (D) humans. The transparency of each bar is proportional to the significance value, which is displayed as −log10 (P value). (E) Scheme of the experimental process. Control group, normal mice treated with Saline; PS group, normal mice treated with PS 130 mg kg−1 BW per day for 2 weeks. Acute cold exposure (4 °C, 6 h) was performed on day 7 (D7) and GTT was performed on D10. (F) Rectal temperature of mice after cold stimulation. (G) Body weights of mice after 2 weeks of administration. (H) Representative macroscopic images of mouse adipose tissue after 14 days of experiment. (I) Adipose tissue weights. (J) Blood glucose concentrations and (K) calculated area under the curve (AUC) during glucose tolerance tests (GTTs) performed in Con and PS male mice (n = 6). (L) Lean body mass and (M) body fat percentage in Con and PS mice (n = 9). (N) Representative H&E staining of iWAT and BAT sections. Scale bars, 100 μm. (O) Representative UCP1 immunostaining of iWAT and BAT from 2 groups. Scale bars, 100 μm. (P) The protein level of UCP1 in iWAT and (Q) BAT of Con and PS mice. (R) The protein levels of ETC (electron transport chain) complexes (ATP5A, ATP synthase, H+ transporting, mitochondrial F1 complex, alpha 1; UQCRC2, ubiquinol-cytochrome c reductase core protein II; MTCO1, cytochrome c oxidase I; SDHB, succinate dehydrogenase complex iron sulfur subunit B) in iWAT of Con and PS mice. (S) The protein levels of PPARα in iWAT of Con and PS mice. The data are presented as means ± SEM. *P < 0.05, **P < 0.01, ***P < 0.001, 2-tailed Student’s t test.
Fig. 3.
Fig. 3.
PS alleviated HFD-induced lipid deposition. (A) Scheme of the experimental process. HFD group, HFD fed obese mice treated with Saline; PS group, HFD fed obese mice treated with PS 130 mg kg−1 BW per day for 4 weeks. (B) Body weights of DIO mice at day 0 and day 30 under normal saline or PS treatment (6 mice per group). (C) Body weight change. (D) Adipose tissue weight and (E) liver weights from the 2 groups. The error bars represent the SEM. *P < 0.05, **P < 0.01, 2-tailed Student’s t test. (F) Representative H&E staining of iWAT, eWAT, BAT, and liver sections. Scale bars, 100 μm. (G) Scheme of the experimental process. HFD group, mice fed an HFD for 15 weeks; HFD-PS group, mice fed an HFD that contained 1% PS for 15 weeks. (H) Body weight changes. (I) Food intake. (J and K) Levels of serum lipids and glucose. (L) Representative macroscopic pictures of adipose tissues. (M) Fat index = fat weight/body weight × 100. (N) Muscle index = muscle weight/body weight × 100. (O) Representative macroscopic pictures of livers. (P) Organ index = fat weight/body weight × 100. (Q) Representative H&E staining of BAT and iWAT sections. The scale bar is marked on the picture. (R) Frequency of adipocyte size in mouse iWAT sections (n = 3). (S) Average adipocyte size of iWAT sections (n = 3). (T) Protein level of FABP4 in iWAT and (U) BAT. (V) The protein levels of ETC (electron transport chain) complexes in iWAT of HFD and HFD-PS mice. (W) The protein levels of UCP1 in iWAT and (X) BAT HFD and HFD-PS mice. The data are presented as means ± SEM. *P < 0.05, **P < 0.01, ***P < 0.001, 2-tailed Student’s t test.
Fig. 4.
Fig. 4.
PS promoted lipolysis to reduce lipid accumulation in white and brown adipocytes. (A) Scheme of the experimental process. (B and C) Mouse white pre-adipocytes were treated with 10 μM PS (DMEM) or DMSO (DMEM) during adipogenic differentiation. (B) Oil Red O staining of intracellular lipid droplets. Scale bar, 100 μm. (C) Protein levels of PLIN1 and FABP4 in Con and PS-treated adipocytes. (D and E) Differentiated adipocytes were treated with 10 μM PS (DMEM) or DMSO (DMEM) for 24 h. (D) Intracellular lipid droplets stained with Oil Red O dye after lipolysis were examined by light microscopy (scale bar, 100 μm) and (E) the absorbance of the extracted Oil Red O dye in isopropyl alcohol was measured at 490 nm (n = 3). (F) TG, (G) TC contents in whole cell lysates and (H) glycerol content in culture medium. (I) Protein levels of ATGL in adipocytes and (J) iWAT of mice with or without PS treatment. (K) Protein level of UCP1 in PS-treated and Con adipocytes. (L) Differentiated white or (M) brown adipocytes treated with 10 μM PS or DMSO for 24 h were fixed and stained with a UCP1 antibody conjugated to Alexa Fluor 647 (green). Lipid droplets were stained with Nile Red (red). Nuclei were stained with DAPI (blue). Images were taken with a fluorescence microscope. Scale bar, 50 μm. The data are presented as means ± SEM (n = 3 to 4). *P < 0.05, 2-tailed Student’s t test.
Fig. 5.
Fig. 5.
PS promoted the function of adipocyte mitochondria to facilitate the lipolysis process. (A to M) Differentiated cells were treated with 10 μM PS (DMEM) or DMSO (DMEM). (A) Mitochondrial staining (MitoTracker Red CMXRos) of white adipocytes, 24 h after treatment. Scale bar, 100 μm. (B and C) Protein levels of ETC (electron transport chain) complexes (ATP5A, ATP synthase, H+ transporting, mitochondrial F1 complex, alpha 1; UQCRC2, ubiquinol-cytochrome c reductase core protein II; MTCO1, cytochrome c oxidase I; SDHB, succinate dehydrogenase complex iron sulfur subunit B;NDUFB8, ubiquinone oxidoreductase subunit B8) in white adipocytes treated with PS or DMSO for 6 h (B) or 24 h (C). (D) Protein levels of PGC1α, CPT1α, and ATP5A1 in iWAT or (E) BAT after 24 h of treatment. (F to I) An OCR assay was used to observe basal and maximal mitochondrial respiratory function in differentiated white adipocytes and (J to M) brown adipocytes after 24 h of treatment (n = 4). (N) Protein levels of PGC1α, and ATP5A1 in iWAT and (O) BAT of PS (or saline)-administered normal mice. (P) Protein levels of PGC1α in iWAT and (Q) BAT of PS (or saline)-treated DIO mice. (R) Lipid dot-blot assays of protein extracts from murine BAT treated with PS and used to detect PS binding ability with PGC1α and PKA. (S) Protein structure of PGC1α. (T) PS binding to PGC1α in 3 dimensions. (U) The molecular docking energy score and predicted inhibitory activity of PS and PGC1α. (V) 3D binding pattern of PS with PGC1α; the green dashed line shows hydrogen bonding. (W) Schematic diagram of PS affecting mitochondrial function of adipocytes. The data are presented as means ± SEM (n = 5). *P < 0.05, **P < 0.01, 2-tailed Student’s t test.
Fig. 6.
Fig. 6.
PS-enhanced mitochondrial function through ADCY3-cAMP-PKA-PGC1α signaling pathway. (A) Phosphorylation levels of PKA in brown adipocytes (n = 3) and (B) white adipocytes (n = 6) after 24 h PS (or DMSO) treatment. (C) Phosphorylation levels of PKA in iWAT (n = 3) and (D) BAT (n = 4) of PS in DIO mice. (E) Functional enrichment analyses of RNA-seq data of PS-treated white adipocytes using KEGG pathway. (F) GO and (G) KEGG enrichment pathways based on GSEA of RNA-seq data of PS-exposed white adipocytes of mice. (H) Heatmaps of the PS-induced enrichment of genes involved in the cAMP signaling pathway. (I) Relative expression of Adcy genes in PS- treated white adipocyte and (J) PS-administered normal mice iWAT at the mRNA level. (K) Expression of ADCY3 protein in white adipocyte, (L) brown adipocyte, (M) iWAT, and (N) BAT of HFD-PS mice after PS treated. (O) cAMP concentration in white adipocytes, (P) brown adipocytes and (Q and R) WAT of HFD mice after PS treatment. (S) Intracellular cAMP concentration in PS treated Adcy3 over expression 3T3-L1 cell line and Adcy3 knockdown 3T3-L1 cell line. (T and U) Expression of ADCY3 and PGC1α in Adcy3 knockdown 3T3-L1 cell line after PS treatment. (V) Expression of ADCY3, PGC1α in 3T3-L1 cell line after treated with 10 μM SQ22536 and 10 μM PS for 3 h. The data are presented as means ± SEM (n = 3 to 6). *P < 0.05, **P < 0.01, 2-tailed Student’s t test. (W) Schematic diagram of PS enhanced ADCY3-cAMP-PKA signaling in mouse adipocytes.

Similar articles

References

    1. Yin X, Chen Y, Ruze R, Xu R, Song J, Wang C, Xu Q. The evolving view of thermogenic fat and its implications in cancer and metabolic diseases. Signal Transduct Target Ther. 2022;7(1):324. - PMC - PubMed
    1. Shamsi F, Wang CH, Tseng YH. The evolving view of thermogenic adipocytes—Ontogeny, niche and function. Nat Rev Endocrinol. 2021;17(12):726–744. - PMC - PubMed
    1. Sakers A, De Siqueira MK, Seale P, Villanueva CJ. Adipose-tissue plasticity in health and disease. Cell. 2022;185(3):419–446. - PMC - PubMed
    1. Bertholet AM, Natale AM, Bisignano P, Suzuki J, Fedorenko A, Hamilton J, Brustovetsky T, Kazak L, Garrity R, Chouchani ET, et al. . Mitochondrial uncouplers induce proton leak by activating AAC and UCP1. Nature. 2022;606(7912):180–187. - PMC - PubMed
    1. Shan T, Xiong Y, Zhang P, Li Z, Jiang Q, Bi P, Yue F, Yang G, Wang Y, Liu X, et al. . Lkb1 controls brown adipose tissue growth and thermogenesis by regulating the intracellular localization of CRTC3. Nat Commun. 2016;7:12205. - PMC - PubMed

LinkOut - more resources