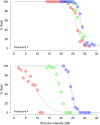
Frequency-of-seeing curves (psychometric functions) for perimetric stimuli in age-related macular degeneration
- PMID: 39329222
- PMCID: PMC11629837
- DOI: 10.1111/opo.13396
Frequency-of-seeing curves (psychometric functions) for perimetric stimuli in age-related macular degeneration
Abstract
Purpose: Frequency-of-seeing (FoS) curves (psychometric functions) for perimetric stimuli have been widely used in computer simulations of new visual field test procedures. FoS curves for age-related macular degeneration (AMD) are not available in the literature and are needed for the development of improved microperimetry test procedures, which are of particular interest for use as clinical trial endpoints.
Methods: Data were refitted from a previous study to generate FoS curves for 20 participants with AMD, each tested at nine locations within the central 10°. Stimulus parameters, background luminance and dB scale were matched to the MAIA-2 microperimeter, and stimuli were presented in a method of constant stimuli to build up FoS curves over multiple runs. FoS curves were fitted with a modified cumulative Gaussian function. The relationship between sensitivity and slope of fitted FoS curves was modelled by robust linear regression, producing models both with and without an eccentricity parameter.
Results: FoS curves were satisfactorily fitted to data from 174 visual field locations in 20 participants (age 65-83 years, 11 female). Each curve was made up of a median of 243 (range 177-297) stimulus presentations over a median of 12 (range 9-32) levels. Median sensitivity was 25.5 dB (range 3.8-31.4 dB). The median slope (SD of fitted function) was 1.6 dB (range 0.5-8.5 dB). As in previous studies of other conditions, the slope of fitted FoS curves increased as sensitivity decreased (p < 0.001).
Conclusions: FoS are provided for participants with AMD, as well as models of the relationship between sensitivity and slope. These fitted models and data may be useful for computer simulation studies of microperimetry procedures. Full details of the fitted curves are provided as supporting information.
Keywords: age‐related macular degeneration; frequency‐of‐seeing; microperimetry; perimetry; psychometric function.
© 2024 The Author(s). Ophthalmic and Physiological Optics published by John Wiley & Sons Ltd on behalf of College of Optometrists.
Conflict of interest statement
The authors declare no conflicts of interest.
Figures


Similar articles
-
Longitudinal changes in microperimetry and low luminance visual acuity in age-related macular degeneration.JAMA Ophthalmol. 2015 Apr;133(4):442-8. doi: 10.1001/jamaophthalmol.2014.5963. JAMA Ophthalmol. 2015. PMID: 25632841
-
Assessment of macular function by microperimetry in intermediate age-related macular degeneration.Eur J Ophthalmol. 2008 Jul-Aug;18(4):595-600. doi: 10.1177/112067210801800416. Eur J Ophthalmol. 2008. PMID: 18609481
-
Assessment of the reliability of standard automated perimetry in regions of glaucomatous damage.Ophthalmology. 2014 Jul;121(7):1359-69. doi: 10.1016/j.ophtha.2014.01.020. Epub 2014 Mar 12. Ophthalmology. 2014. PMID: 24629617 Free PMC article.
-
Microperimetry in age: related macular degeneration.Eye (Lond). 2017 Jul;31(7):985-994. doi: 10.1038/eye.2017.34. Epub 2017 Mar 3. Eye (Lond). 2017. PMID: 28257134 Free PMC article. Review.
-
Fundus-driven perimetry (microperimetry) compared to conventional static automated perimetry: similarities, differences, and clinical applications.Can J Ophthalmol. 2013 Oct;48(5):358-63. doi: 10.1016/j.jcjo.2013.03.021. Epub 2013 Sep 2. Can J Ophthalmol. 2013. PMID: 24093180 Free PMC article. Review.
References
-
- Bengtsson B, Olsson J, Heijl A, Rootzen H. A new generation of algorithms for computerized threshold perimetry, SITA. Acta Ophthalmol Scand. 1997;75:368–375. - PubMed
-
- Henson DB, Artes PH. New developments in supra‐threshold perimetry. Ophthalmic Physiol Opt. 2002;22:463–468. - PubMed
-
- Turpin A, Jankovic D, McKendrick AM. Retesting visual fields: utilizing prior information to decrease test–retest variability in glaucoma. Invest Ophthalmol Vis Sci. 2007;48:1627–1634. - PubMed
MeSH terms
Grants and funding
LinkOut - more resources
Full Text Sources
Medical
Research Materials
Miscellaneous

