

Shape-dependent cellular uptake of iron oxide nanorods: mechanisms of endocytosis and implications on cell labeling and cellular delivery
- PMID: 39329423
- PMCID: PMC11429166
- DOI: 10.1039/d4nr02408g
Shape-dependent cellular uptake of iron oxide nanorods: mechanisms of endocytosis and implications on cell labeling and cellular delivery
Abstract
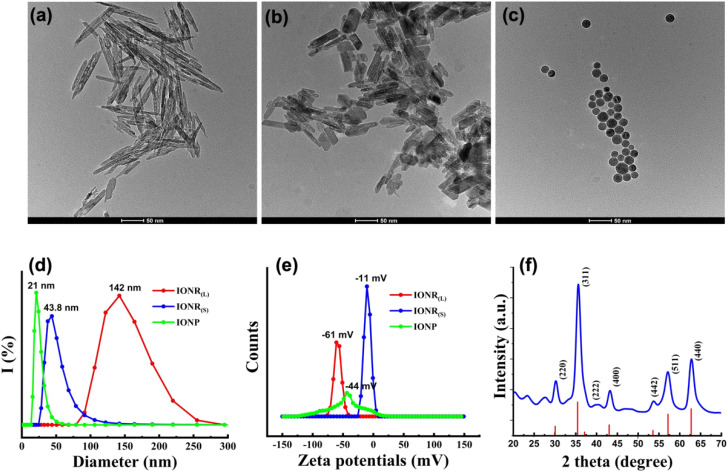
The effects of nanoparticle morphology, especially size and shape, on their interactions with cells are of great interest in understanding the fate of nanoparticles in biological systems and designing them for biomedical applications. While size and shape-dependent cell behavior, endocytosis mechanism, and subcellular distribution of nanoparticles have been investigated extensively with gold and other nanoparticles, studies on iron oxide nanoparticles (IONP), one of the most promising and well-thought-of nanomaterials in biomedical applications, were limited. In this study, we synthesized oligosaccharide-coated water-soluble iron oxide nanorods (IONR) with different core sizes (nm) and different aspect ratios (i.e., length/width), such as IONR(L) at 140/6 nm and IONR(S) at 50/7 nm as well as spherical IONP (20 nm). We investigated how their sizes and shapes affect uptake mechanisms, localization, and cell viability in different cell lines. The results of transmission electron microscopy (TEM) and confocal fluorescence microscopic imaging confirmed the internalization of these nanoparticles in different types of cells and subsequent accumulation in the subcellular compartments, such as the endosomes, and into the cytosol. Specifically, IONR(L) exhibited the highest cellular uptake compared to IONR(S) and spherical IONP, 1.36-fold and 1.17-fold higher than that of spherical IONP in macrophages and pediatric brain tumor medulloblastoma cells, respectively. To examine the cellular uptake mechanisms preferred by the different IONR and IONP, we used different endocytosis inhibitors to block specific cellular internalization pathways when cells were treated with different nanoparticles. The results from these blocking experiments showed that IONR(L) enter macrophages and normal kidney cells through clathrin-mediated, dynamin-dependent, and macropinocytosis/phagocytosis pathways, while they are internalized in cancer cells primarily via clathrin/caveolae-mediated and phagocytosis mechanisms. Overall, our findings provide new insights into further development of magnetic IONR-based imaging probes and drug delivery systems for biomedical applications.
Conflict of interest statement
There are no conflicts to declare.
Figures


Similar articles
-
Glucose-coated superparamagnetic iron oxide nanoparticles prepared by metal vapour synthesis are electively internalized in a pancreatic adenocarcinoma cell line expressing GLUT1 transporter.PLoS One. 2015 Apr 15;10(4):e0123159. doi: 10.1371/journal.pone.0123159. eCollection 2015. PLoS One. 2015. PMID: 25874906 Free PMC article.
-
Raman microscopy allows to follow internalization, subcellular accumulation and fate of iron oxide nanoparticles in cells.Spectrochim Acta A Mol Biomol Spectrosc. 2024 Dec 15;323:124888. doi: 10.1016/j.saa.2024.124888. Epub 2024 Jul 26. Spectrochim Acta A Mol Biomol Spectrosc. 2024. PMID: 39116589
-
Limitations and caveats of magnetic cell labeling using transfection agent complexed iron oxide nanoparticles.Contrast Media Mol Imaging. 2012 Mar-Apr;7(2):140-52. doi: 10.1002/cmmi.472. Contrast Media Mol Imaging. 2012. PMID: 22434626
-
Advancing Nanomedicine Through Electron Microscopy: Insights Into Nanoparticle Cellular Interactions and Biomedical Applications.Int J Nanomedicine. 2025 Mar 8;20:2847-2878. doi: 10.2147/IJN.S500978. eCollection 2025. Int J Nanomedicine. 2025. PMID: 40078651 Free PMC article. Review.
-
Cellular Uptake Pathways of Nanoparticles: Process of Endocytosis and Factors Affecting their Fate.Curr Pharm Biotechnol. 2022;23(5):679-706. doi: 10.2174/1389201022666210714145356. Curr Pharm Biotechnol. 2022. PMID: 34264182 Review.
Cited by
-
Medulloblastoma: Molecular Targets and Innovative Theranostic Approaches.Pharmaceutics. 2025 Jun 4;17(6):736. doi: 10.3390/pharmaceutics17060736. Pharmaceutics. 2025. PMID: 40574048 Free PMC article. Review.
-
Mechanistic investigation on cellular internalization triggering structure-induced conformational modulation of boron-nitrogen luminogens.Chem Sci. 2025 Feb 28;16(14):6023-6034. doi: 10.1039/d4sc08296f. eCollection 2025 Apr 2. Chem Sci. 2025. PMID: 40070468 Free PMC article.
-
Advances in the treatment of atherosclerotic plaque based on nanomaterials.Nanomedicine (Lond). 2025 Apr;20(8):869-881. doi: 10.1080/17435889.2025.2480049. Epub 2025 Mar 20. Nanomedicine (Lond). 2025. PMID: 40109186 Review.
-
Surface Charge Affects the Intracellular Fate and Clearance Dynamics of CdSe/ZnS Quantum Dots in Macrophages.Nanomaterials (Basel). 2025 Aug 3;15(15):1189. doi: 10.3390/nano15151189. Nanomaterials (Basel). 2025. PMID: 40801727 Free PMC article.
References
MeSH terms
Substances
Grants and funding
LinkOut - more resources
Full Text Sources