. 2024 Oct;13(10):e12518.
doi: 10.1002/jev2.12518.

Integrin α6-containing extracellular vesicles promote lymphatic remodelling for pre-metastatic niche formation in lymph nodes via interplay with CD151

Affiliations

Integrin α6-containing extracellular vesicles promote lymphatic remodelling for pre-metastatic niche formation in lymph nodes via interplay with CD151

Yan Lin et al. J Extracell Vesicles. 2024 Oct.

Abstract

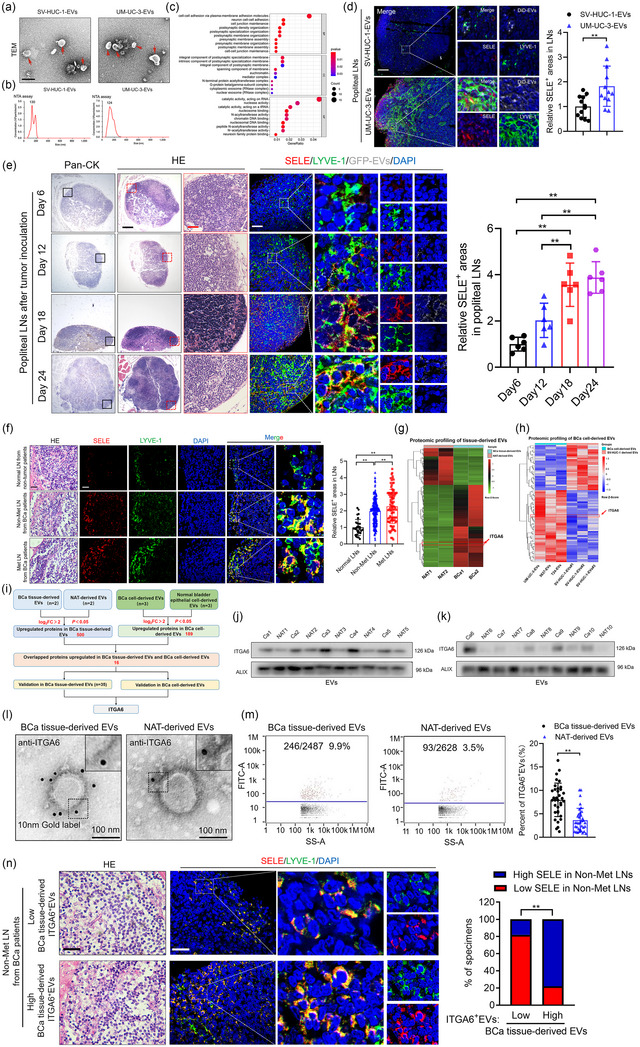
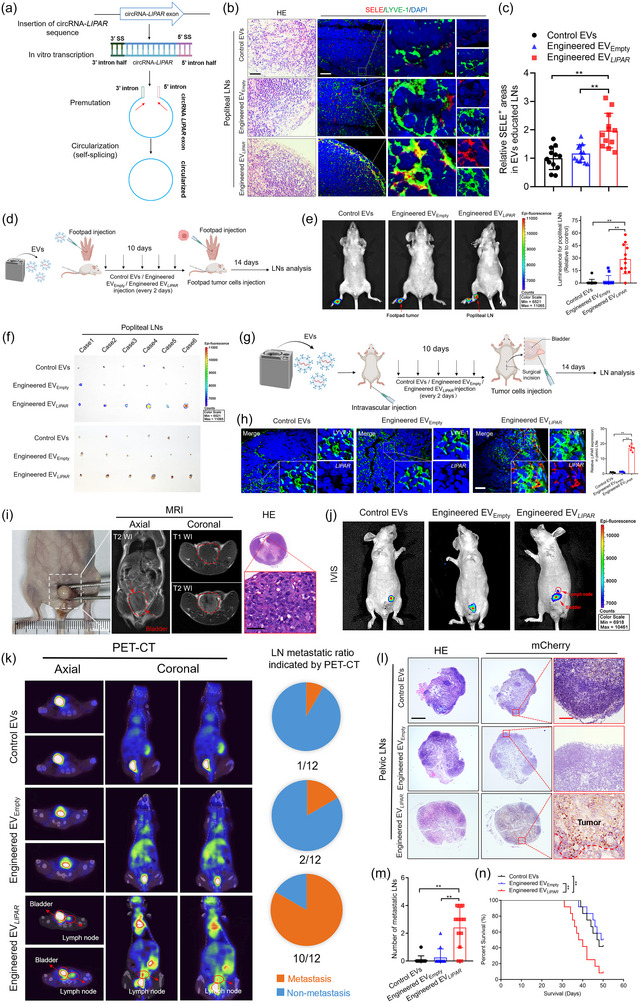
Heterogeneous extracellular vesicles (EVs) from various types of tumours are acknowledged for inducing the formation of pre-metastatic "niches" in draining lymph nodes (LNs) to promote lymphatic metastasis. In order to identify the specific subpopulations of EVs involved, we performed high-resolution proteomic analysis combined with nanoflow cytometry of bladder cancer (BCa) tissue-derived EVs to identify a novel subset of tumour-derived EVs that contain integrin α6 (ITGA6+EVs) and revealed the positive correlation of ITGA6+EVs with the formation of pre-metastatic niche in draining LNs and lymphatic metastasis in multicentre clinical analysis of 820-case BCa patients. BCa-derived ITGA6+EVs induced E-selectin (SELE)-marked lymphatic remodelling pre-metastatic niche and promoted metastasis in draining LNs through delivering cargo circRNA-LIPAR to lymphatic endothelial cells in vivo and in vitro. Mechanistically, LIPAR linked ITGA6 to the switch II domain of RAB5A and sustained RAB5A GTP-bound activated state, thus maintaining the production of ITGA6+EVs loaded with LIPAR through endosomal trafficking. ITGA6+EVs targeted lymphatic vessels through ITGA6-CD151 interplay and released LIPAR to induce SELE overexpression-marked lymphatic remodelling pre-metastatic niche. Importantly, we constructed engineered-ITGA6 EVs to inhibit lymphatic pre-metastatic niche, which suppressed lymphatic metastasis and prolonged survival in preclinical models. Collectively, our study uncovers the mechanism of BCa-derived ITGA6+EVs mediating pre-metastatic niche and provides an engineered-EV-based strategy against BCa lymphatic metastasis.

Keywords: ITGA6; bladder cancer; extracellular vesicles; lymphatic metastasis; pre‐metastatic niche.


Conflict of interest statement

The authors declare no conflicts of interest.

Figures

FIGURE 1
FIGURE 1
BCa‐derived ITGA6+EVs correlate with pre‐metastatic niche in draining LNs. (a)–(b) Representative TEM images and NTA analysis of EVs isolated from UM‐UC‐3 cells and SV‐HUC‐1 cells. Scale bars: 100 nm. (c) GO analysis of the enriched pathways in UM‐UC‐3‐EV‐educated popliteal LNs. (d) Representative images and quantifications of SELE and LYVE‐1‐indicated lymphatic vessel in popliteal LNs from the mice (= 12 per group). Scale bar: 50 µm. (e) Representative images and quantifications of SELE and LYVE‐1‐indicated lymphatic vessel in popliteal LNs from the mice after footpad tumour inoculation (= 6 per group). H&E, haematoxylin and eosin. Scale bar: 500 µm (black), 50 µm (red), 50 µm (white). (f) Representative images and quantifications of SELE and LYVE‐1‐indicated lymphatic vessel in LNs from the BCa patients (= 348). Scale bar: 50 µm (black), 50 µm (white). (g)–(h) Heatmap of the differentially expressed proteins in BCa tissue‐derived EVs compared with NAT‐derived EVs (g) or in BCa cell‐derived EVs compared with SV‐HUC‐1 derived EVs (h). (i) Schematic illustration for screening the co‐upregulated proteins in BCa tissue‐derived EVs and BCa cell‐derived EVs. (j)–(k) Western blotting analysis of ITGA6 expression in BCa tissue‐derived EVs and NAT‐derived EVs. (l)–(m) Representative immunogold‐labelling electron microscopy images (l) and flow cytometry plots (m) of BCa tissue‐derived EVs and NAT‐derived EVs (= 35). Scale bar: 100 nm. (n) Representative images and percentages of SELE positive areas in non‐metastatic LNs from BCa patients with different expression level of ITGA6 in BCa tissue‐derived EVs (= 35). Scale bar: 50 µm (black), 50 µm (white). The statistical difference was assessed by two‐tailed Student's t‐test in (d), (m) one‐way ANOVA followed by Dunnett's tests in (e), (f) the χ2 test in (n). Error bars represent the SD of three independent experiments. ANOVA, analysis of variance, BCa, bladder cancer; EVs, extracellular vesicles; LNs, lymph nodes; NAT, normal adjacent tissue; NTA, nanoparticle tracking; SD, standard deviation; SELE, E‐selectin; TEM; transmission electron microscopy. * p < 0.05, ** p < 0.01.
FIGURE 2
FIGURE 2
BCa‐derived ITGA6+EVs target HLECs in draining LNs. (a) Schematic illustration for ITGA6 deletion. (b)–(c) Western blotting analysis of ITGA6 expression in UM‐UC‐3 cells (b) and corresponding EVs (c). (d) Representative immunogold‐labelling electron microscopy images of UM‐UC‐3‐EVWT and UM‐UC‐3‐EVITGA6‐KO. Scale bar: 100 nm. (e)–(f) The NTA analysis and quantifications of UM‐UC‐3‐EVWT and UM‐UC‐3‐EVITGA6‐KO. (g) Representative images and quantifications of SELE and LYVE‐1‐indicated lymphatic vessels in popliteal LNs from mice (= 12 per group). Scale bar: 50 µm (black), 50 µm (white). (h) Representative flow cytometry analysis and quantification of DiD‐labelled EVs uptake by the indicated stromal cells in draining LNs (= 3 LNs analysed). The gating strategy is shown in Figure 2SA. (i)–(j) Representative images and quantification of BECs, HLECs, FRCs, macrophages, DCs, T cells and B cells after incubation with DiD‐labelled EVs. Scale bars: 5 µm. (k)–(m) Representative flow cytometry analysis (k)–(l) and immunofluorescence images (m) of HLECs after incubation with DiD‐labelled EVs in combination with ITGA6 neutralizing antibody. Scale bars: 5 µm. The statistical difference was assessed by two‐tailed Student's t‐test in (f), (g), (h) and (j); the one‐way ANOVA followed by Dunnett's tests in (l), (m). Error bars represent the SD of three independent experiments. ANOVA, analysis of variance, BCa, bladder cancer; FRCs, fibroblastic reticular cells; HLECs, human lymphatic endothelial cells; LNs, lymph nodes; NTA, nanoparticle tracking; SD, standard deviation; SELE, E‐selectin. * p < 0.05, ** p < 0.01.
FIGURE 3
FIGURE 3
BCa‐derived ITGA6+EVs upregulate SELE expression to promote BCa cells adhesion. (a) Schematic illustration showing the establishment of Engineered EVs. (b) Representative immunogold‐labelling electron microscopy images of Engineered EVs and Control EVs. Scale bar: 100 nm. (c)–(d) Representative flow cytometry plots (c) and quantification (d) of ITGA6 expression on the surface of Engineered EVs and Control EVs. (e) Representative bioluminescence image and quantification of popliteal LNs from the mice received DiD‐labelled EVs injection in footpad (= 12 per group). (f) Representative image and quantification of popliteal LNs after footpad injection of DiD‐labelled EVs Scale bar: 50 µm. (g)–(i) Representative immunofluorescence images (g) and flow cytometry plots (h)–(i) of HLECs incubated with DiD‐labelled EVs. Scale bars: 5 µm. (j)–(l) qRT‐PCR analysis (j), western blotting analysis (k), and representative confocal images and quantification (l) of SELE expression in HLECs incubated with UM‐UC‐3‐EVITGA6‐KO or UM‐UC‐3‐EVWT. Scale bars: 5 µm. (m)–(n) qRT‐PCR analysis (m) and representative confocal images and quantification (n) of SELE expression in HLECs incubated with UM‐UC‐3‐EVITGA6 or UM‐UC‐3‐EVVector. Scale bars: 5 µm. (o)–(q) Representative images and quantification of PKH‐67‐labelled UM‐UC‐3 cell attachment on monolayer forming by UM‐UC‐3‐EVITGA6‐KO‐incubated HLECs (o)–(p) and UM‐UC‐3‐EVITGA6‐incubated HLECs with or without knocking down SELE (q). Scale bar: 100 µm. The statistical difference was assessed by two‐tailed Student's t‐test in (d)–(g), (i), (j), (l)–(n), (p); the one‐way ANOVA followed by Dunnett's tests in (q). Error bars represent the SD of three independent experiments. * p < 0.05, ** p < 0.01. ANOVA, analysis of variance; BCa, bladder cancer; EVs, extracellular vesicles; HLECs, Human lymphatic endothelial cells; LNs, lymph nodes; qRT‐PCR, real‐time polymerase chain reaction; SD, Standard deviation; SELE, E‐selectin.
FIGURE 4
FIGURE 4
ITGA6+EVs target HLECs to transfer circRNA LIPAR by interacting with CD151. (a) Representative image showing the binding of His‐labelled rITGA6 to the plasma membrane of HLECs. Scale bar: 5 µm. (b) Pearson correlation coefficients of His‐labelled rITGA6 and membrane were calculated from multiple individual cells (= 8 fields analysed). (c)–(d) Sliver staining and MS analysis of the potential ITGA6 interacting proteins. (e) Western blotting analysis for the binding of ITGA6 and CD151 in His pull‐down assay. (f) Western blotting analysis for the binding of ITGA6 and SELE in the co‐IP assays with the membrane proteins from UM‐UC‐3‐EVITGA6‐incubated HLECs. (g) Representative image showing His‐labelled ITGA6 and CD151 colocalized on the membrane of HLECs. Scale bar: 5 µm. (h)–(i) Representative flow cytometry analysis of UM‐UC‐3‐EVITGA6‐incubated HLECs with or without knocking down CD151. (j) Schematic illustration for screening the co‐upregulated circRNAs in BCa‐derived ITGA6+EVs and BCa tissues. (k) Representative image showing ITGA6 and circRNA LIPAR colocalized on the single EV. Scale bar: 100 nm. (l)–(m) Representative images (l) and percentages (m) of SELE positive areas in non‐metastatic LNs from BCa patients with different expression level of LIPAR in BCa tissue‐derived EVs (= 35). Scale bar: 50 µm (above), 5 µm (down). (n) Schematic illustrating the genetic locus of PLEKHM1P1 gene and circRNA LIPAR derived from exon 4 and exon 5. The statistical difference was assessed by two‐tailed Student's t‐test in (b); the one‐way ANOVA followed by Dunnett's tests in (i); χ 2 test in (m). Error bars represent the SD of three independent experiments. ANOVA, analysis of variance; BCa, bladder cancer; EVs, extracellular vesicles; HLECs, Human lymphatic endothelial cells; LNs, lymph node; SD, standard deviation; SELE, E‐selectin. * p < 0.05, ** p < 0.01.
FIGURE 5
FIGURE 5
LIPAR/ITGA6/RAB5A ternary complex mediates the package of LIPAR into ITGA6+EVs. (a)–(b) Silver staining image and MS analysis of RNA pull‐down assay with LIPAR probes and control probes. (c) Western blotting analysis showing the interaction between LIPAR and RAB5A, and between LIPAR and ITGA6. (d) RIP assays revealing LIPAR enrichment by ITGA6 and RAB5A in UM‐UC‐3 cells. (e) Representative images showing LIPAR colocalized with RAB5A and ITGA6 in UM‐UC‐3 cells. Scale bars: 5 µm. (f) Schematic illustration showing the predicted binding region of LIPAR. (g)–(h) RIP assays after deletion of the 100‐ to 160‐nt and 225‐ to 285‐nt regions of LIPAR in UM‐UC‐3 cells. (i) Schematic illustration showing the structure of LIPAR/ITGA6/RAB5A ternary complex predicted by NPdock. (j) Co‐IP assays showing the interaction of ITGA6 and RAB5A. (k)–(m) Co‐IP (k), PLA (l) and immunofluorescence images (m) showing the interaction of ITGA6 and RAB5A in UM‐UC‐3 cells with or without LIPAR overexpression. Scale bars: 5 µm. (n) Co‐IP showing the interaction between ITGA6 and RAB5A was destroyed in UM‐UC‐3 cells treating with RnaseA. (o) PLA showing the interaction between ITGA6 and RAB5A in UM‐UC‐3 cells with 100‐ to 160‐nt or 225‐ to 285‐nt region of LIPAR mutating. Scale bars: 5 µm. (p) Western blotting analysis of GST‐R5BD pull‐down to detect the RAB5A activity. (q) Co‐IP showing the interaction between GDI and RAB5A was suppressed in UM‐UC‐3 cells with or without LIPAR overexpression. (r)–(s) Western blotting analysis and qRT‐PCR analysis for the expression of ITGA6 and LIPAR in early endosomes isolated from RAB5A‐DN UM‐UC‐3 cells. (t)–(u) Western blotting analysis and immunogold‐labelling electron microscopy detect expression of ITGA6 in UM‐UC‐3‐EVs. Scale bars: 100 nm. (v) qRT‐PCR analysis of LIPAR expression in UM‐UC‐3‐EVs. The statistical difference was assessed by the one‐way ANOVA followed by Dunnett's tests in (d); two‐tailed Student's t‐test in (g), (h), (s), (v). Error bars represent the SD of three independent experiments. ANOVA, analysis of variance; Co‐IP, Co‐immunoprecipitation; EVs, extracellular vesicles; PLA, proximity ligation assays; qRT‐PCR, real‐time polymerase chain reaction; RIP, RNA immunoprecipitation; SD, standard deviation. * p < 0.05, ** p < 0.01.
FIGURE 6
FIGURE 6
ITGA6+EVs deliver LIPAR into HLECs to enhance SELE transcription. (a) qRT‐PCR analysis for the expression of LIPAR in UM‐UC‐3‐EV LIPAR treating HLECs. (b)–(i) qRT‐PCR analysis (b) and (f), western blotting analysis (c) and (g) and representative images (d) and (h) and quantification (e) and (i) of SELE expression in UM‐UC‐3‐EV LIPAR treated HLECs or in combination with ITGA6 neutralizing antibody. Scale bars: 5 µm. (j)–(k) Representative images and quantification of PKH‐67‐labelled UM‐UC‐3 cells attachment on monolayer forming by HLECs with or without UM‐UC‐3‐EV LIPAR incubation. Scale bar: 100 µm. (l) Subcellular fraction analysis of HLEC LIPAR ‐KO incubating with UM‐UC‐3‐EV LIPAR . (m) Transcriptional activity of SELE in UM‐UC‐3‐EV LIPAR ‐treated HLECs transfecting with truncated SELE promoter luciferase plasmids. (n) Schematic diagram of the predicted LIPAR binding sites in the SELE promoter. (o) ChIRP analysis of the LIPAR‐associated chromatin fragments of the SELE promoter in HLECs. (p) Luciferase activity in HLECs incubating with UM‐UC‐3‐EV LIPAR . (q)–(r) ChIP‐qPCR analysis of H3K9ac (q) and p300 (r) enrichment on SELE promoter in HLECs incubating with UM‐UC‐3‐EV LIPA R. (s) qRT‐PCR analysis of SELE expression in UM‐UC‐3‐EV LIPAR treated HLECs with or without inhibiting p300. The statistical difference was assessed by the one‐way ANOVA followed by Dunnett's tests in (a), (f), (i), (k), (p), (s); two‐tailed Student's t‐test in (b), (e), (j), (m), (o), (q), (r); χ2 test in (l). Error bars represent the SD of three independent experiments. ANOVA, analysis of variance; ChIPR, chromatin isolation by RNA purification; HLECs, Human lymphatic endothelial cells; qRT‐PCR, real‐time polymerase chain reaction; SD, standard deviation; SELE, E‐selectin. * p < 0.05, ** p < 0.01.
FIGURE 7
FIGURE 7
ITGA6+EV‐packaged LIPAR induces pre‐metastatic niche to promote LN metastasis. (a) Schematic illustration showing the in vitro production and circularization of LIPAR. (b)–(c) Representative images (b) and quantifications (c) of SELE positive areas in popliteal LNs from the Engineered EV LIPAR educated mice (= 12 per group). Scale bar: 50 µm (black), 50 µm (white). (d) Schematic illustration showing the establishment of Engineered EV‐education experiment model via footpad injection. (e) Representative bioluminescence images and quantification of mice educated with Engineered EV LIPAR or Control EVs or Engineered EVEmpty (= 12 per group). (f) Representative images of the popliteal LNs from mice (= 12 per group). (g) Schematic illustration showing the establishment of Engineered EV‐education experiment model via intravascular injection. (h) Representative images and quantification of LIPAR in pelvic LNs. (= 6 per group). Scale bar: 50 µm. (i) Necropsy examination, MRI and HE image of mouse bladders. Scale bar: 5 µm. (j) Representative IVIS showing the metastatic LNs of mice in indicated groups (= 12 per group). (k) Representative PET‐CT images and pie charts showing the metastatic LNs of mice in indicated groups (= 12 per group). (l) Representative images of anti‐mCherry analysis in pelvic LNs from the indicated group (= 12 per group). Scale bars: 500 µm (black), 50 µm (red). (m) Quantification of the metastatic number of pelvic LNs in mice from indicated groups. (n) Kaplan–Meier curves of the OS in mice from indicated groups. The statistical difference was assessed by the one‐way ANOVA followed by Dunnett's tests in (c), (e), (h), (m). Error bars represent the SD of three independent experiments. ANOVA, analysis of variance; EVs, extracellular vesicles; IVIS, in vivo imaging system; LNs, lymph nodes; MRI, magnetic resonance imaging; H&E, hematoxylin and eosin; OS, overall survival; PET‐CT, positron emission tomography‐computed tomography; SD, standard deviation. * p < 0.05, ** p < 0.01.
FIGURE 8
FIGURE 8
LIPAR triggers BCa‐derived EVs to induce the pre‐metastatic niche for LN metastasis. (a)–(b) Representative bioluminescence images and quantification of LNs from mice (= 12 per group). (c) The popliteal LN metastatic rates of the mice from the indicated group (= 12 per group). (d) Representative MRI images and pie charts showing the metastatic LNs of mice in indicated groups (= 12 per group). (e)–(f) Representative IVIS images and pie charts showing the metastatic LNs of mice in indicated groups (= 12 per group). (g)–(h) Representative images of anti‐mCherry analysis in pelvic LNs from the indicated group (= 12 per group). Scale bars: 500 µm (black), 50 µm (red), 50 µm (white). (i) Representative image of LIPAR and ITGA6 expression in BCa tissue and SELE expression in LYVE‐1 indicated lymphatic vessels in paired non‐metastatic LNs (= 257). Scale bars: 50 µm. (j) Proposed model of BCa‐derived ITGA6+EVs in inducing lymphatic pre‐metastatic niche to promote lymphatic metastasis via delivering LIPAR to HLECs in draining LNs. The statistical difference was by one‐way ANOVA followed by Dunnett's tests in (b), (h); χ2 test in (c). Error bars represent the SD of three independent experiments. ANOVA, analysis of variance; BCa, bladder cancer; EVs, extracellular vesicles; HLECs, Human lymphatic endothelial cells; LNs, lymph nodes; LYVE 1, lymphatic vessel endothelial hyaluronan receptor 1; SD, standard deviation; SELE, E‐selectin. * p < 0.05, ** p < 0.01.

Similar articles

Cited by

References

    1. Almeida, A. , Gabriel, M. , Firlej, V. , Martin‐Jaular, L. , Lejars, M. , Cipolla, R. , Petit, F. , Vogt, N. , San‐Roman, M. , Dingli, F. , Loew, D. , Destouches, D. , Vacherot, F. , de la Taille, A. , Théry, C. , & Morillon, A. (2022). Urinary extracellular vesicles contain mature transcriptome enriched in circular and long noncoding RNAs with functional significance in prostate cancer. Journal of Extracellular Vesicles, 11(5), e12210. 10.1002/jev2.12210 - DOI - PMC - PubMed
    1. Alvarez‐Erviti, L. , Seow, Y. , Yin, H. , Betts, C. , Lakhal, S. , & Wood, M. J. (2011). Delivery of siRNA to the mouse brain by systemic injection of targeted exosomes. Nature Biotechnology, 29(4), 341–345. 10.1038/nbt.1807 - DOI - PubMed
    1. An, M. , Zheng, H. , Huang, J. , Lin, Y. , Luo, Y. , Kong, Y. , Pang, M. , Zhang, D. , Yang, J. , Chen, J. , Li, Y. , Chen, C. , & Lin, T. (2022). Aberrant nuclear export of circNCOR1 underlies SMAD7‐mediated lymph node metastasis of bladder cancer. Cancer Research, 82(12), 2239–2253. 10.1158/0008-5472.CAN-21-4349 - DOI - PMC - PubMed
    1. Bieniasz‐Krzywiec, P. , Martín‐Pérez, R. , Ehling, M. , García‐Caballero, M. , Pinioti, S. , Pretto, S. , Kroes, R. , Aldeni, C. , Di Matteo, M. , Prenen, H. , Tribulatti, M. V. , Campetella, O. , Smeets, A. , Noel, A. , Floris, G. , Van Ginderachter, J. A. , & Mazzone, M. (2019). Podoplanin‐expressing macrophages promote lymphangiogenesis and lymphoinvasion in breast cancer. Cell Metabolism, 30(5), 917–936.e10. 10.1016/j.cmet.2019.07.015 - DOI - PMC - PubMed
    1. Cavalli, V. , Vilbois, F. , Corti, M. , Marcote, M. J. , Tamura, K. , Karin, M. , Arkinstall, S. , & Gruenberg, J. (2001). The stress‐induced MAP kinase p38 regulates endocytic trafficking via the GDI:Rab5 complex. Molecular Cell, 7(2), 421–432. 10.1016/s1097-2765(01)00189-7 - DOI - PubMed

Grants and funding