

Biomechanical Gait Analysis Using a Smartphone-Based Motion Capture System (OpenCap) in Patients with Neurological Disorders
- PMID: 39329653
- PMCID: PMC11429388
- DOI: 10.3390/bioengineering11090911
Biomechanical Gait Analysis Using a Smartphone-Based Motion Capture System (OpenCap) in Patients with Neurological Disorders
Abstract
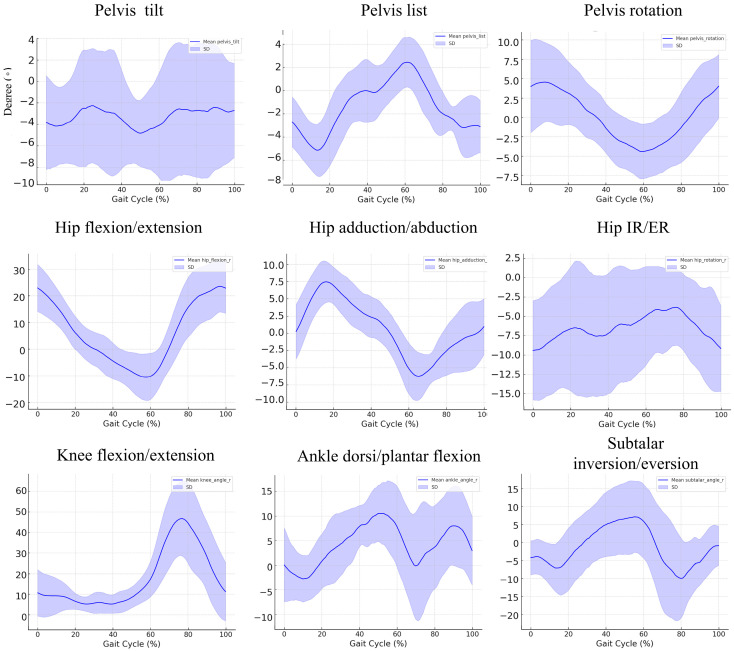
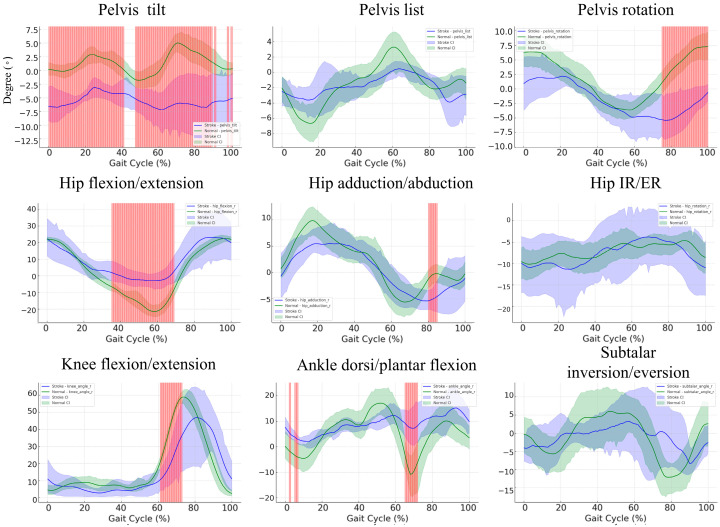
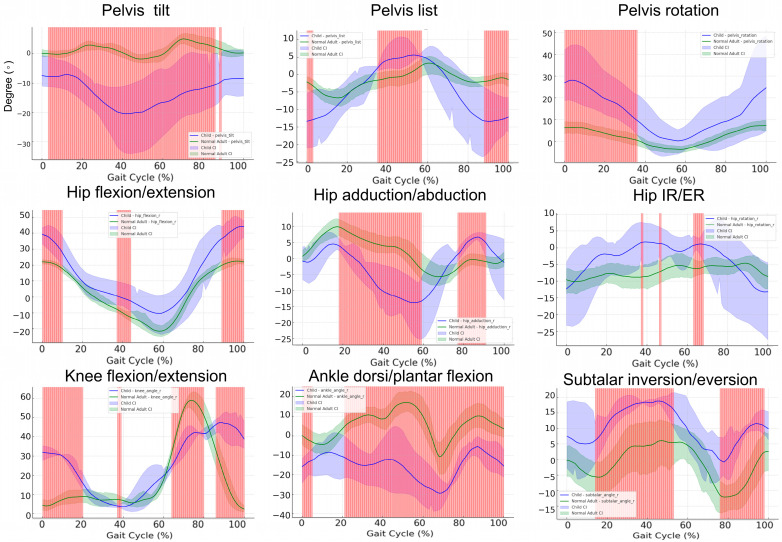
This study evaluates the utility of OpenCap (v0.3), a smartphone-based motion capture system, for performing gait analysis in patients with neurological disorders. We compared kinematic and kinetic gait parameters between 10 healthy controls and 10 patients with neurological conditions, including stroke, Parkinson's disease, and cerebral palsy. OpenCap captured 3D movement dynamics using two smartphones, with data processed through musculoskeletal modeling. The key findings indicate that the patient group exhibited significantly slower gait speeds (0.67 m/s vs. 1.10 m/s, p = 0.002), shorter stride lengths (0.81 m vs. 1.29 m, p = 0.001), and greater step length asymmetry (107.43% vs. 91.23%, p = 0.023) compared to the controls. Joint kinematic analysis revealed increased variability in pelvic tilt, hip flexion, knee extension, and ankle dorsiflexion throughout the gait cycle in patients, indicating impaired motor control and compensatory strategies. These results indicate that OpenCap can effectively identify significant gait differences, which may serve as valuable biomarkers for neurological disorders, thereby enhancing its utility in clinical settings where traditional motion capture systems are impractical. OpenCap has the potential to improve access to biomechanical assessments, thereby enabling better monitoring of gait abnormalities and informing therapeutic interventions for individuals with neurological disorders.
Keywords: gait; kinematics; kinetics; motion capture; smartphone.
Conflict of interest statement
The authors declare no conflicts of interest.
Figures


Similar articles
-
Comparison of kinematics and kinetics between OpenCap and a marker-based motion capture system in cycling.Comput Biol Med. 2025 Jun;192(Pt A):110295. doi: 10.1016/j.compbiomed.2025.110295. Epub 2025 Apr 30. Comput Biol Med. 2025. PMID: 40311466
-
A Step Forward Understanding Directional Limitations in Markerless Smartphone-Based Gait Analysis: A Pilot Study.Sensors (Basel). 2024 May 13;24(10):3091. doi: 10.3390/s24103091. Sensors (Basel). 2024. PMID: 38793945 Free PMC article.
-
OpenCap: Human movement dynamics from smartphone videos.PLoS Comput Biol. 2023 Oct 19;19(10):e1011462. doi: 10.1371/journal.pcbi.1011462. eCollection 2023 Oct. PLoS Comput Biol. 2023. PMID: 37856442 Free PMC article.
-
Juvenile idiopathic arthritis, gait characteristics and relation to function.Gait Posture. 2021 Mar;85:38-54. doi: 10.1016/j.gaitpost.2020.12.010. Epub 2020 Dec 31. Gait Posture. 2021. PMID: 33513531
-
Contributions to the understanding of gait control.Dan Med J. 2014 Apr;61(4):B4823. Dan Med J. 2014. PMID: 24814597 Review.
Cited by
-
Measuring Lower-Limb Kinematics in Walking: Wearable Sensors Achieve Comparable Reliability to Motion Capture Systems and Smartphone Cameras.Sensors (Basel). 2025 May 4;25(9):2899. doi: 10.3390/s25092899. Sensors (Basel). 2025. PMID: 40363335 Free PMC article.
-
Use of Smartphone-Based Experimental Data for the Calibration of Biodynamic Spring-Mass-Damper (SMD) Pedestrian Models.Sensors (Basel). 2025 Feb 24;25(5):1387. doi: 10.3390/s25051387. Sensors (Basel). 2025. PMID: 40096204 Free PMC article.
References
-
- Gage J.R. Gait Analysis in Cerebral Palsy. Cambridge University Press; Cambridge, UK: 1991.
-
- Heinen F., Desloovere K., Schroeder A.S., Berweck S., Borggraefe I., van Campenhout A., Andersen G.L., Aydin R., Becher J.G., Bernert G., et al. The Updated European Consensus 2009 on the Use of Botulinum Toxin for Children with Cerebral Palsy. Eur. J. Paediatr. Neurol. 2010;14:45–66. doi: 10.1016/j.ejpn.2009.09.005. - DOI - PubMed
-
- Shrader W., Shih C., McDonald T. Instrumented Gait Analysis in the Care of Children with Cerebral Palsy: Current Concept Revew. J. Pediatr. Orthop. Soc. N. Am. 2021;3:237. doi: 10.55275/JPOSNA-2021-237. - DOI
-
- Rasmussen H.M., Pedersen N.W., Overgaard S., Hansen L.K., Dunkhase-Heinl U., Petkov Y., Engell V., Baker R., Holsgaard-Larsen A. The Use of Instrumented Gait Analysis for Individually Tailored Interdisciplinary Interventions in Children with Cerebral Palsy: A Randomised Controlled Trial Protocol. BMC Pediatr. 2015;15:202. doi: 10.1186/s12887-015-0520-7. - DOI - PMC - PubMed
-
- Rodrigues T.B., Salgado D.P., Catháin C.Ó., O’Connor N., Murray N. Human Gait Assessment Using a 3D Marker-Less Multimodal Motion Capture System. Multimed. Tools Appl. 2020;79:2629–2651. doi: 10.1007/s11042-019-08275-9. - DOI
Grants and funding
LinkOut - more resources
Full Text Sources
