. 2024 Sep 17;11(9):931.
doi: 10.3390/bioengineering11090931.

Encapsulation of Inositol Hexakisphosphate with Chitosan via Gelation to Facilitate Cellular Delivery and Programmed Cell Death in Human Breast Cancer Cells

Affiliations

Encapsulation of Inositol Hexakisphosphate with Chitosan via Gelation to Facilitate Cellular Delivery and Programmed Cell Death in Human Breast Cancer Cells

Ilham H Kadhim et al. Bioengineering (Basel). .

Abstract

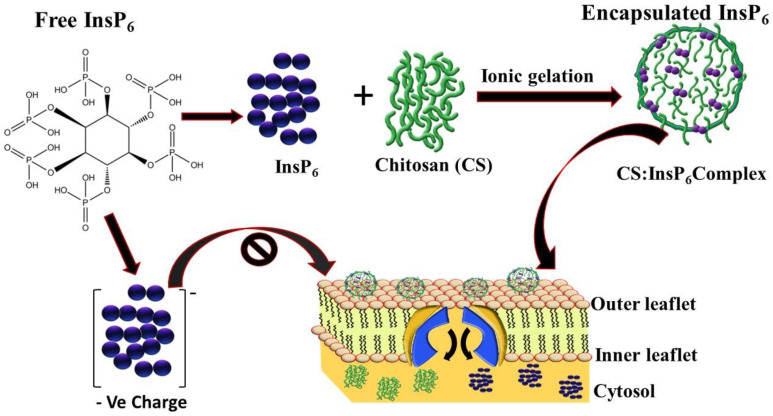
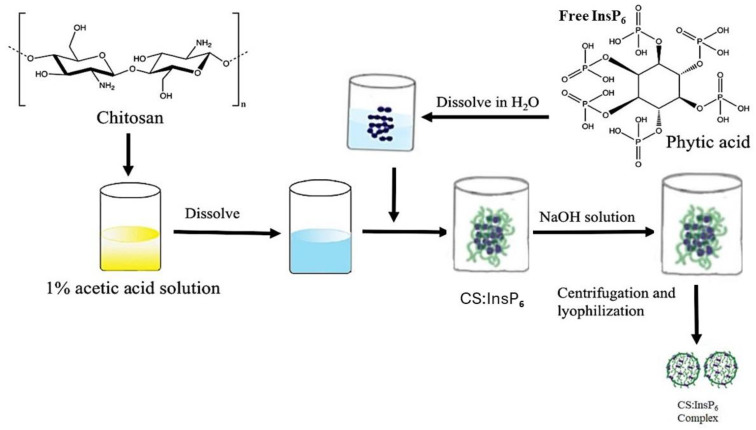
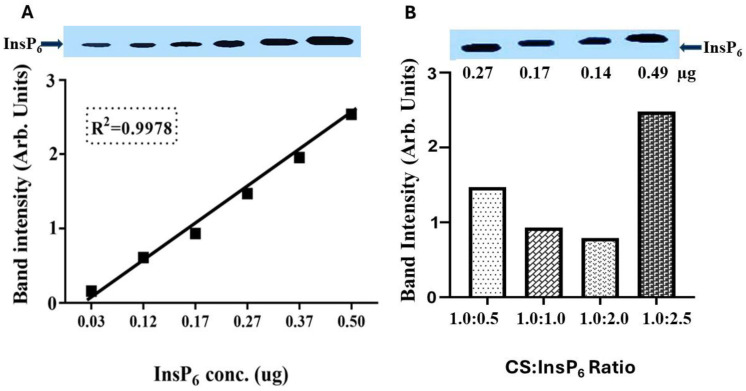
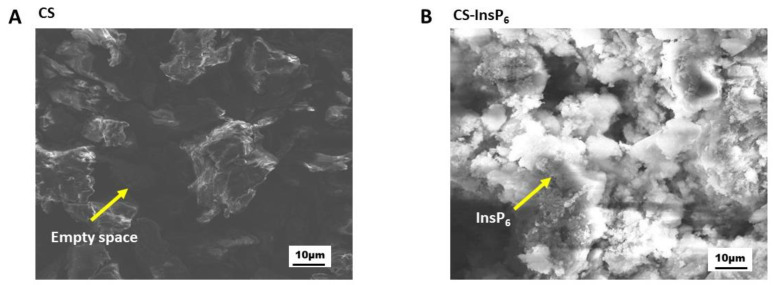
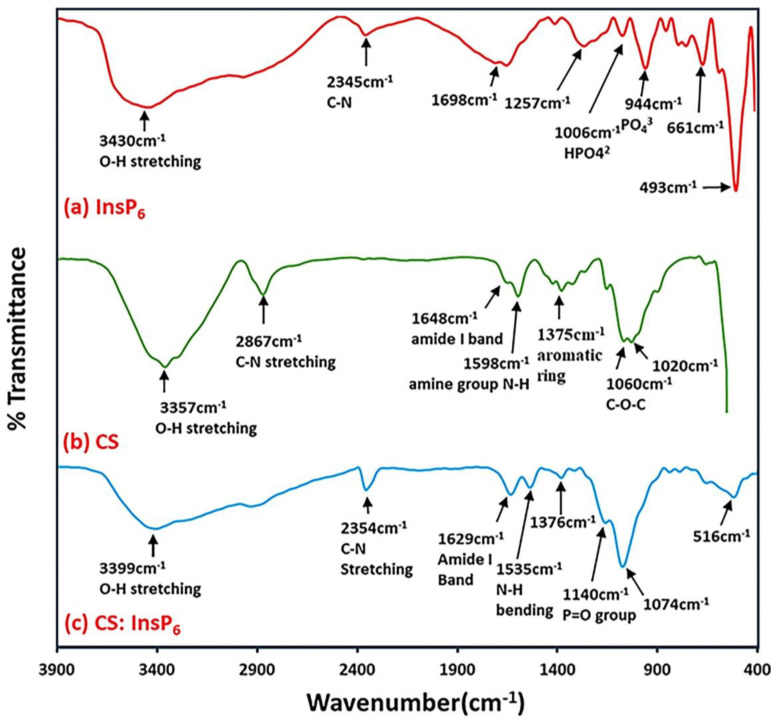
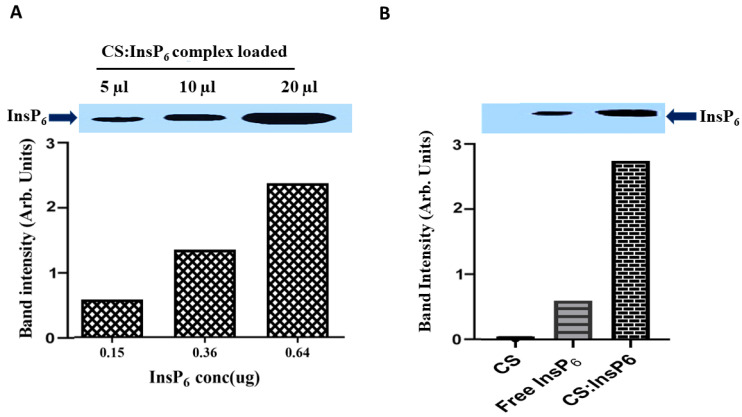
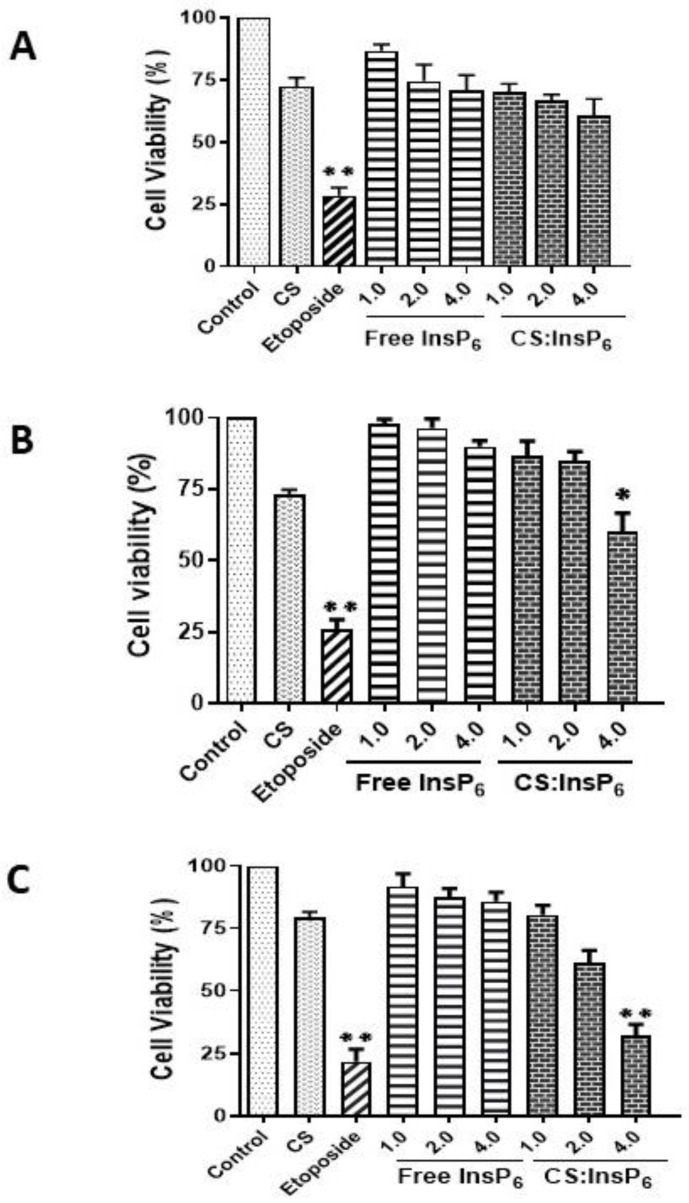
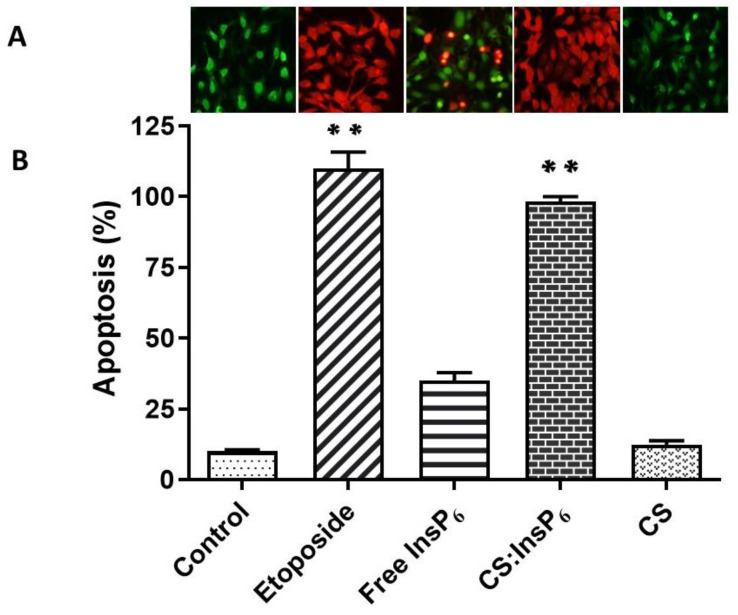
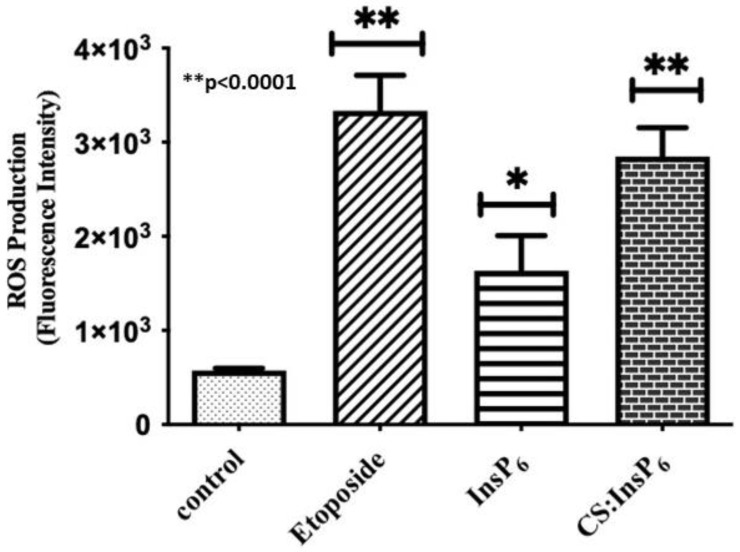
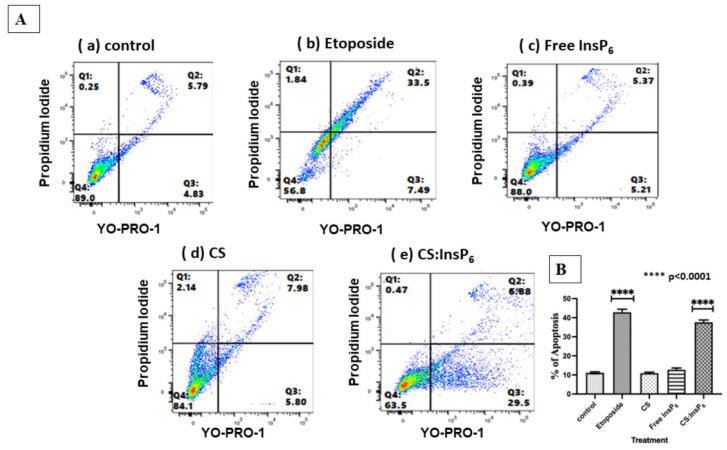
Inositol hexakisphosphate (InsP6) is the most abundant inositol polyphosphate both in plant and animal cells. Exogenous InsP6 is known to inhibit cell proliferation and induce apoptosis in cancerous cells. However, cellular entry of exogenous InsP6 is hindered due to the presence of highly negative charge on this molecule. Therefore, to enhance the cellular delivery of InsP6 in cancerous cells, InsP6 was encapsulated by chitosan (CS), a natural polysaccharide, via the ionic gelation method. Our hypothesis is that encapsulated InsP6 will enter the cell more efficiently to trigger its apoptotic effects. The incorporation of InsP6 into CS was optimized by varying the ratios of the two and confirmed by InsP6 analysis via polyacrylamide gel electrophoresis (PAGE) and atomic absorption spectrophotometry (AAS). The complex was further characterized by Scanning Electron Microscopy (SEM) and Fourier Transform Infrared Spectroscopy (FTIR) for physicochemical changes. The data indicated morphological changes and changes in the spectral properties of the complex upon encapsulation. The encapsulated InsP6 enters human breast cancer MCF-7 cells more efficiently than free InsP6 and triggers apoptosis via a mechanism involving the production of reactive oxygen species (ROS). This work has potential for developing cancer therapeutic applications utilizing natural compounds that are likely to overcome the severe toxic effects associated with synthetic chemotherapeutic drugs.

Keywords: apoptosis; breast cancer; chitosan; cytotoxicity; encapsulation; inositol polyphosphates; reactive oxygen species.


Conflict of interest statement

The authors declare no conflict of interest.

Figures

Figure 1
Figure 1
Schematic depiction of the concept of cellular entry of exogenously administered InsP6 after encapsulation with chitosan by ionic gelation to shield off the negative charge. Note that the encapsulated InsP6 enters the cell through cell membrane, whereas negatively charged free InsP6 is unable to enter the cell membrane.
Figure 2
Figure 2
Schematic illustration of the preparation of the CS:InsP6 nanomaterial complex by ionic gelation. Chitosan dissolved in acetic acid (5.0 mg/mL) and InsP6 dissolved in deionized water (5.0 mg/mL) were mixed in varying proportions and stirred for 30 min followed by pH adjustment. The CS:InsP6 complex was purified by centrifugation and washing with ethanol and lyophilized to dry powder.
Figure 3
Figure 3
Detection of InsP6 contents in the CS:InsP6 complex by PAGE. Optimization of InsP6 incorporation in chitosan was carried out by varying the ratios of CS:InsP6 (B). Standard InsP6 with known concentrations were also run in parallel to establish the linearity of detection (A). Band densities were analyzed by image J software. (B) shows the amounts of InsP6 detected in the samples with various ratios of CS:InsP6 applied on the gel. The maximum amount of InsP6 (0.49 μg) was detected in the sample with a CS:InsP6 ratio of 2.5:1.0. This amount (0.49 μg), when calculated using the dilution factor of the samples loaded on the gel, provides a total incorporation of 49 ug InsP6 per mg CS. Data shown are a representative of at least three independent experiments with similar results. The error bars are not shown as the data shown are from a single experiment repeated at least three times.
Figure 4
Figure 4
SEM images of CS (A) and the CS:InsP6 complex (B). Arrows point to the empty spaces in CS (A) that were perhaps filled by InsP6 (B), showing morphological changes following encapsulation. The CS:InsP6 complex at a ratio of 2.5:1.0 was used for SEM analysis in (B). Electron micrographs shown are representative images seen in replicate experiments with similar results.
Figure 5
Figure 5
FTIR spectra of (a) InsP6, (b) CS, and (c) encapsulated complex with a CS:InsP6 ratio of 2.5:1.0. Note that the spectral properties of the characteristic bands at specific wavenumbers in InsP6 (a) and CS (b) are changed upon encapsulation (c).
Figure 6
Figure 6
Cellular uptake of encapsulated InsP6. Band intensity was analyzed by image J software. (A) shows quantitative detection of InsP6 in the CS:IsP6 complex with a CS:InsP6 ratio of 2.5:1.0. A volume of 5, 10, and 20 µL of the complex loaded on the gel gave 0.15, 0.36, and 0.64 µg InsP6, respectively, showing a concentration-dependent linear increase in the detection of InsP6 in the complex. (B) shows a significant increase in InsP6 uptake by MCF-7 cells using the encapsulated complex with a CS:InsP6 ratio of 2.5:1.0 as compared to corresponding free InsP6 and CS. Data shown are representative of experiments performed independently at least three times with similar results. Statistical analysis is not shown as the data are from a representative experiment.
Figure 7
Figure 7
Dose- and time-dependent induction of cell viability in MCF-7 cells by encapsulated InsP6 treatment. Cell viability was determined at 24 h (A), 48 h (B), and 72 h (C) by MTT assay using the given doses of free InsP6 (1.0–4.0 µM) and equivalent amounts of the CS: InsP6 complex that would give similar doses of free InsP6. Data are shown as means ± SD from three independent experiments. All experimental values were statistically compared with their respective controls to determine any significant differences. Only treatment with 4 µM encapsulated InsP6 gave a significant difference as compared with 4 µM free InsP6. * p value ≤ 0.001 or ** p ≤ 0.0001 show significantly different values as compared to the respective controls.
Figure 8
Figure 8
Effect of encapsulated InsP6 on apoptosis. MCF-7 cells were incubated with 4 µM of encapsulated InsP6 for 72 h to induce apoptosis. Etoposide (100 µM) was used as a positive control. (A) MCF-7 cells were stained with acridine orange/ethidium bromide and visualized under UV light using a fluorescent microscope. (B) The percentage of apoptosis was determined by counting 200–300 live (green) and/or dead (red) cells. Values shown are mean ±SD from three experiments, each performed in triplicate. ** p value ≤ 0.001 as compared to the control.
Figure 9
Figure 9
Effect of encapsulated InsP6 on ROS generation. MCF-7 cells were treated with 4 µM free InsP6 equivalent of the encapsulated CS:InsP6 complex for 72 h in a 96-well microplate. Etoposide (100 µM) was used as a positive control. Cells were then stained with 10 µM DCFH-DA and fluorescence intensity was recorded using a fluorescence microplate reader. Values shown are mean ± SD from three independent experiments, each performed in triplicate. * p value of ≤0.0001 was considered significantly different compared to the control.
Figure 10
Figure 10
Determination of specificity of encapsulated InsP6-induced apoptosis by flow cytometry (A). Apoptosis was measured by using a commercially available Vybrant apoptosis assay kit #4. Live cells - are shown as green in lower left quadrant and apoptotic cells are shown as blue in lower and upper right quadrant. Necrotic cells give a red color which are expected to show up in upper left quadrant. The data shown are representative of an experiment repeated at least three times with similar results. (B) shows statistical analysis results of the flow cytometry data showing mean ± standard deviation (SD) from three independent experiments. The % apoptosis values were obtained by combining early and late apoptosis values from the lower and upper right quadrants, respectively. One-way ANOVA with multiple comparisons was used to determine values that were statistically significant. **** p < 0.0001 was considered statistically significant values compared with their respective controls.

Similar articles

Cited by

References

    1. Berridge M.J., Irvine R.F. Inositol trisphosphate, a novel second messenger in cellular signal transduction. Nature. 1984;312:315–321. doi: 10.1038/312315a0. - DOI - PubMed
    1. Abel K., Anderson R.A., Shears S.B. Phosphatidylinositol and inositol phosphate metabolism. J. Cell Sci. 2001;114:2207–2208. doi: 10.1242/jcs.114.12.2207. - DOI - PubMed
    1. Agarwal R., Mumtaz H., Ali N. Role of inositol polyphosphates in programmed cell death. Mol. Cell. Biochem. 2009;328:155–165. doi: 10.1007/s11010-009-0085-6. - DOI - PubMed
    1. Bizzarri M., Dinicola S., Bevilacqua A., Cucina A. Broad spectrum anticancer activity of myo-inositol and inositol hexakisphosphate. Int. J. Endocrinol. 2016;2016:5616807. doi: 10.1155/2016/5616807. - DOI - PMC - PubMed
    1. Vucenik I. Bioactivity of inositol phosphates. Molecules. 2021;26:5042. doi: 10.3390/molecules26165042. - DOI - PMC - PubMed

LinkOut - more resources