. 2024 Sep 14;13(18):1551.
doi: 10.3390/cells13181551.

A Novel Non-Invasive Murine Model of Neonatal Hypoxic-Ischemic Encephalopathy Demonstrates Developmental Delay and Motor Deficits with Activation of Inflammatory Pathways in Monocytes

Affiliations

A Novel Non-Invasive Murine Model of Neonatal Hypoxic-Ischemic Encephalopathy Demonstrates Developmental Delay and Motor Deficits with Activation of Inflammatory Pathways in Monocytes

Elise A Lemanski et al. Cells. .

Abstract

Neonatal hypoxic-ischemic encephalopathy (HIE) occurs in 1.5 per 1000 live births, leaving affected children with long-term motor and cognitive deficits. Few animal models of HIE incorporate maternal immune activation (MIA) despite the significant risk MIA poses to HIE incidence and diagnosis. Our non-invasive model of HIE pairs late gestation MIA with postnatal hypoxia. HIE pups exhibited a trend toward smaller overall brain size and delays in the ontogeny of several developmental milestones. In adulthood, HIE animals had reduced strength and gait deficits, but no difference in speed. Surprisingly, HIE animals performed better on the rotarod, an assessment of motor coordination. There was significant upregulation of inflammatory genes in microglia 24 h after hypoxia. Single-cell RNA sequencing (scRNAseq) revealed two microglia subclusters of interest following HIE. Pseudobulk analysis revealed increased microglia motility gene expression and upregulation of epigenetic machinery and neurodevelopmental genes in macrophages following HIE. No sex differences were found in any measures. These results support a two-hit noninvasive model pairing MIA and hypoxia as a model for HIE in humans. This model results in a milder phenotype compared to established HIE models; however, HIE is a clinically heterogeneous injury resulting in a variety of outcomes in humans. The pathways identified in our model of HIE may reveal novel targets for therapy for neonates with HIE.

Keywords: development; hypoxic-ischemic encephalopathy; macrophages; maternal immune activation; microglia; motor.


Conflict of interest statement

The authors declare no conflicts of interest.

Figures
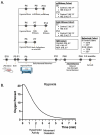
Figure 1
Figure 1
Two-hit HIE model: (A) A representation of our two-hit model of HIE and experimental design. (B) Representative graph of oxygen levels present and pup behavior during the 8 min hypoxia protocol (n = 3 litters).
Figure 2
Figure 2
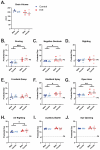
HIE results in a trend toward smaller brains 24 h after injury, and motor developmental delays in the neonatal period: (A) Whole-brain volume obtained on P7 through ex vivo MRI for control animals, and two-hit HIE animals. Analyzed with two-way ANOVA (n = 4 control male, 4 control female; 4 HIE male, 4 HIE female). (BJ) Date of acquisition for neonatal developmental behaviors is shown for the average values for males and females in each litter. (n = 6 control male, 6 control female; 4 HIE male, 5 HIE female). The dashed line indicates P6, the day of hypoxia exposure. Developmental behaviors were analyzed with a two-way ANOVA. * p < 0.05; ** p < 0.01, *** p < 0.001.
Figure 3
Figure 3
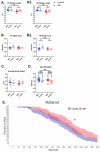
HIE results in distal muscle weakness and gait disturbances in adulthood: (A) forepaw (FP) and (A2) hindpaw (HP) stride lengths measured by the catwalk ~P105 (two-way ANOVA). (B) Forepaw and (B2) hindpaw swing time measured by the catwalk (two-way ANOVA). (C) Average body speed on the catwalk. (catwalk n = 13 control male, 11 control female; HIE = 10 control male, 10 control female, two-way ANOVA) (D) Forepaw strength measured by a grip strength meter on ~P60 (n = 22 control male, 24 control female; 12 HIE male, 20 HIE female, two-way ANOVA). (E) Survival curve showing the proportion of animals still on the rotating rod across time using a Cox mixed-effects model on ~P61. Males and females are collapsed on this graph due to visibility considerations (n = 22 control male, 24 control female; 12 HIE male, 20 HIE female, Cox mixed-effects model). * p < 0.05, ** p < 0.01, **** p < 0.0001.
Figure 4
Figure 4
HIE results in acute transcriptional changes within microglia: (A) Genes identified by both DESeq2 and edgeR with an FDR adjusted p-value < 0.05 within CD11b+ cells on P7, one-day post hypoxia (n = 2 control male, 2 control female, 4 HIE male). (B) Gene set enrichment plots of significantly upregulated proinflammatory gene sets within HIE microglia. (C) Gene set enrichment plots of significantly proliferation-related gene sets within HIE microglia. (D) Gene set enrichment plots of significantly upregulated damage checkpoint/apoptosis gene sets within HIE microglia.
Figure 5
Figure 5
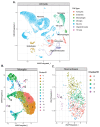
No unique subclusters emerge following HIE. ScRNAseq data from P8 and P10 combined (n = 6 control P8, 6 HIE P8, 6 control P10, 6 HIE P10): (A) Representative UMAP of all cell types identified by scRNA-Seq. (B) Representative UMAP of identified microglia subclusters. (C) Representative UMAP of identified macrophage subclusters.
Figure 6
Figure 6
Microglia subclusters 7 and 12 emerge as clusters of interest following HIE in scRNAseq analysis: (A) Pathway enrichment analysis of microglia subcluster 7. (B) Pathway enrichment analysis of microglia subcluster 12. (n = 6 control P8, 6 HIE P8, 6 control P10, 6 HIE P10). (GO:BP, GOCC, GO:MF: Gene Ontology Biological Processes, Cellular Components, Molecular Functions, respectively; KEGG: KEGG PATHWAY Database; REAC: Reactome Pathway Database).
Figure 7
Figure 7
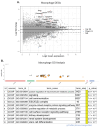
Microglia have significant transcriptional changes following HIE: (A) MA plot of the differentially expressed genes in microglia (P8 and P10). (B) Plot of the significantly different functional pathways in microglia. (n = 6 control P8, 6 HIE P8, 6 control P10, 6 HIE P10).
Figure 8
Figure 8
Macrophages have significant transcriptional changes following HIE: (A) Volcano plot of the differentially expressed genes in macrophages (P8 and P10). (B) Plot of the significantly different pathways in macrophages. (n = 6 control P8, 6 HIE P8, 6 control P10, 6 HIE P10).

References

    1. Kurinczuk J.J., White-Koning M., Badawi N. Epidemiology of neonatal encephalopathy and hypoxic-ischaemic encephalopathy. Early Hum. Dev. 2010;86:329–338. doi: 10.1016/j.earlhumdev.2010.05.010. - DOI - PubMed
    1. Namusoke H., Nannyonga M.M., Ssebunya R., Nakibuuka V.K., Mworozi E. Incidence and short term outcomes of neonates with hypoxic ischemic encephalopathy in a Peri Urban teaching hospital, Uganda: A prospective cohort study. Matern. Health Neonatol. Perinatol. 2018;4:6. doi: 10.1186/s40748-018-0074-4. - DOI - PMC - PubMed
    1. Evans K., Rigby A.S., Hamilton P., Titchiner N., Hall D.M. The relationships between neonatal encephalopathy and cerebral palsy: A cohort study. J. Obstet. Gynaecol. 2001;21:114–120. doi: 10.1080/01443610020025967. - DOI - PubMed
    1. Byrne H., Spencer A.P.C., Geary G., Jary S., Thoresen M., Cowan F.M., Brooks J.C.W., Chakkarapani E. Development of the corpus callosum and cognition after neonatal encephalopathy. Ann. Clin. Transl. Neurol. 2023;10:32–47. doi: 10.1002/acn3.51696. - DOI - PMC - PubMed
    1. Davidson J.O., Wassink G., van den Heuij L.G., Bennet L., Gunn A.J. Therapeutic Hypothermia for Neonatal Hypoxic-Ischemic Encephalopathy—Where to from Here? Front. Neurol. 2015;6:198. doi: 10.3389/fneur.2015.00198. - DOI - PMC - PubMed

Publication types

LinkOut - more resources