Comparative Study
. 2024 Sep 18;13(18):1569.
doi: 10.3390/cells13181569.

Comparative Analysis of Inhibitory and Activating Immune Checkpoints PD-1, PD-L1, CD28, and CD86 in Non-Melanoma Skin Cancer

Affiliations
Comparative Study

Comparative Analysis of Inhibitory and Activating Immune Checkpoints PD-1, PD-L1, CD28, and CD86 in Non-Melanoma Skin Cancer

Linus Winter et al. Cells. .

Abstract

The establishment of immunotherapy applying immune checkpoint inhibitors (ICI) has provided an important new option for the treatment of solid malignant diseases. However, different tumor entities show dramatically different responses to this therapy. BCC responds worse to anti-PD-1 ICIs as compared to cSCC. Differential immune checkpoint expression could explain this discrepancy and, therefore, the aim of this study was to analyze activating and inhibitory immune checkpoints in cSCC and BCC tissues. Tissue microarrays of the invasive front as well as the tumor core of BCC and cSCC samples were used to evaluate PD-1, PD-L1, CD28, and CD86 expression and their topographic distribution profiles by chromogenic immunohistochemistry. QuPath was used to determine the labeling index. The expression of PD-1, PD-L1, and CD28 was significantly higher in both the tumor core and the invasive front of cSCC samples as compared to BCC (p < 0.001). In addition, the ratios of PD-L1/CD86 (p < 0.001) and CD28/CD86 (p < 0.001) were significantly higher in cSCC. The invasive front of both tumor entities showed higher expression levels of all immune markers compared to the tumor core in both tumor entities. The significantly higher expression of PD-1, PD-L1, and CD28 in cSCC, along with the predominance of the inhibitory ligand PD-L1 as compared to the activating CD86 in cSCC, provide a potential explanation for the better objective response rates to anti-PD-1 immunotherapy as compared to BCC. Furthermore, the predominant site of interaction between the immune system and the tumor was within the invasive front in both tumor types.

Keywords: BCC; CD28; CD86; IHC; NMSC; PD-1; PD-L1; TMA; TME; cSCC.


Conflict of interest statement

The authors declare no conflicts of interest.

Figures
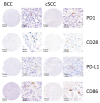
Figure 1
Figure 1
Representative TMA cores of PD-1, CD28, PD-L1, and CD86 for basal cell carcinoma (BCC) and cutaneous squamous cell carcinoma (cSCC) are shown to showcase the different IHC stainings with hematoxylin and DAB signal.
Figure 2
Figure 2
Representation of TMA core tissue segmentation. (a) Sample tissue microarray (TMA) core of basal cell carcinoma. (b) Colored tissue segmentation overlaying the TMA core. Tissue was separated into tumor and stromal tissue as displayed.
Figure 3
Figure 3
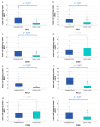
Ratios of PD-1/PD-L1, CD28/CD86, PD-1/CD28, and PD-L1/CD86 in BCC and cSCC by total cell labeling indices. Box plots show ratios of PD-1/PD-L1, CD28/CD86, PD-1/CD28, and PD-L1/CD86 in basal cell carcinoma (BCC) and cutaneous squamous cell carcinoma (cSCC). (a,b) Box plots represent the ratio of PD-1-expressing cells to PD-L1-expressing cells with respect to the invasive front and the tumor core, respectively. (c,d) Boxplots represent ratios of CD28-expressing cells to CD86-expressing cells with respect to the invasive front and the tumor core, respectively. (e,f) Boxplots represent ratios of PD-1-expressing cells to CD28-expressing cells with respect to the invasive front and the tumor core, respectively. (g,h) Boxplots represent ratios of PD-L1-expressing cells to CD86-expressing cells with respect to the invasive front and the tumor core, respectively. p values were calculated using the Mann–Whitney U test. * represent extreme outliers.
Figure 4
Figure 4
Comparison of expression patterns in the invasive front and tumor core of PD-1, CD28, PD-L1, and CD86 in BCC and cSCC by total cell labeling indices. Box plots show a comparison of marker expression in the invasive front versus the tumor core of PD-1, CD28, PD-L1, and CD86 in basal cell carcinoma (BCC) and cutaneous squamous cell carcinoma (cSCC) (ah). The tumor core is composed of mostly epithelial tissue with some stromal tissue, whereas the invasive front represents the transition zone from tumor to stromal tissue. Total cell labeling indices include cell counts of both tumor epithelial and stromal cells within the invasive front or tumor core. p values were calculated using the Mann–Whitney U test. * represent extreme outliers.
Figure 5
Figure 5
Simple scatter plot of BCC/cSCC tumor core PD-1/CD28 and PD-1/CD86 by total cell labeling indices. (a) Scatter plot of basal cell carcinoma (BCC) with fit line of PD-1 by CD28 total cell labeling indices. Correlation coefficient ρ = 0.268, p = 0.038. (b) Scatter plot of squamous cell carcinoma (cSCC) with fit line of PD-1 by CD28 labeling indices. Spearman correlation coefficient ρ = 0.472, p = 0.001. (c) Scatter plot of basal cell carcinoma (BCC) with fit line of PD-1 by CD86 total cell labeling indices. Correlation coefficient ρ = 0.636, p < 0.001. (d) Scatter plot of squamous cell carcinoma (cSCC) with fit line of PD-1 by CD86 total cell labeling indices. Spearman correlation coefficient ρ = 0.250, p = 0.026.

References

    1. Bray F., Ferlay J., Soerjomataram I., Siegel R.L., Torre L.A., Jemal A. Global cancer statistics 2018: GLOBOCAN estimates of incidence and mortality worldwide for 36 cancers in 185 countries. CA Cancer J. Clin. 2018;68:394–424. doi: 10.3322/caac.21492. - DOI - PubMed
    1. Siegel R.L., Miller K.D., Fuchs H.E., Jemal A. Cancer statistics, 2022. CA A Cancer J. Clin. 2022;72:7–33. doi: 10.3322/caac.21708. - DOI - PubMed
    1. Katalinic A., Kunze U., Schäfer T. Epidemiology of cutaneous melanoma and non-melanoma skin cancer in Schleswig-Holstein, Germany: Incidence, clinical subtypes, tumour stages and localization (epidemiology of skin cancer) Br. J. Dermatol. 2003;149:1200–1206. doi: 10.1111/j.1365-2133.2003.05554.x. - DOI - PubMed
    1. Ciazynska M., Kaminska-Winciorek G., Lange D., Lewandowski B., Reich A., Slawinska M., Pabianek M., Szczepaniak K., Hankiewicz A., Ulanska M., et al. Author Correction: The incidence and clinical analysis of non-melanoma skin cancer. Sci. Rep. 2021;11:15705. doi: 10.1038/s41598-021-94435-7. - DOI - PMC - PubMed
    1. Didona D., Paolino G., Bottoni U., Cantisani C. Non Melanoma Skin Cancer Pathogenesis Overview. Biomedicines. 2018;6:6. doi: 10.3390/biomedicines6010006. - DOI - PMC - PubMed

Publication types

LinkOut - more resources