. 2024 Aug 23;14(9):409.
doi: 10.3390/bios14090409.

Polarized and Evanescent Guided Wave Surface-Enhanced Raman Spectroscopy of Ligand Interactions on a Plasmonic Nanoparticle Optical Chemical Bench

Affiliations

Polarized and Evanescent Guided Wave Surface-Enhanced Raman Spectroscopy of Ligand Interactions on a Plasmonic Nanoparticle Optical Chemical Bench

Xining Chen et al. Biosensors (Basel). .

Abstract

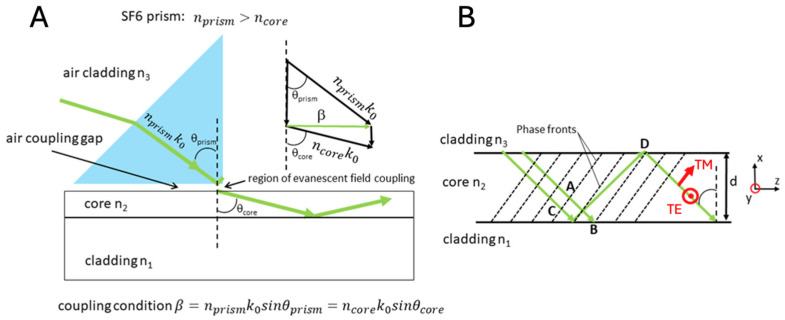
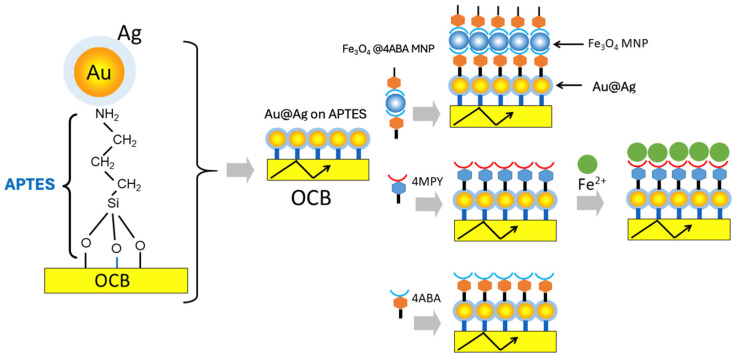
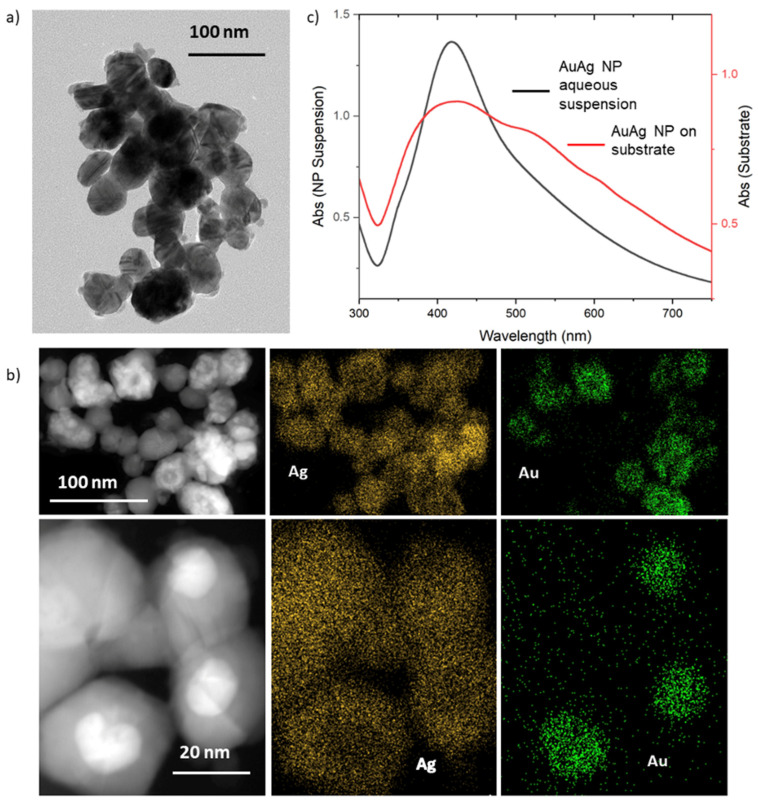
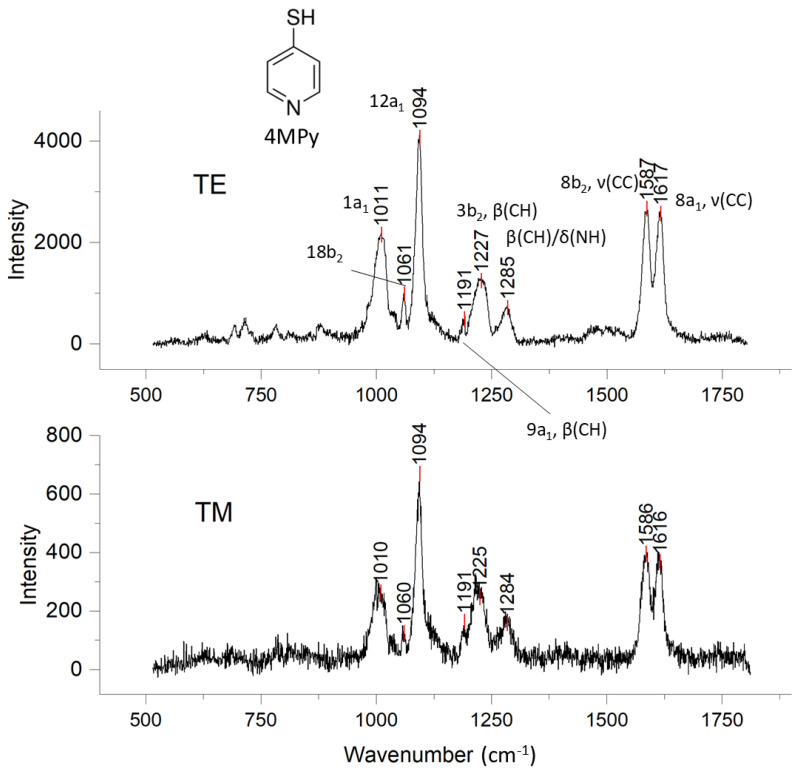
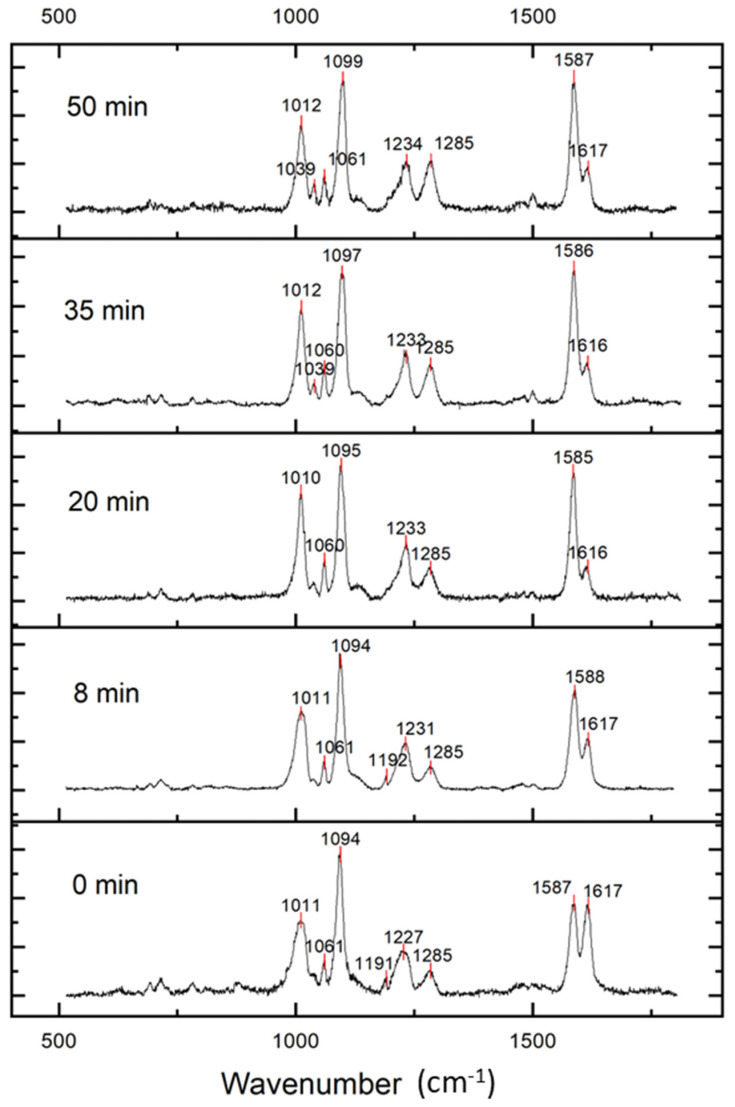
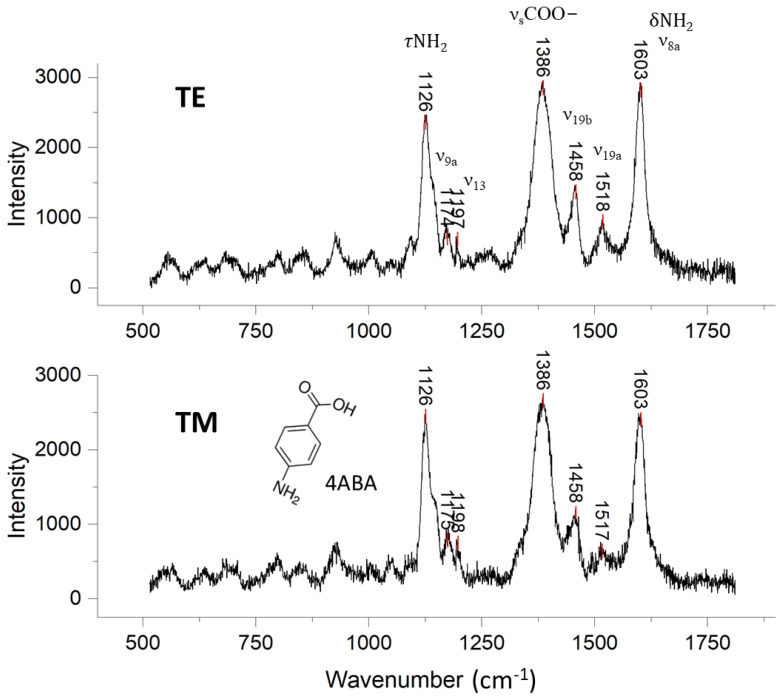
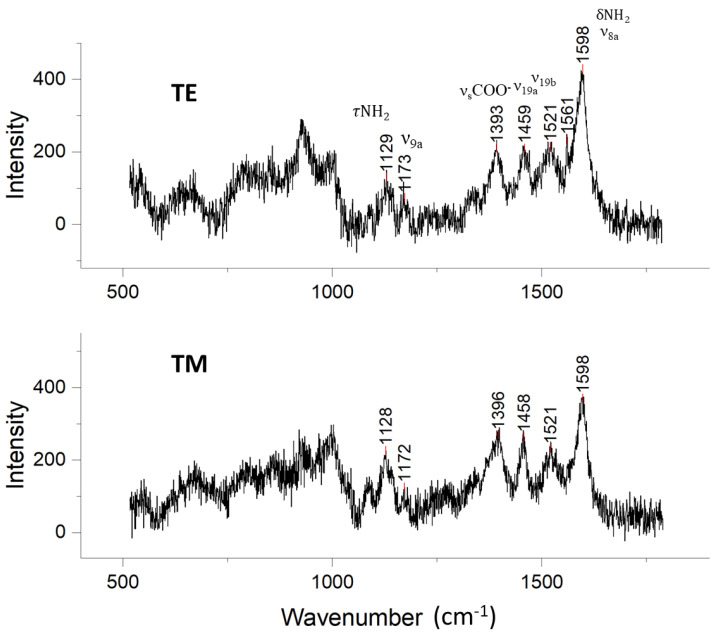
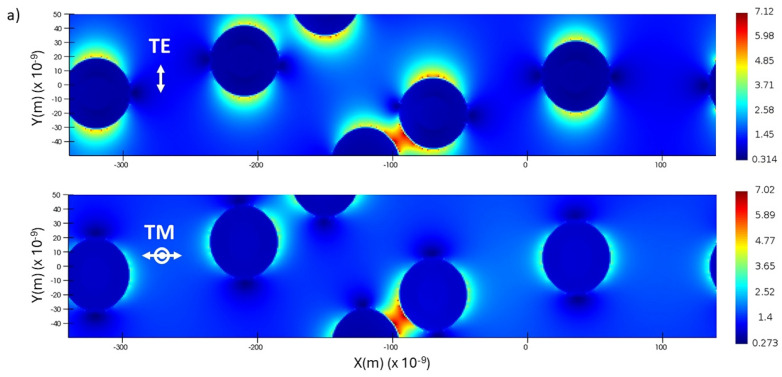
This study examined applications of polarized evanescent guided wave surface-enhanced Raman spectroscopy to determine the binding and orientation of small molecules and ligand-modified nanoparticles, and the relevance of this technique to lab-on-a-chip, surface plasmon polariton and other types of field enhancement techniques relevant to Raman biosensing. A simplified tutorial on guided-wave Raman spectroscopy is provided that introduces the notion of plasmonic nanoparticle field enhancements to magnify the otherwise weak TE- and TM-polarized evanescent fields for Raman scattering on a simple plasmonic nanoparticle slab waveguide substrate. The waveguide construct is called an optical chemical bench (OCB) to emphasize its adaptability to different kinds of surface chemistries that can be envisaged to prepare optical biosensors. The OCB forms a complete spectroscopy platform when integrated into a custom-built Raman spectrograph. Plasmonic enhancement of the evanescent field is achieved by attaching porous carpets of Au@Ag core shell nanoparticles to the surface of a multi-mode glass waveguide substrate. We calibrated the OCB by establishing the dependence of SER spectra of adsorbed 4-mercaptopyridine and 4-aminobenzoic acid on the TE/TM polarization state of the evanescent field. We contrasted the OCB construct with more elaborate photonic chip devices that also benefit from enhanced evanescent fields, but without the use of plasmonics. We assemble hierarchies of matter to show that the OCB can resolve the binding of Fe2+ ions from water at the nanoscale interface of the OCB by following the changes in the SER spectra of 4MPy as it coordinates the cation. A brief introduction to magnetoplasmonics sets the stage for a study that resolves the 4ABA ligand interface between guest magnetite nanoparticles adsorbed onto host plasmonic Au@Ag nanoparticles bound to the OCB. In some cases, the evanescent wave TM polarization was strongly attenuated, most likely due to damping by inertial charge carriers that favor optical loss for this polarization state in the presence of dense assemblies of plasmonic nanoparticles. The OCB offers an approach that provides vibrational and orientational information for (bio)sensing at interfaces that may supplement the information content of evanescent wave methods that rely on perturbations in the refractive index in the region of the evanescent wave.

Keywords: evanescent guided-wave SERS; guided-wave Raman spectroscopy; magnetoplasmonic; optical biosensor; optical chemical bench (OCB); optical chip; plasmonic waveguides; surface-enhanced Raman spectroscopy (SERS).


Conflict of interest statement

The authors declare no conflict of interest.

Figures

Figure 1
Figure 1
For illustrative purposes, the diagram shows the green arrow ray optics approximation to describe mode and polarization-selected guided wave propagation in a 3-layer dielectric slab waveguide. (A) The prism (blue) exhibits a nanoscale coupling gap where the evanescent tail of the ray nprismk0 is phase-matched to an eigenmode of the waveguide, meaning that the input optical energy can be transferred from the prism to a wave with a specific nodal structure, field amplitude, and polarization in the film. Note that the refractive index of the core exceeds that of the substrate and the cladding. The inset shows the “vector triangle” that is used to construct and define the propagation constant, β. (B) Diagram of the ray optics approximation and coordinate system used to establish the phase fronts (dotted lines) and the orthogonal TE and TM polarizations of the waveguide. While the phase fronts are shown to move between points A and B, they belong to the same plane wave. In the approximation, the ray AB experiences no reflection. Note the longer ray CD. It belongs to the reflected wave. It has experienced two internal reflections while traveling through the phase front at A to the phase front at B. Since all points on the same phase front of the plane wave must be in phase, the optical path length of the ray AB can differ from that of the ray CD only by a multiple of 2π.
Figure 2
Figure 2
Hierarchies of multilayers of PNPs and molecules on a slab waveguide optical chemical bench (OCB). 3-aminopropyl triethoxysilane (APTES) grafted to the glass waveguide surface is used as a molecular adhesive to bind Au@Ag core–shell nanoparticles. This OCB is further modified by binding magnetite nanoparticles (MNPs) derivatized with 4-aminobenzoic acid (4ABA) to the plasmonic Au@Ag nanoparticles (top center diagram). Alternatively, 4-mercaptopyridine is ligated to the Au@Ag nanoparticles (middle center diagram). The 4MPy ligands can recognize and bind Fe2+ or 4-aminobenzoic acid can bind to the Au@Ag nanoparticles (bottom center diagram). The yellow rectangles in the figure indicates waveguides for light propagation. The black arrows within the yellow rectangles indicate propagating light waves.
Figure 3
Figure 3
(a) Bright-field TEM image of the Au@Ag NPs; (b) dark-field TEM images and EDX elemental analysis of Au and Ag components of the Au@Ag and alloy NPs. Gold color indicates Ag, green color indicates Au; (c) UV–Vis extinction spectra of Au@Ag NPs suspended in water and after immobilization on a glass substrate.
Figure 4
Figure 4
TE and TM SER spectra of 4MPy adsorbed on Au@Ag NPs on an OCB waveguide.
Figure 5
Figure 5
Guided-wave TE-polarized SER spectra of 4MPy molecules adsorbed on the Au@Ag OCB prior to and after different times of exposure to Fe2+ solution.
Figure 6
Figure 6
TE and TM SER spectra of 4ABA molecules adsorbed on the Au@Ag OCB.
Figure 7
Figure 7
TE and TM SER spectra of 4ABA-functionalized MNPs deposited on Au@Ag PNPs on the OCB.
Figure 8
Figure 8
(a) FDTD electric field simulations of Au@Ag core–shell particles. The particle dimensions and positions were mapped directly from high-resolution SEM images of the real waveguide (see Figure S3 for details). The color bar on the right indicates the maximum and minimum electric field intensities corresponding to either TE or TM polarization. The vertical axis in each simulation is y, and the horizontal axis is x. The double-headed arrow (TE) indicates oscillations in the plane. The arrow and dot (TM) indicate oscillations orthogonal to the plane of the waveguide. (b) Prism coupling assemblies and still images of propagating guided-waves for polarized TE and TM multimode excitation. The pressure bar controls the coupling gap between the bottom of the prism and the waveguide surface. Incoming light incident at the prism hypotenuse face (white spot) is refracted to the bottom back edge of the prism where it excites closely spaced eigenmodes of the waveguide. The 532 nm guided wave is resonant with the red end of the extinction spectrum of the plasmonic nanoparticles (Figure 3a,c). Extinction accounts for the attenuation of the beam as it propagates. Note that the TM wave is more strongly attenuated than the TE wave (see text for details). A visual manifestation of the greater damping of the TM polarization can be seen in (b) which shows the shorter propagation distance of the 532 nm guided wave when the polarization is switched from TE to TM.
Figure 8
Figure 8
(a) FDTD electric field simulations of Au@Ag core–shell particles. The particle dimensions and positions were mapped directly from high-resolution SEM images of the real waveguide (see Figure S3 for details). The color bar on the right indicates the maximum and minimum electric field intensities corresponding to either TE or TM polarization. The vertical axis in each simulation is y, and the horizontal axis is x. The double-headed arrow (TE) indicates oscillations in the plane. The arrow and dot (TM) indicate oscillations orthogonal to the plane of the waveguide. (b) Prism coupling assemblies and still images of propagating guided-waves for polarized TE and TM multimode excitation. The pressure bar controls the coupling gap between the bottom of the prism and the waveguide surface. Incoming light incident at the prism hypotenuse face (white spot) is refracted to the bottom back edge of the prism where it excites closely spaced eigenmodes of the waveguide. The 532 nm guided wave is resonant with the red end of the extinction spectrum of the plasmonic nanoparticles (Figure 3a,c). Extinction accounts for the attenuation of the beam as it propagates. Note that the TM wave is more strongly attenuated than the TE wave (see text for details). A visual manifestation of the greater damping of the TM polarization can be seen in (b) which shows the shorter propagation distance of the 532 nm guided wave when the polarization is switched from TE to TM.

Similar articles

References

    1. Zhang Y., Zhang R., Jiang S., Zhang Y., Dong Z.-C. Probing Adsorption Configurations of Small Molecules on Surfaces by Single-Molecule Tip-Enhanced Raman Spectroscopy. Chem. Phys. Chem. 2019;20:37–41. doi: 10.1002/cphc.201800861. - DOI - PubMed
    1. Bilal M., Asgher M., Cheng H., Yan Y., Iqbal H.M.N. Multi-point enzyme immobilization, surface chemistry, and novel platforms: A paradigm shift in biocatalyst design. Crit. Rev. Biotechnol. 2019;39:202–219. doi: 10.1080/07388551.2018.1531822. - DOI - PubMed
    1. Shen M., Rusling J.F., Dixit C.K. Site-selective orientated immobilization of antibodies and conjugates for immunodiagnostics development. Methods. 2017;116:95–111. doi: 10.1016/j.ymeth.2016.11.010. - DOI - PMC - PubMed
    1. Coluccio M.L., Grillo F., Onesto V., Garo V., Scala C., Cuzzola P., Calfa M., Candeloro P., Gentile F., Piletsky S., et al. Enhancing Antibodies’ Binding Capacity through Oriented Functionalization of Plasmonic Surfaces. Nanomaterials. 2021;11:2620. doi: 10.3390/nano11102620. - DOI - PMC - PubMed
    1. Oliverio M., Perotto S., Messina G.C., Lovato L., De Angelis F. Chemical Functionalization of Plasmonic Surface Biosensors: A Tutorial Review on Issues, Strategies, and Costs. ACS Appl. Mater. Interfaces. 2017;9:29394–29411. doi: 10.1021/acsami.7b01583. - DOI - PMC - PubMed

LinkOut - more resources