. 2024 Sep 9;14(9):437.
doi: 10.3390/bios14090437.

Investigation of a Camera-Based Contactless Pulse Oximeter with Time-Division Multiplex Illumination Applied on Piglets for Neonatological Applications

Affiliations

Investigation of a Camera-Based Contactless Pulse Oximeter with Time-Division Multiplex Illumination Applied on Piglets for Neonatological Applications

René Thull et al. Biosensors (Basel). .

Abstract

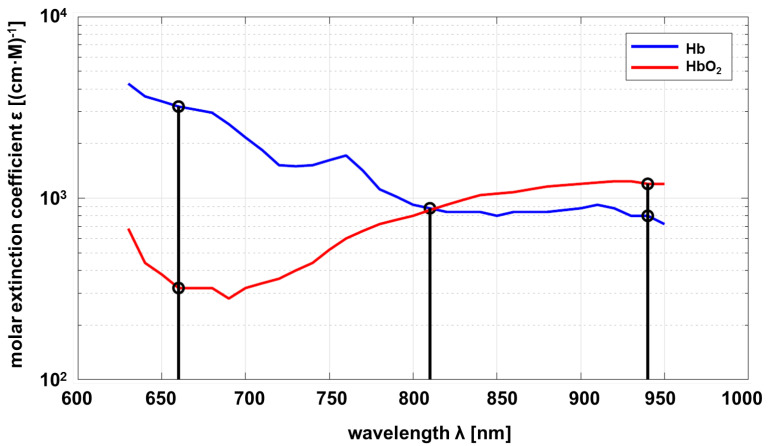
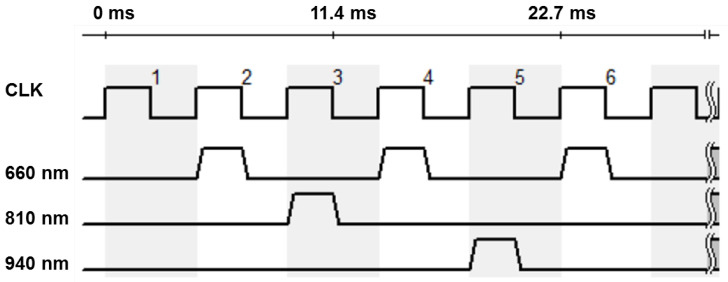
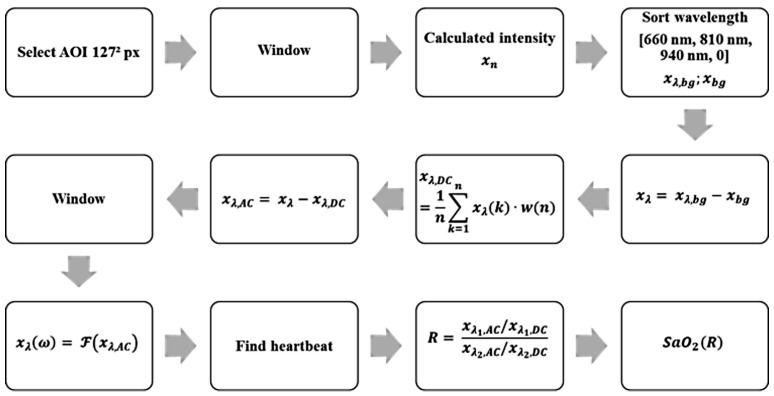
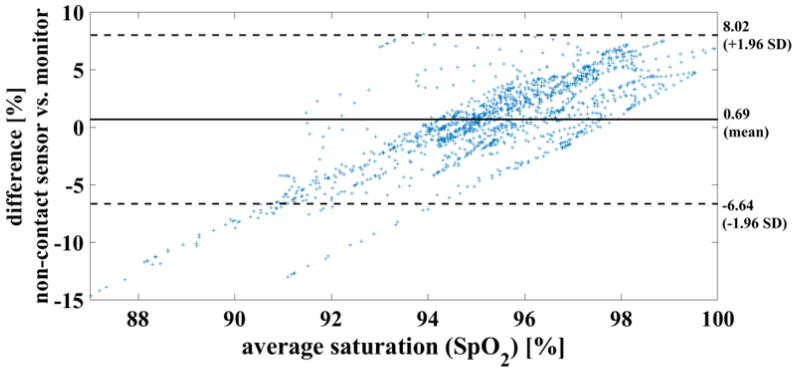
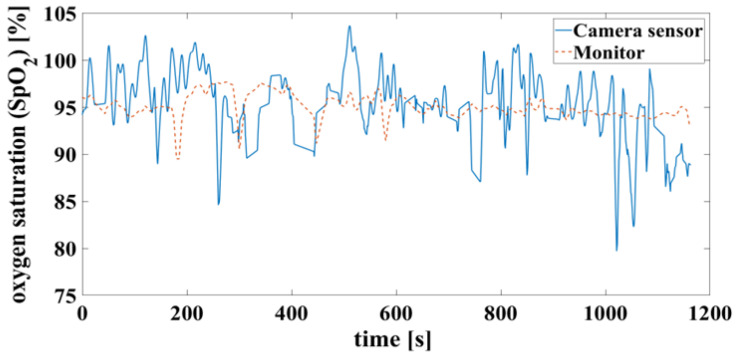
(1) Objective: This study aims to lay a foundation for noncontact intensive care monitoring of premature babies. (2) Methods: Arterial oxygen saturation and heart rate were measured using a monochrome camera and time-division multiplex controlled lighting at three different wavelengths (660 nm, 810 nm and 940 nm) on a piglet model. (3) Results: Using this camera system and our newly designed algorithm for further analysis, the detection of a heartbeat and the calculation of oxygen saturation were evaluated. In motionless individuals, heartbeat and respiration were separated clearly during light breathing and with only minor intervention. In this case, the mean difference between noncontact and contact saturation measurements was 0.7% (RMSE = 3.8%, MAE = 2.93%). (4) Conclusions: The new sensor was proven effective under ideal animal experimental conditions. The results allow a systematic improvement for the further development of contactless vital sign monitoring systems. The results presented here are a major step towards the development of an incubator with noncontact sensor systems for use in the neonatal intensive care unit.

Keywords: biomedical monitoring; biomedical signal processing; image sensors; in vivo; neonatology; nonlinear dynamical systems; optical sensors.


Conflict of interest statement

The authors declare no conflicts of interest.

Figures

Figure 1
Figure 1
Molar absorption spectrum of hemoglobin and oxyhemoglobin based on Prahl [18].
Figure 2
Figure 2
Schematic representation of the light path from the transmitter through the skin and back to the receiver including remission and scattering as well as the path length l and the time-dependent path length l(t) in the artery. Iλi means the intensity or power of the incident light and Iλt means the intensity of the light escaping from the measuring medium. Iλr means the power of reflected light.
Figure 3
Figure 3
Time diagram of the LEDs for standard settings. The numbers indicate the clock cycles. During the first clock cycle, there is an empty measurement without any illumination; during the second cycle, the 660 nm LEDs are switched on; during the third cycle, the 810 nm LEDs; during the fourth cycle, the 660 nm LEDs again; during the fifth cycle, the 940 nm LEDs; and during the sixth cycle, the 660 nm LEDs again. Then the sequence repeats from the beginning.
Figure 4
Figure 4
Undersampling diagram for expected background light frequencies over different sampling frequencies. Example: A 50 Hz modulated light (light blue color) results in 10 Hz (maximum) when sampled with 20 Hz, in 0 Hz when sampled with 25 Hz and in 16.6 Hz when sampled with 33.3 Hz. The selected sampling frequencies are chosen for 660 nm at 110 Hz (black line) and 810/940 nm at 36.67 Hz = 110/3 Hz in a manner that the undersampling frequencies of the modulated background light are out of the frequencies of interest.
Figure 5
Figure 5
Block diagram of the algorithm used for the detection of a heartbeat and calculation of the oxygen saturation.
Figure 6
Figure 6
(A) Number of LEDs per supply line and wavelength. (B) Arrangement of LEDs for lighting board. Numbers indicate the supply lines.
Figure 7
Figure 7
Attenuation normalized to the intensity Iλi for the wavelength of 940 nm on the target. The pixel pitch and pixel size is 5.3 μm.
Figure 8
Figure 8
A screenshot (2) Figure seem to be cut on the top in a way that may affect scientific reading. Please check and provide whole image. of the measurement GUI including a picture of the piglet in the incubator with active illumination. The quadratic area is the area of interest (AOI) of 128 × 128 pixels for signal processing. The colors of the quadratic sub-areas have no additional meaning.
Figure 9
Figure 9
Measurement setup: A piglet was placed in a NICU incubator. Pulse, oxygen saturation and respiration rate were measured by a camera-based contactless pulse oximeter which was placed on the incubator. For validation, an independent monitor, which is commonly used in neonatal intensive care units, was linked via a pulse oximeter sensor to the piglet leg together with a three-channel electrocardiograph. The red color in the incubator is caused by the active illumination of the SpO2 sensor system and not from an infrared heating lamp, which would disturb the measurement. The camera and the illumination are mounted at the bottom side of the metallic box above the incubator and point into the incubator. The camera and the illumination are shown in the lower-left corner of the picture.
Figure 10
Figure 10
Example measurement 1. Camera data showing a recording from the oxygen saturation sensor: Example of a cumulated spectrum with respiration superimposed onto the heartbeat (multiplex scheme see Figure 3).
Figure 11
Figure 11
Example measurement 2. Camera data of a recording from the oxygen saturation sensor: Example of a cumulative spectrum with successful heartbeat detection (multiplex scheme see Figure 2). Heartbeat and respiration rate are clearly identifiable, as well as artifacts and respiratory interruptions.
Figure 12
Figure 12
Bland– Altman diagram demonstrating the successful measurement of oxygen saturation of one piglet within a period of 20 min. This serves to compare the two measurement methods used.
Figure 13
Figure 13
Time signals of oxygen saturation compare camera and monitor. Calculated according to Figure 11.

Similar articles

References

    1. Purisch S.E., Gyamfi-Bannerman C. Epidemiology of preterm birth. Semin. Perinatol. 2017;41:387–391. doi: 10.1053/j.semperi.2017.07.009. - DOI - PubMed
    1. Goedicke-Fritz S., Hartel C., Krasteva-Christ G., Kopp M.V., Meyer S., Zemlin M. Preterm Birth Affects the Risk of Developing Immune-Mediated Diseases. Front. Immunol. 2017;8:1266. doi: 10.3389/fimmu.2017.01266. - DOI - PMC - PubMed
    1. Glass H.C., Costarino A.T., Stayer S.A., Brett C.M., Cladis F., Davis P.J. Outcomes for extremely premature infants. Anesth. Analg. 2015;120:1337–1351. doi: 10.1213/ANE.0000000000000705. - DOI - PMC - PubMed
    1. Chung H.U., Kim B.H., Lee J.Y., Lee J., Xie Z.Q., Ibler E.M., Lee K., Banks A., Jeong J.Y., Kim J., et al. Binodal, wireless epidermal electronic systems with in-sensor analytics for neonatal intensive care. Science. 2019;363:6430. doi: 10.1126/science.aau0780. - DOI - PMC - PubMed
    1. Cartlidge P.H., Fox P.E., Rutter N. The scars of newborn intensive care. Early Hum. Dev. 1990;21:1–10. doi: 10.1016/0378-3782(90)90105-R. - DOI - PubMed

LinkOut - more resources