

A 3D Bio-Printed-Based Model for Pancreatic Ductal Adenocarcinoma
- PMID: 39329875
- PMCID: PMC11431387
- DOI: 10.3390/diseases12090206
A 3D Bio-Printed-Based Model for Pancreatic Ductal Adenocarcinoma
Abstract
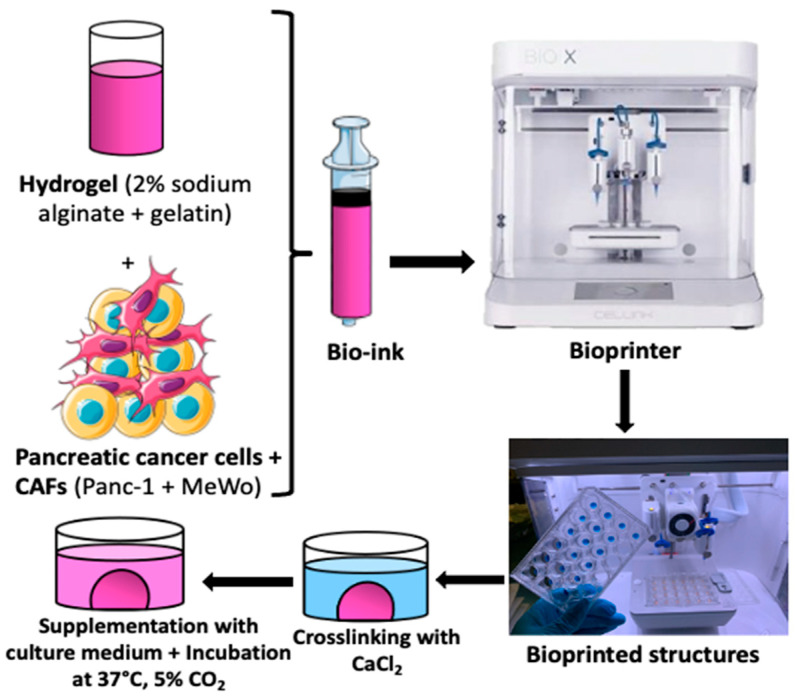
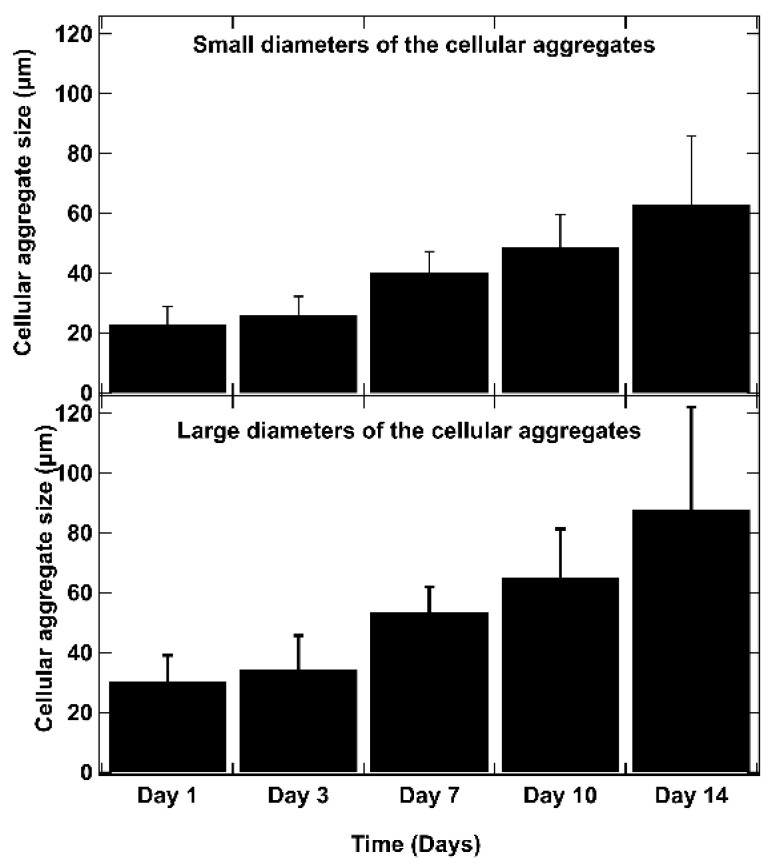
Pancreatic ductal adenocarcinoma (PDAC) is a disease with a very poor prognosis, characterized by incidence rates very close to death rates. Despite the efforts of the scientific community, preclinical models that faithfully recreate the PDAC tumor microenvironment remain limited. Currently, the use of 3D bio-printing is an emerging and promising method for the development of cancer tumor models with reproducible heterogeneity and a precisely controlled structure. This study presents the development of a model using the extrusion 3D bio-printing technique. Initially, a model combining pancreatic cancer cells (Panc-1) and cancer-associated fibroblasts (CAFs) encapsulated in a sodium alginate and gelatin-based hydrogel to mimic the metastatic stage of PDAC was developed and comprehensively characterized. Subsequently, efforts were made to vascularize this model. This study demonstrates that the resulting tumors can maintain viability and proliferate, with cells self-organizing into aggregates with a heterogeneous composition. The utilization of 3D bio-printing in creating this tumor model opens avenues for reproducing tumor complexity in the future, offering a versatile platform for improving anti-cancer therapy models.
Keywords: 3D bio-printing; co-culture; pancreatic ductal adenocarcinoma.
Conflict of interest statement
The authors declare no conflicts of interest of data; in the writing of the manuscript; or in the decision to publish the results.
Figures


Similar articles
-
A bioprinted sea-and-island multicellular model for dissecting human pancreatic tumor-stroma reciprocity and adaptive metabolism.Biomaterials. 2024 Oct;310:122631. doi: 10.1016/j.biomaterials.2024.122631. Epub 2024 May 24. Biomaterials. 2024. PMID: 38815457
-
Bioprinting of hydrogel beads to engineer pancreatic tumor-stroma microtissues for drug screening.Int J Bioprint. 2023 Feb 1;9(3):676. doi: 10.18063/ijb.676. eCollection 2023. Int J Bioprint. 2023. PMID: 37273977 Free PMC article.
-
Inclusion of cancer-associated fibroblasts in drug screening assays to evaluate pancreatic cancer resistance to therapeutic drugs.J Physiol Biochem. 2023 Feb;79(1):223-234. doi: 10.1007/s13105-021-00857-2. Epub 2021 Dec 5. J Physiol Biochem. 2023. PMID: 34865180 Free PMC article.
-
Heterogeneity of Cancer-Associated Fibroblasts and the Tumor Immune Microenvironment in Pancreatic Cancer.Cancers (Basel). 2022 Aug 18;14(16):3994. doi: 10.3390/cancers14163994. Cancers (Basel). 2022. PMID: 36010986 Free PMC article. Review.
-
Heterogeneity and plasticity of cancer-associated fibroblasts in the pancreatic tumor microenvironment.Semin Cancer Biol. 2022 Jul;82:184-196. doi: 10.1016/j.semcancer.2021.03.006. Epub 2021 Mar 15. Semin Cancer Biol. 2022. PMID: 33737108 Review.
Cited by
-
Biomimetic Tumour Model Systems for Pancreatic Ductal Adenocarcinoma in Relation to Photodynamic Therapy.Int J Mol Sci. 2025 Jul 2;26(13):6388. doi: 10.3390/ijms26136388. Int J Mol Sci. 2025. PMID: 40650165 Free PMC article. Review.
References
-
- Dardare J., Witz A., Merlin J.L., Bochnakian A., Toussaint P., Gilson P. Alexandre Harlé Epithelial to Mesenchymal Transition in Patients with Pancreatic Ductal Adenocarcinoma: State-of-the-Art and Therapeutic Opportunities. Pharmaceuticals. 2021;14:740. doi: 10.3390/ph14080740. - DOI - PMC - PubMed
Grants and funding
LinkOut - more resources
Full Text Sources
