. 2024 Sep 12;46(9):10038-10064.
doi: 10.3390/cimb46090600.

Disulfidptosis: A New Target for Parkinson's Disease and Cancer

Affiliations

Disulfidptosis: A New Target for Parkinson's Disease and Cancer

Tingting Liu et al. Curr Issues Mol Biol. .

Abstract

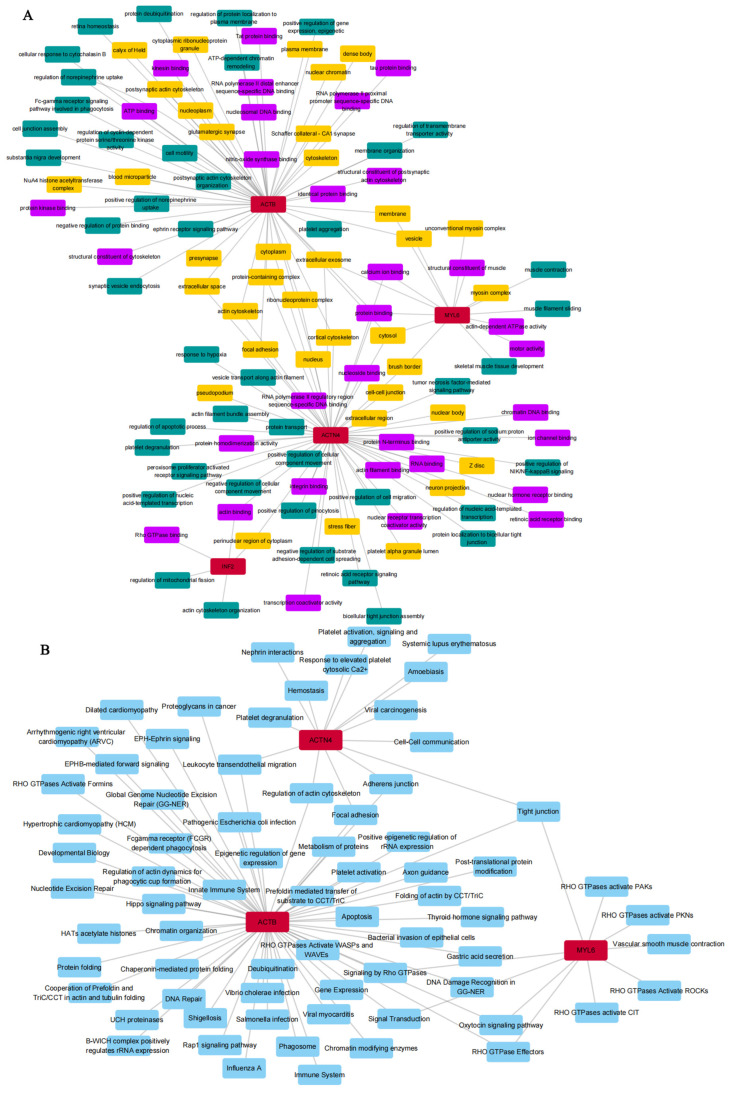
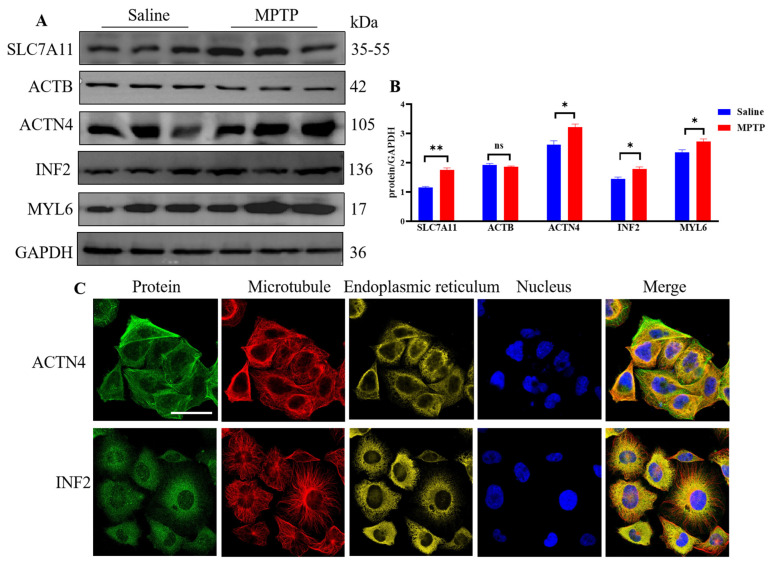
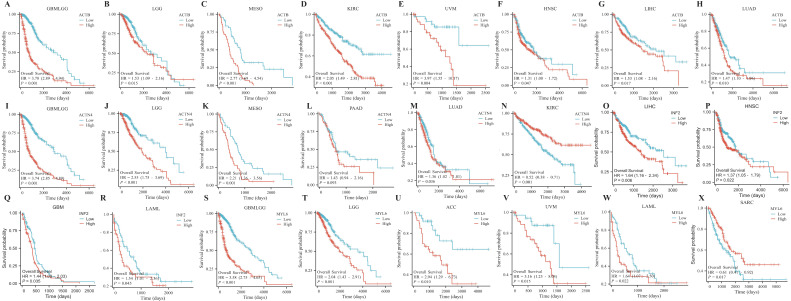
Recent studies have uncovered intriguing connections between Parkinson's disease (PD) and cancer, two seemingly distinct disease categories. Disulfidptosis has garnered attention as a novel form of regulated cell death that is implicated in various pathological conditions, including neurodegenerative disorders and cancer. Disulfidptosis involves the dysregulation of intracellular redox homeostasis, leading to the accumulation of disulfide bonds and subsequent cell demise. This has sparked our interest in exploring common molecular mechanisms and genetic factors that may be involved in the relationship between neurodegenerative diseases and tumorigenesis. The Gene4PD database was used to retrieve PD differentially expressed genes (DEGs), the biological functions of differential expression disulfidptosis-related genes (DEDRGs) were analyzed, the ROCs of DEDRGs were analyzed using the GEO database, and the expression of DEDRGs was verified by an MPTP-induced PD mouse model in vivo. Then, the DEDRGs in more than 9000 samples of more than 30 cancers were comprehensively and systematically characterized by using multi-omics analysis data. In PD, we obtained a total of four DEDRGs, including ACTB, ACTN4, INF2, and MYL6. The enriched biological functions include the regulation of the NF-κB signaling pathway, mitochondrial function, apoptosis, and tumor necrosis factor, and these genes are rich in different brain regions. In the MPTP-induced PD mouse model, the expression of ACTB was decreased, while the expression of ACTN4, INF2, and MYL6 was increased. In pan-cancer, the high expression of ACTB, ACTN4, and MYL6 in GBMLGG, LGG, MESO, and LAML had a poor prognosis, and the high expression of INF2 in LIHC, LUAD, UVM, HNSC, GBM, LAML, and KIPAN had a poor prognosis. Our study showed that these genes were more highly infiltrated in Macrophages, NK cells, Neutrophils, Eosinophils, CD8 T cells, T cells, T helper cells, B cells, dendritic cells, and mast cells in pan-cancer patients. Most substitution mutations were G-to-A transitions and C-to-T transitions. We also found that miR-4298, miR-296-3p, miR-150-3p, miR-493-5p, and miR-6742-5p play important roles in cancer and PD. Cyclophosphamide and ethinyl estradiol may be potential drugs affected by DEDRGs for future research. This study found that ACTB, ACTN4, INF2, and MYL6 are closely related to PD and pan-cancer and can be used as candidate genes for the diagnosis, prognosis, and therapeutic biomarkers of neurodegenerative diseases and cancers.

Keywords: Parkinson’s disease; disulfidptosis; immune infiltration; pan-cancer; prognosis.


Conflict of interest statement

The authors declare no conflicts of interest.

Figures

Figure 1
Figure 1
The DEDRG-enriched GO terms and KEGG pathways. (A) GOBP, GOCC, and GOMF analysis. (B) Signaling pathway enrichment analysis. Red represents DEDRGs, green represents biological process, purple represents molecular function, orange represents cellular component, and blue represents signaling pathways.
Figure 2
Figure 2
Spatio-temporal expression profiles of (A) ACTB, (B) ACTN4, (C) INF2, and (D) MYL6 retrieved from BrainSpan. The darker the blue color, the higher the protein expression level in the brain region.
Figure 3
Figure 3
Diagnostic value of DEDRGs in (A) 16 PD and 9 control subjects from the substantia nigra postmortem brain from the GSE7621 dataset; (B) 8 PD and 9 control subjects from the substantia nigra of postmortem brains from the GSE20163 dataset; (C) 6 PD and 5 control subjects from substantia nigra samples from the GSE20164 dataset; (D) control Braak α-synuclein Stage 0: 8 samples; Braak α-synuclein stages 1–2: 5 samples; Braak α-synuclein stages 3–4: 7 samples; Braak α-synuclein stages 5–6: 8 samples from the GSE49036 dataset; (E) 8 PD and 8 control subjects from peripheral mononuclear blood cells from the GSE22491 dataset; (F) 233 healthy controls and 205 idiopathic PD patients from whole blood from the GSE99039 dataset. (G) The expression of DEDRGs from the GSE49036 dataset at different stages. Gene ID: 200801_x_at, 213867_x_at, 224594_x_at, AFFX-HSAC07/X00351_3_at, AFFX-HSAC07/X00351_5_at, AFFX-HSAC07/X00351_M_at, 200601_at, 218144_s_at, 222534_s_at, 222535_at, 224469_s_at, 212082_s_at, 214002_at.
Figure 4
Figure 4
Validity verification of DEDRGs. (A) Validation of DEDRGs by Western blotting. (B) Statistical plots of SLC7A11, ACTB, ACTN4, INF2, and MYL6. Compared with the saline group, ns = no significance, * p < 0.05, ** p < 0.01. n = 3. (C) Location of ACTN4 and INF2 proteins in cells from the HPA database: green represents the target protein, red represents microtubules, yellow represents the endoplasmic reticulum, and blue represents the nucleus (scale bar, 20 µm).
Figure 5
Figure 5
Box plot of differential expression of DEDRGs between normal and tumor samples. (A) The differential expression of ACTB in pan-cancer. (B) The differential expression of ACTN4 in pan-cancer. (C) The differential expression of INF2 in pan-cancer. (D) The differential expression of MYL6 in pan-cancer. Compared with the normal samples, * p < 0.05, ** p < 0.01, *** p < 0.001, **** p < 0.0001.
Figure 6
Figure 6
Pan-cancer prognostic analysis of DEDRGs using univariate Cox regression, including (A) ACTB, (B) ACTN4, (C) INF2, and (D) MYL6.
Figure 7
Figure 7
Survival analysis of DEDRG expression in pan-cancer. (AH) Survival curves of ACTB in GBMLGG, LGG, MESO, KIRC, UVM, HNSC, LIHC, LUAD. (IN) Survival curves of ACTN4 in GBMLGG, LGG, MESO, PAAD, LUAD, KIRC. (OR) Survival curves of INF2 in LIHC, HNSC, GBM, LAML. (SX) Survival curves of MYL6 in GBMLGG, LGG, ACC, UVM, LAML, SARC.
Figure 8
Figure 8
Pan-cancer immune infiltration analysis: (A) Immunoinfiltration analysis of ACTB in GBMLGG, LGG, MESO, KIRC, UVM, HNSC, LIHC, LUAD, and GBM. (B) Immunoinfiltration analysis of ACTN4 in GBMLGG, LGG, MESO, PAAD, LUAD, and KIRC. (C) Immunoinfiltration analysis of INF2 in LIHC, HNSC, GBM, and LAML. (D) Immunoinfiltration analysis of MYL6 in GBMLGG, ACC, LGG, UVM, LAML, and SARC. The correlation coefficient being positive indicates a positive correlation between two variables; a negative correlation coefficient indicates a negative correlation between two variables. The absolute value of the correlation coefficient represents the degree of correlation: 0–0.3 indicates weak or no correlation; 0.3–0.5 indicates weak correlation; 0.5–0.8 indicates moderate correlation; 0.8–1 indicates strong correlation. * p < 0.05, ** p < 0.01, *** p < 0.001.
Figure 9
Figure 9
Single-cell type analysis of DEDRGs, including ACTB, ACTN4, INF2, and MYL6, mainly from glandular epithelial cells, squamous epithelial cells, specialized epithelial cells, endocrine cells, neuronal cells, glial cells, germ cells, trophoblast cells, endothelial cells, muscle cells, adipocytes, pigment cells, mesenchymal cells, undifferentiated cells, and blood and immune cells.
Figure 10
Figure 10
Gene mutation analysis of DEDRGs. (A) The pan-cancer mutation status of ACTB was determined using the cBioPortal tool. (B) ACTB base mutation frequency. (C) The pan-cancer mutation status of ACTN4 was determined using the cBioPortal tool. (D) ACTN4 base mutation frequency. (E) The pan-cancer mutation status of INF2 was determined using the cBioPortal tool. (F) INF2 base mutation frequency. (G) The pan-cancer mutation status of MYL6 was determined using the cBioPortal tool. (H) MYL6 base mutation frequency.
Figure 11
Figure 11
Tumor pathological staining of ACTB in glioma, renal cancer, head and neck cancer, liver cancer, and lung cancer; ACTN4 in glioma, pancreatic cancer, lung cancer, and renal cancer; INF2 in liver cancer, head and neck cancer, and glioma; MYL6 in glioma (scale bar, 20 µm).
Figure 12
Figure 12
Coexpression network of DEDRGs and target miRNAs.
Figure 13
Figure 13
Binding mode of screened drugs to their targets by molecular docking. (A) The structure of cyclophosphamide. (B) The structure of ethinyl estradiol. (C) The structure of ACTB (3byh). (D) Molecular docking results of ACTB and cyclophosphamide. (E) Molecular docking results of ACTB and ethinyl estradiol.

References

    1. Lenart P., Novak J., Bienertova-Vasku J. PIWI-piRNA pathway: Setting the pace of aging by reducing DNA damage. Mech. Ageing Dev. 2018;173:29–38. doi: 10.1016/j.mad.2018.03.009. - DOI - PubMed
    1. Crusz S.M., Balkwill F.R. Inflammation and cancer: Advances and new agents. Nat. Rev. Clin. Oncol. 2015;12:584–596. doi: 10.1038/nrclinonc.2015.105. - DOI - PubMed
    1. Gao H.M., Hong J.S. Why neurodegenerative diseases are progressive: Uncontrolled inflammation drives disease progression. Trends Immunol. 2008;29:357–365. doi: 10.1016/j.it.2008.05.002. - DOI - PMC - PubMed
    1. Ganguly G., Chakrabarti S., Chatterjee U., Saso L. Proteinopathy, oxidative stress and mitochondrial dysfunction: Cross talk in Alzheimer’s disease and Parkinson’s disease. Drug Des. Dev. Ther. 2017;11:797–810. doi: 10.2147/DDDT.S130514. - DOI - PMC - PubMed
    1. Pilato F., Profice P., Ranieri F., Di Iorio R., Florio L., Di Lazzaro V. Synaptic plasticity in neurodegenerative diseases evaluated and modulated by in vivo neurophysiological techniques. Mol. Neurobiol. 2012;46:563–571. doi: 10.1007/s12035-012-8302-9. - DOI - PubMed

LinkOut - more resources