

Genetics and Traumatic Brain Injury: Findings from an Exome-Based Study of a 50-Patient Case Series
- PMID: 39329968
- PMCID: PMC11430351
- DOI: 10.3390/cimb46090616
Genetics and Traumatic Brain Injury: Findings from an Exome-Based Study of a 50-Patient Case Series
Abstract
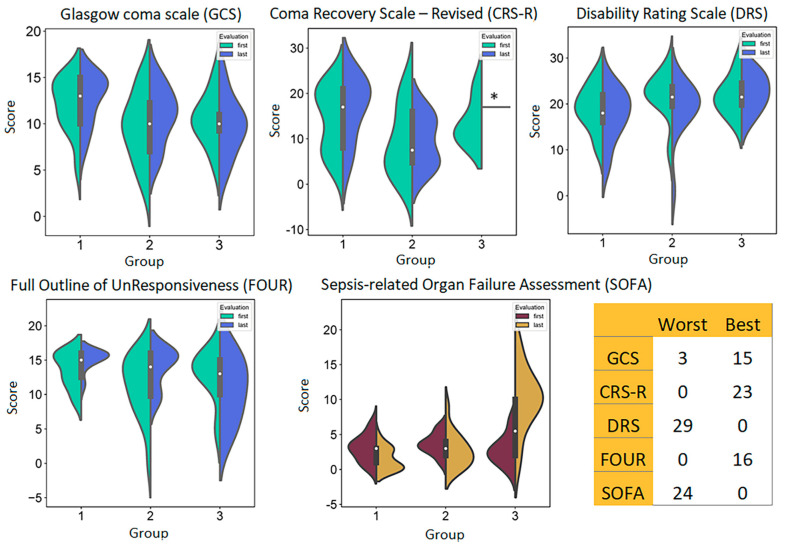
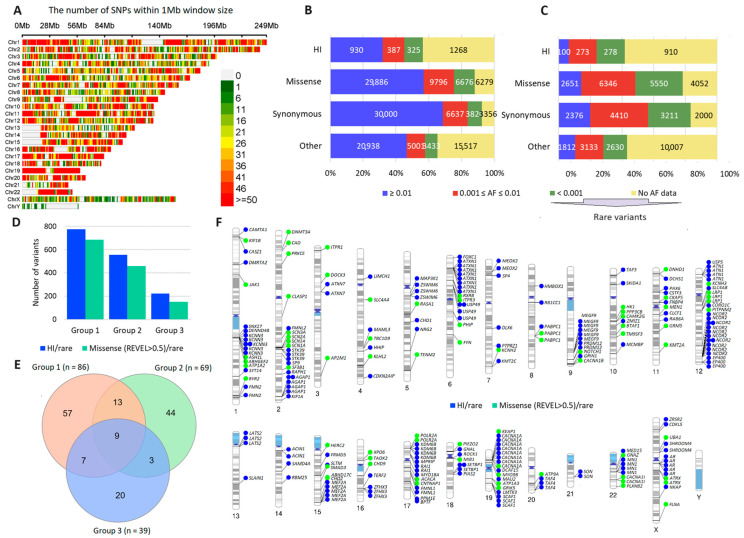
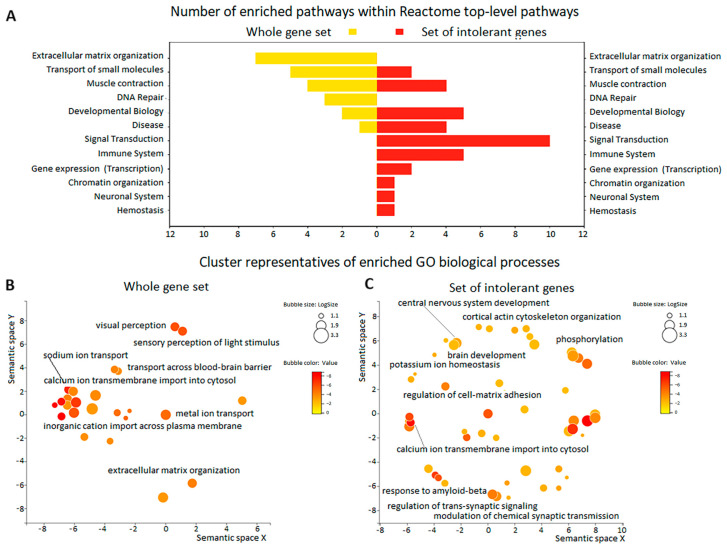
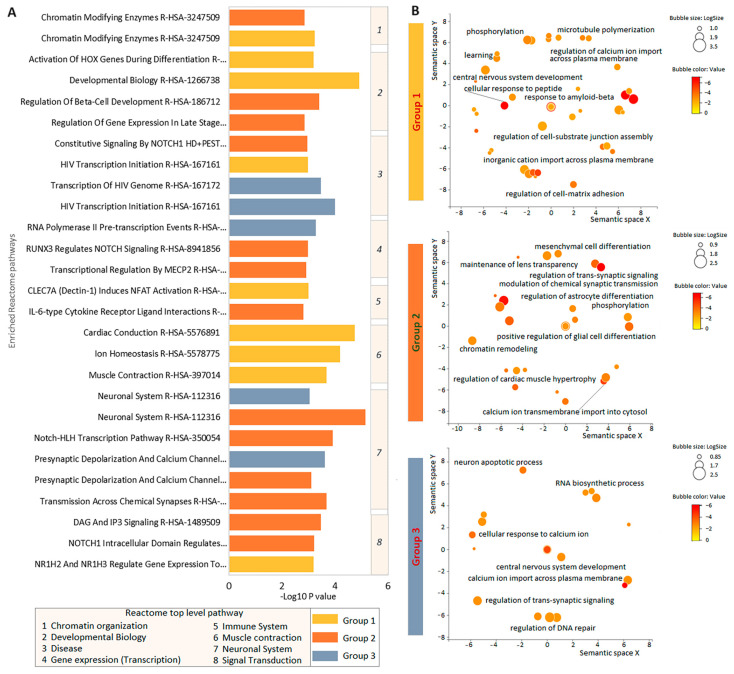
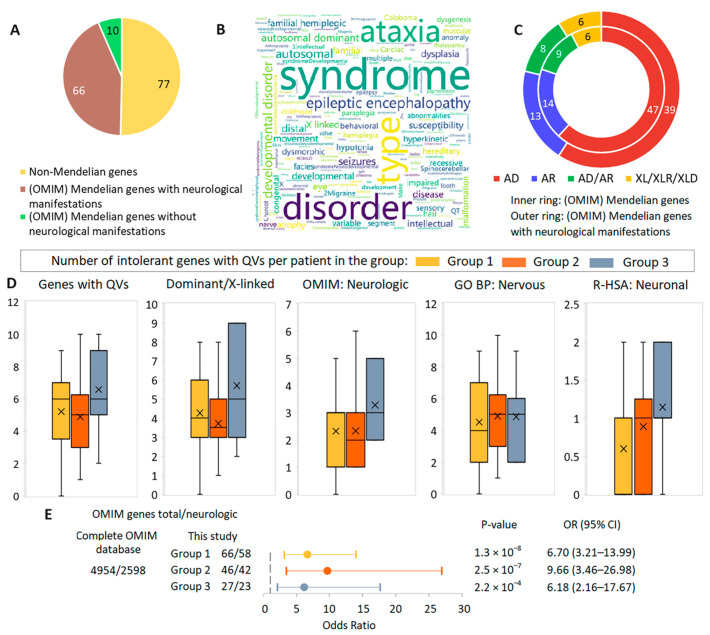
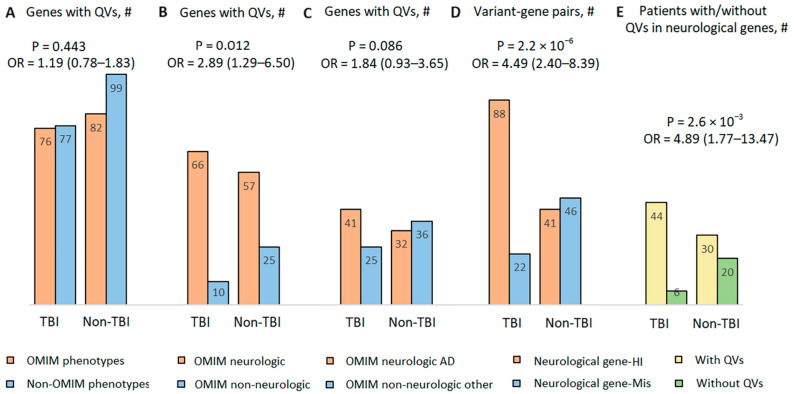
Traumatic brain injury (TBI) is the leading cause of global mortality and morbidity. Because TBI is accident-related, the role of genetics in predisposing to TBI has been largely unexplored. However, the likelihood of injury may not be entirely random and may be associated with certain physical and mental characteristics. In this study, we analyzed the exomes of 50 patients undergoing rehabilitation after TBI. Patients were divided into three groups according to rehabilitation outcome: improvement, no change, and deterioration/death. We focused on rare, potentially functional missense and high-impact variants in genes intolerant to these variants. The concordant results from the three independent groups of patients allowed for the suggestion of the existence of a genetic predisposition to TBI, associated with rare functional variations in intolerant genes, with a prevalent dominant mode of inheritance and neurological manifestations in the genetic phenotypes according to the OMIM database. Forty-four of the 50 patients had one or more rare, potentially deleterious variants in one or more neurological genes. Comparison of these results with those of a 50-sampled matched non-TBI cohort revealed significant differences: P = 2.6 × 10⁻³, OR = 4.89 (1.77-13.47). There were no differences in the distribution of the genes of interest between the TBI patient groups. Our exploratory study provides new insights into the impact of genetics on TBI risk and is the first to address potential genetic susceptibility to TBI.
Keywords: exome sequencing; intolerant genes; moderate/severe traumatic brain injury (msTBI); nervous system disease-related genes; rare high-impact (HI) variants.
Conflict of interest statement
The authors declare no conflicts of interest.
Figures
Similar articles
-
Association of Traumatic Brain Injury With the Risk of Developing Chronic Cardiovascular, Endocrine, Neurological, and Psychiatric Disorders.JAMA Netw Open. 2022 Apr 1;5(4):e229478. doi: 10.1001/jamanetworkopen.2022.9478. JAMA Netw Open. 2022. PMID: 35482306 Free PMC article.
-
The impact of pre-injury anticoagulation therapy in the older adult patient experiencing a traumatic brain injury: A systematic review.JBI Libr Syst Rev. 2012;10(58):4610-4621. doi: 10.11124/jbisrir-2012-429. JBI Libr Syst Rev. 2012. PMID: 27820526
-
Functional Recovery, Symptoms, and Quality of Life 1 to 5 Years After Traumatic Brain Injury.JAMA Netw Open. 2023 Mar 1;6(3):e233660. doi: 10.1001/jamanetworkopen.2023.3660. JAMA Netw Open. 2023. PMID: 36939699 Free PMC article.
-
[Mild traumatic brain injury and postconcussive syndrome: a re-emergent questioning].Encephale. 2012 Sep;38(4):329-35. doi: 10.1016/j.encep.2011.07.003. Epub 2011 Aug 31. Encephale. 2012. PMID: 22980474 Review. French.
-
Traumatic brain injury: neuropathological, neurocognitive and neurobehavioral sequelae.Pituitary. 2019 Jun;22(3):270-282. doi: 10.1007/s11102-019-00957-9. Pituitary. 2019. PMID: 30929221 Review.
Cited by
-
Red Blood Cell-Related Phenotype-Genotype Correlations in Chronic and Acute Critical Illnesses (Traumatic Brain Injury Cohort and COVID-19 Cohort).Int J Mol Sci. 2025 Jan 31;26(3):1239. doi: 10.3390/ijms26031239. Int J Mol Sci. 2025. PMID: 39941007 Free PMC article.
-
Observational Study of Microbial Colonization and Infection in Neurological Intensive Care Patients Based on Electronic Health Records.Biomedicines. 2025 Apr 2;13(4):858. doi: 10.3390/biomedicines13040858. Biomedicines. 2025. PMID: 40299463 Free PMC article.
References
-
- Dewan M.C., Rattani A., Gupta S., Baticulon R.E., Hung Y.C., Punchak M., Agrawal A., Adeleye A.O., Shrime M.G., Rubiano A.M., et al. Estimating the global incidence of traumatic brain injury. J. Neurosurg. 2018;130:1080–1097. - PubMed
-
- Corrigan J.D., Hammond F.M. Traumatic brain injury as a chronic health condition. Arch. Phys. Med. Rehabil. 2013;94:1199–1201. - PubMed
-
- Dikmen S.S., Machamer J.E., Powell J.M., Temkin N.R. Outcome 3 to 5 years after moderate to severe traumatic brain injury. Arch. Phys. Med. Rehabil. 2003;84:1449–1457. - PubMed
Grants and funding
LinkOut - more resources
Full Text Sources
