. 2024 Sep 17;26(9):796.
doi: 10.3390/e26090796.

Developing an Early Warning System for Financial Networks: An Explainable Machine Learning Approach

Affiliations

Developing an Early Warning System for Financial Networks: An Explainable Machine Learning Approach

Daren Purnell Jr et al. Entropy (Basel). .

Abstract

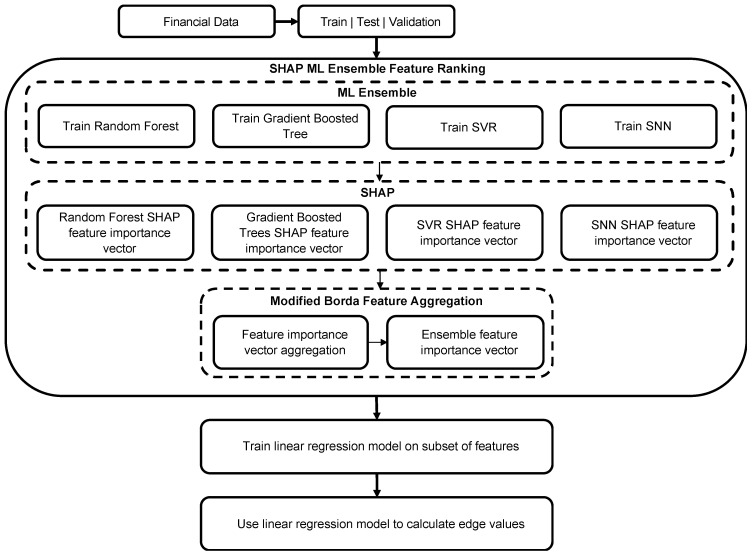
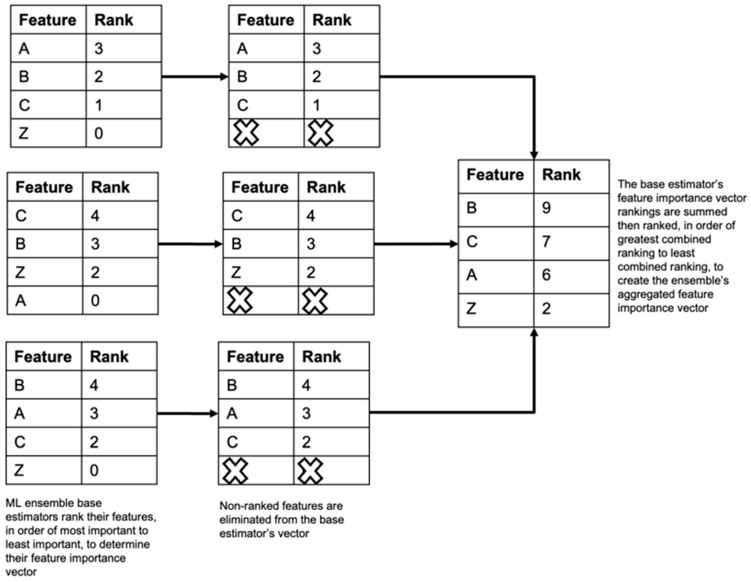
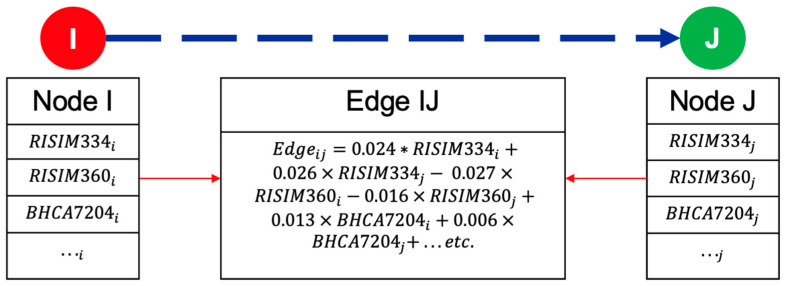
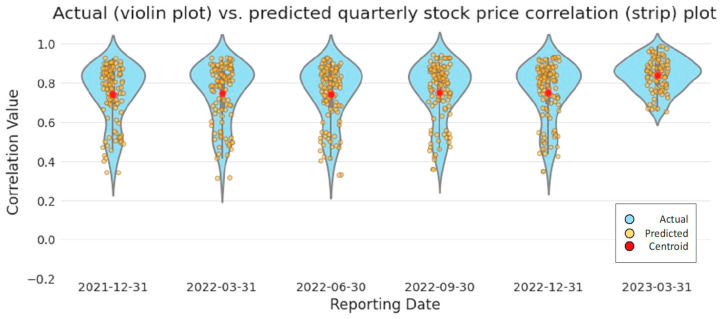
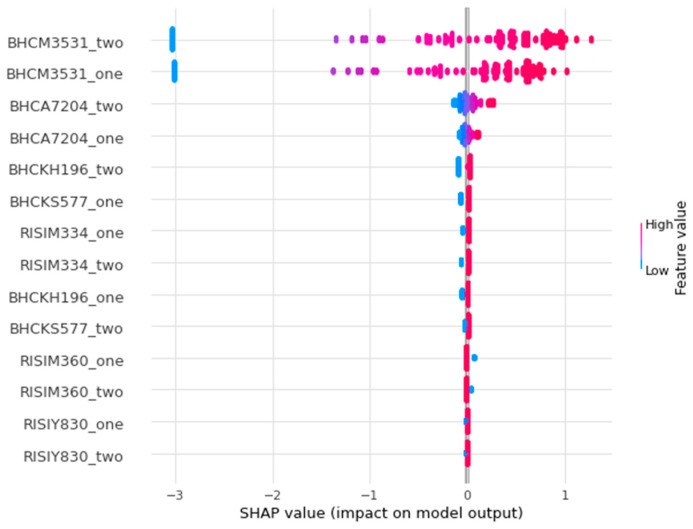
Identifying the influential variables that provide early warning of financial network instability is challenging, in part due to the complexity of the system, uncertainty of a failure, and nonlinear, time-varying relationships between network participants. In this study, we introduce a novel methodology to select variables that, from a data-driven and statistical modeling perspective, represent these relationships and may indicate that the financial network is trending toward instability. We introduce a novel variable selection methodology that leverages Shapley values and modified Borda counts, in combination with statistical and machine learning methods, to create an explainable linear model to predict relationship value weights between network participants. We validate this new approach with data collected from the March 2023 Silicon Valley Bank Failure. The models produced using this novel method successfully identified the instability trend using only 14 input variables out of a possible 3160. The use of parsimonious linear models developed by this method has the potential to identify key financial stability indicators while also increasing the transparency of this complex system.

Keywords: complex systems; machine learning; macroprudential economics; systemic risk.


Conflict of interest statement

The authors declare no conflicts of interest.

Figures

Figure 1
Figure 1
Proposed method to identify the subset of influential variables using ML ensemble methods, SHAP, and the modified Borda count method [66].
Figure 2
Figure 2
Modified Borda count feature aggregation. This figure illustrates the steps taken to implement the modified Borda count method to create the ML ensemble feature importance vector from the feature importance vectors of the individual base estimators.
Figure 3
Figure 3
Construction of financial network EWS. The figure illustrates the construction of a financial network model, where the nodes represent financial institutions with their represented variables from the FRB Y-9C and Y-15 reports, and the linear regression model is used to calculate the edge values. RISIM334 is the Securities Financing Transaction (SFT) Exposure: Gross SFT Assets, RISIM360 is the Over the Counter (OTC) derivatives with unaffiliated financial institutions that have a net positive fair value: potential future exposure, and BHCA7204 is the Tier 1 leverage ratio. “…” represents the additional predictive variables from the financial institution pair, described in Table 2, needed to calculate the edge value.
Figure 4
Figure 4
Actual versus predicted quarterly stock price correlation plot. The distribution of the actual quarterly stock price correlation values is displayed as a blue violin plot, with the predicted and centroid values overlaid in yellow and red, respectively. (Color).
Figure 5
Figure 5
Federal Reserve Bank of St. Louis Financial Stress Index (Weekly, Not Seasonally Adjusted) identifies periods of high stress in financial markets over time.
Figure 6
Figure 6
Actual vs. predicted quarterly stock correlation boxplot depicts the distribution of actual vs. predicted values over quarterly reporting periods. (Color).
Figure 7
Figure 7
Knee and graph plots showing the reduction in SSE as the number of clusters increases with the corresponding network plots from the same quarterly reporting period, showing the financial institutions (nodes) driving the creation of the three clusters from September 2022 to March 2023. Key: Bank of America (BAC), Barclays (BCS), Bank of New York Mellon (BK), Citigroup (C), Deutsche Bank (DB), Goldman Sachs (GS), Morgan Stanley (MS), JP Morgan (JPM), Silicon Valley Financial Group (SIVB), Charles Schwab (SCHW), Wells Fargo (WFC). (Color).
Figure 7
Figure 7
Knee and graph plots showing the reduction in SSE as the number of clusters increases with the corresponding network plots from the same quarterly reporting period, showing the financial institutions (nodes) driving the creation of the three clusters from September 2022 to March 2023. Key: Bank of America (BAC), Barclays (BCS), Bank of New York Mellon (BK), Citigroup (C), Deutsche Bank (DB), Goldman Sachs (GS), Morgan Stanley (MS), JP Morgan (JPM), Silicon Valley Financial Group (SIVB), Charles Schwab (SCHW), Wells Fargo (WFC). (Color).
Figure 8
Figure 8
SHAP feature importance plot showing the relative importance of BHCM3531: U.S. Treasury Securities and BHCA7204: Tier 1 Leverage Ratio between GSIB pairs, identified as “_one” for GSIB one and “_two” for GSIB two. BHCA7204 is Tier 1 Leverage Ratio, BHCKH196 is Unsettled Transactions (Failed Trades)(Allocation by Risk Weight Category 100%)(Bank Holding Company Consolidated), BHCKS577 is Risk-Weighted Assets by Risk-Weight Category (Allocation by Risk-Weight Category 625%), RISIM334 is Securities Financing Transaction (SFT) Exposures: Gross SFT Assets, RISIM360 is Over the Counter (OTC) Derivatives with Unaffiliated Financial Institutions that have a Net Positive Fair Value: Potential Future Exposure, and RISIY830 is Other On-Balance Sheet Exposures: Other On-Balance Sheet Assets. (Color).

Similar articles

References

    1. Alessi L., Detken C. Identifying excessive credit growth and leverage. J. Financ. Stab. 2018;35:215–225. doi: 10.1016/j.jfs.2017.06.005. - DOI
    1. Alessi L., Savona R. Machine learning for financial stability. In: Consoli S., Recupero D.R., Saisana M., editors. Data Science for Economics and Finance: Methodologies and Applications. Springer; Cham, Switzerland: 2021. pp. 65–87. - DOI
    1. Buckman M., Joseph A., Robertson H. Data Science for Economics and Finance Methodologies and Applications. Springer; Cham, Switzerland: 2021. Opening the Black Box: Machine Learning Interpretability and Inference Tools with an Application to Economic Forecasting; pp. 43–61. - DOI
    1. Tung H.K.K., Wong M.C.S. Financial risk forecasting with nonlinear dynamics and support vector regression. J. Oper. Res. Soc. 2009;60:685–695. doi: 10.1057/palgrave.jors.2602594. - DOI
    1. Shannon C.E. Mathematical theory of communication. Bell Syst. Tech. J. 1948;27:306–317. - PubMed

LinkOut - more resources