. 2024 Sep 17;14(9):501.
doi: 10.3390/metabo14090501.

Implementation of Machine Learning-Based System for Early Diagnosis of Feline Mammary Carcinomas through Blood Metabolite Profiling

Affiliations

Implementation of Machine Learning-Based System for Early Diagnosis of Feline Mammary Carcinomas through Blood Metabolite Profiling

Vidhi Kulkarni et al. Metabolites. .

Abstract

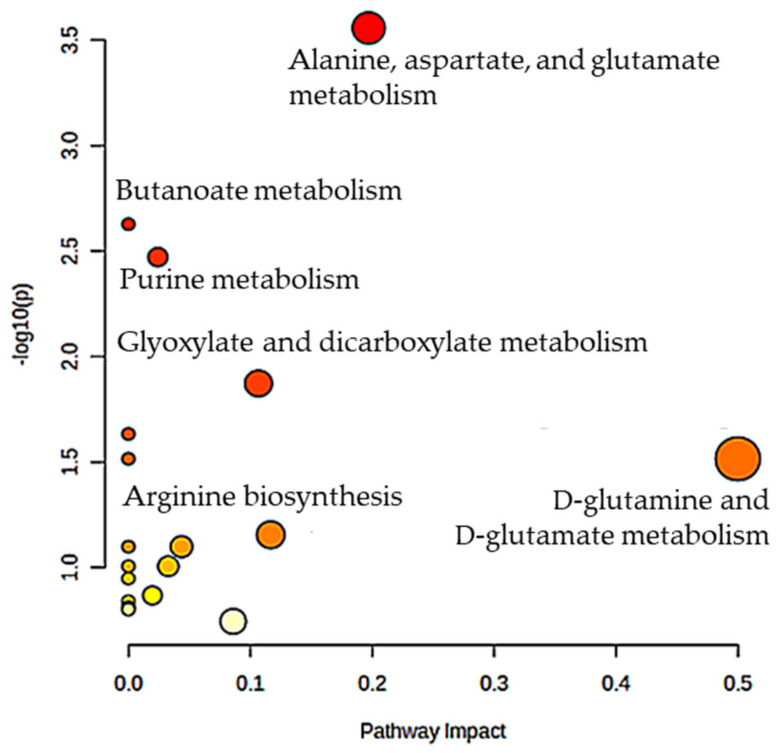
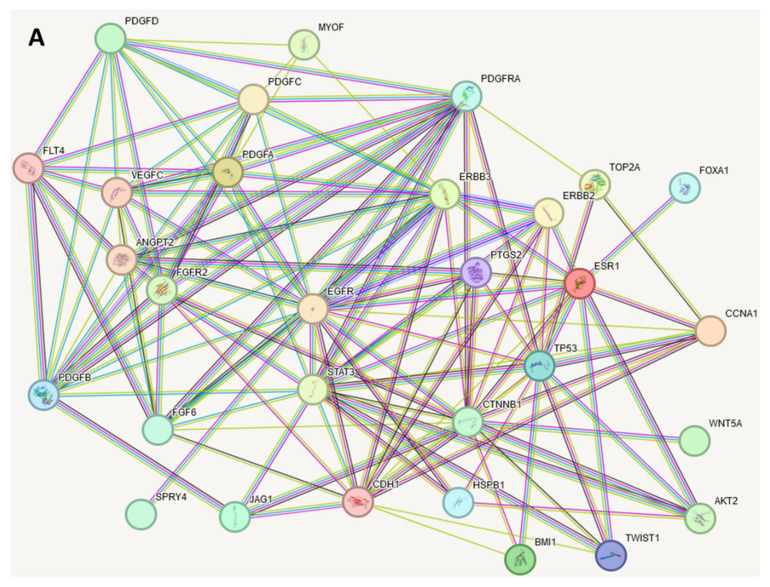
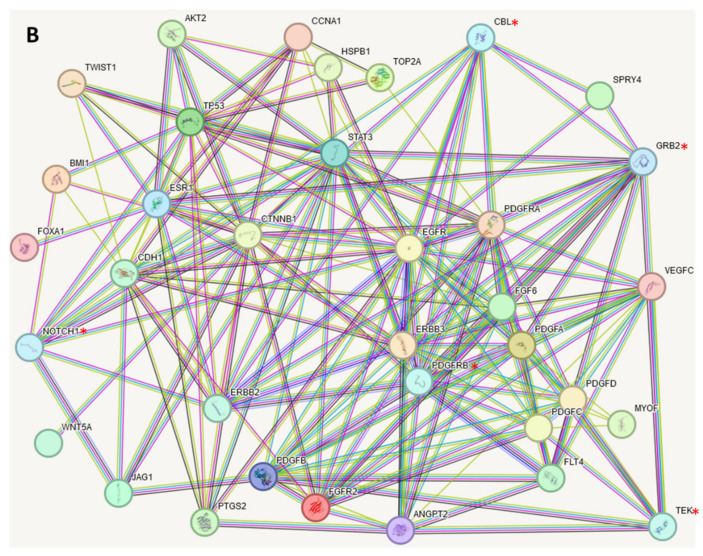
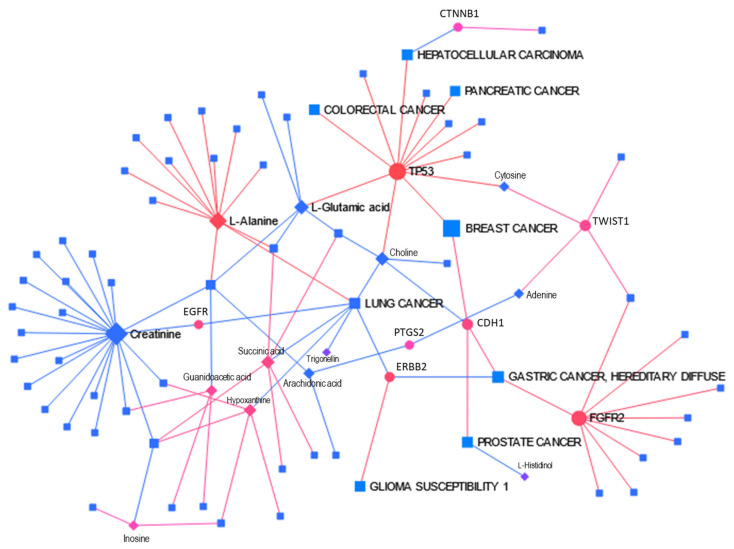
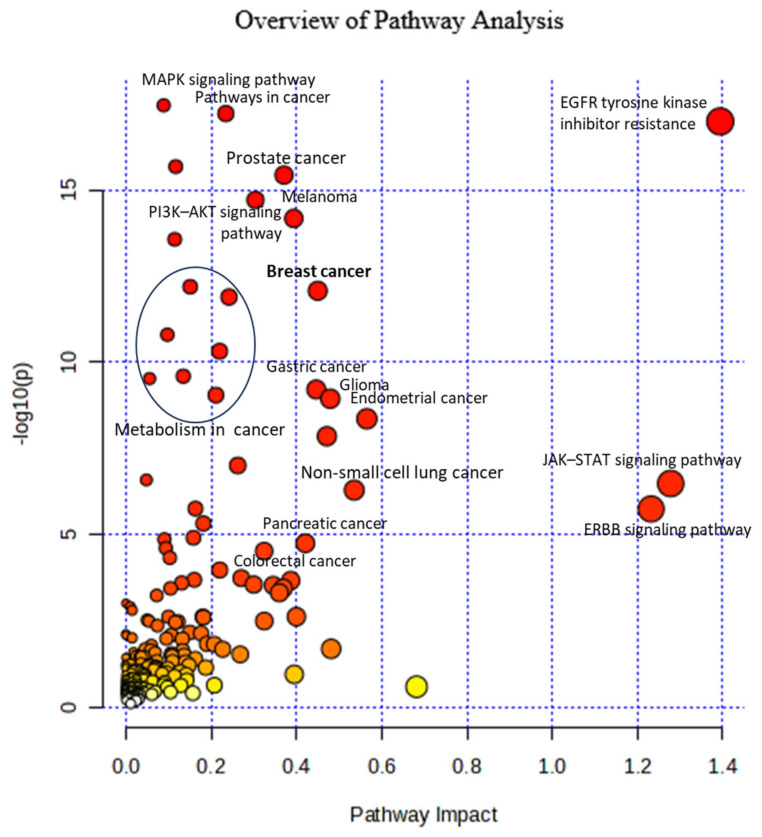
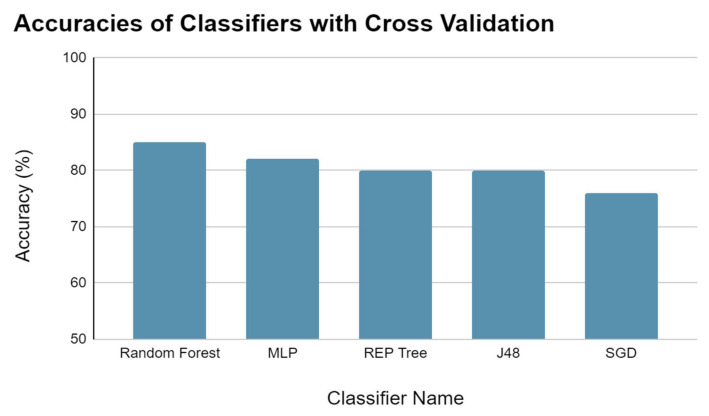
Background: Feline mammary carcinoma (FMC) is a prevalent and fatal carcinoma that predominantly affects unspayed female cats. FMC is the third most common carcinoma in cats but is still underrepresented in research. Current diagnosis methods include physical examinations, imaging tests, and fine-needle aspiration. The diagnosis through these methods is sometimes delayed and unreliable, leading to increased chances of mortality. Objectives: The objective of this study was to identify the biomarkers, including blood metabolites and genes, related to feline mammary carcinoma, study their relationships, and develop a machine learning (ML) model for the early diagnosis of the disease. Methods: We analyzed the blood metabolites of felines with mammary carcinoma using the pathway analysis feature in MetaboAnalyst software, v. 5.0. We utilized machine-learning (ML) methods to recognize FMC using the blood metabolites of sick patients. Results: The metabolic pathways that were elucidated to be associated with this disease include alanine, aspartate and glutamate metabolism, Glutamine and glutamate metabolism, Arginine biosynthesis, and Glycerophospholipid metabolism. Furthermore, we also elucidated several genes that play a significant role in the development of FMC, such as ERBB2, PDGFA, EGFR, FLT4, ERBB3, FIGF, PDGFC, PDGFB through STRINGdb, a database of known and predicted protein-protein interactions, and MetaboAnalyst 5.0. The best-performing ML model was able to predict metabolite class with an accuracy of 85.11%. Conclusion: Our findings demonstrate that the identification of the biomarkers associated with FMC and the affected metabolic pathways can aid in the early diagnosis of feline mammary carcinoma.

Keywords: early diagnosis; feline mammary cancer; machine learning; metabolomics.


Conflict of interest statement

The authors declared no potential conflicts of interest with respect to the research, authorship, and/or publication of this article. Igor Tsigelny and Valentina Kouznetsova are the employees of BiAna. The paper reflects the views of the scientists, and not the company.

Figures

Figure 1
Figure 1
Significant metabolic pathways in FMC that were elucidated through the Metabolic Pathway Analysis application conducted using MetaboAnalyst 5.0. The analysis was performed on metabolites that play a role in FMC. The position of the pathways on the Y-axis and the vibrancy of the color are determined by their respective p-values. A higher value on the Y-axis and a darker shade of red color indicates greater significance of the pathway in relation to the metabolites. The size of circles indicates the number of the selected FMC metabolites in the pathways: the greater the size, the more metabolites included in pathway.
Figure 2
Figure 2
STRINGdb analyzed the set of FMC-related proteins and displayed connections between them based on their relationship to one another. Colored nodes mean query proteins and first shell of interactors; filled nodes mean that 3D structure is known or predicted; empty nodes are those proteins of unknown 3D structure. Edges are drawn with up to seven differently colored lines, which represent the existence of the seven types of evidence used in predicting the associations: red line indicates the presence of fusion evidence; green line—neighborhood evidence; blue line—co-occurrence evidence; purple line—experimental evidence; yellow line—text-mining evidence; light-blue line—database evidence; black line—co-expression evidence. (A) Network based on proteins corresponding to the genes in Table 2. (B) Enriched network with CBL, GRB2, NOTCH1, PDGFRB, and TEK proteins added (notified with the red asterisks).
Figure 2
Figure 2
STRINGdb analyzed the set of FMC-related proteins and displayed connections between them based on their relationship to one another. Colored nodes mean query proteins and first shell of interactors; filled nodes mean that 3D structure is known or predicted; empty nodes are those proteins of unknown 3D structure. Edges are drawn with up to seven differently colored lines, which represent the existence of the seven types of evidence used in predicting the associations: red line indicates the presence of fusion evidence; green line—neighborhood evidence; blue line—co-occurrence evidence; purple line—experimental evidence; yellow line—text-mining evidence; light-blue line—database evidence; black line—co-expression evidence. (A) Network based on proteins corresponding to the genes in Table 2. (B) Enriched network with CBL, GRB2, NOTCH1, PDGFRB, and TEK proteins added (notified with the red asterisks).
Figure 3
Figure 3
The above figure depicts the clusters created for the genes in Table 2. Each cluster was created using k-means clustering, and each cluster was analyzed through the DAVID program.
Figure 4
Figure 4
Metabolite-Gene-Disease Interaction Network created through MetaboAnalyst’s 5.0 Network Analysis application. A total of 35 genes and 21 metabolites were analyzed. Six subnetworks were created: subnetwork 1 with 86 nodes, 100 edges, and 21 seeds and five subnetworks with 3 nodes, 2 edges, and 1 seed. Subnetwork 1 is more informative. It contains 8 genes and 13 metabolites. Shapes represent the following: circles—genes, diamonds—metabolites, and squares—diseases; colors show the following: red—activated, blue—inhibited, and purple—neutral; size represents importance. Edge color represents correlation: red—positive; blue—negative.
Figure 5
Figure 5
Integrated Pathway Analysis of metabolite and gene biomarkers shown in breast cancer. The position of the pathways on the Y-axis is determined by their respective p-values. The larger the size of the circle, the greater the pathway enrichment. The darker the color of each circle on the plot, the greater its significance. The size of circles indicates the ratio of number of elements involved in pathway to the number of all pathway’s members. The vibrancy of the color reflects pathway impact score, which represents significance of given pathway relative to global integrative network. Outlined by oval, the following are metabolic pathways important in cancer development: Choline metabolism, Focal adhesion, Central carbon metabolism, Proteoglycans in cancer, Phospholipase D signaling pathway, and GAP junction.
Figure 6
Figure 6
The classifier performances with different algorithms obtained through cross-validation classifier.
Figure 7
Figure 7
ROC curve for Random Forest Model. The ROC (receiver operating characteristic) curve is a graphical representation of the performance of a classifier in distinguishing between positive and negative samples. The colors of the curve represent threshold value set to get the best pair of true FPR/TPR point.

Similar articles

Cited by

References

    1. Zheng J.-S., Wei R.-Y., Wang Z., Song J., Ge Y.-S., Wu R. Serum metabolomic analysis of feline mammary carcinomas based on LC-MS and MRM techniques. J. Vet. Res. 2020;64:581–588. doi: 10.2478/jvetres-2020-0070. - DOI - PMC - PubMed
    1. Gameiro A., Urbano A.C., Ferreira F. Emerging biomarkers and targeted therapies in feline mammary carcinoma. Vet. Sci. 2021;8:164. doi: 10.3390/vetsci8080164. - DOI - PMC - PubMed
    1. Wei Y., Jasbi P., Shi X., Turner C., Hrovat J., Liu L., Rabena Y., Porter P., Gu H. Early breast cancer detection using untargeted and targeted metabolomics. J. Proteome Res. 2021;20:3124–3133. doi: 10.1021/acs.jproteome.1c00019. - DOI - PubMed
    1. Yu C., Zheng H.H., Zhang Y.Z., Du C.T., Xie G.H. Identification of canine mammary tumor-associated metabolites using untargeted metabolomics. Theriogenology. 2023;211:84–96. doi: 10.1016/j.theriogenology.2023.08.010. - DOI - PubMed
    1. Weininger D. SMILES, a chemical language and information system. 1. Introduction to methodology and encoding rules. J. Chem. Inf. Comput. Sci. 1988;28:31–36. doi: 10.1021/ci00057a005. - DOI

LinkOut - more resources